. 2022 Sep 15;151(6):930-943.
doi: 10.1002/ijc.34146. Epub 2022 Jun 19.

Integrin alpha 6 is upregulated and drives hepatocellular carcinoma progression through integrin α6β4 complex

Affiliations

Integrin alpha 6 is upregulated and drives hepatocellular carcinoma progression through integrin α6β4 complex

Guixi Zheng et al. Int J Cancer. .

Abstract

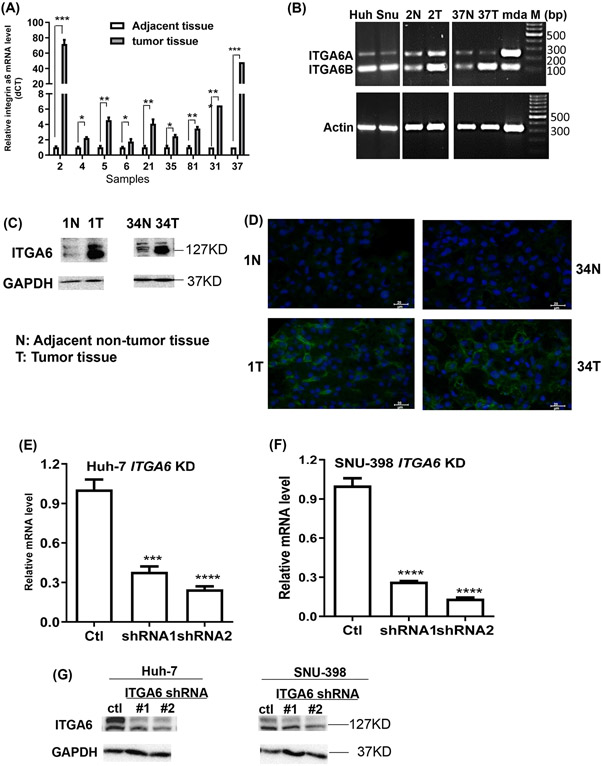
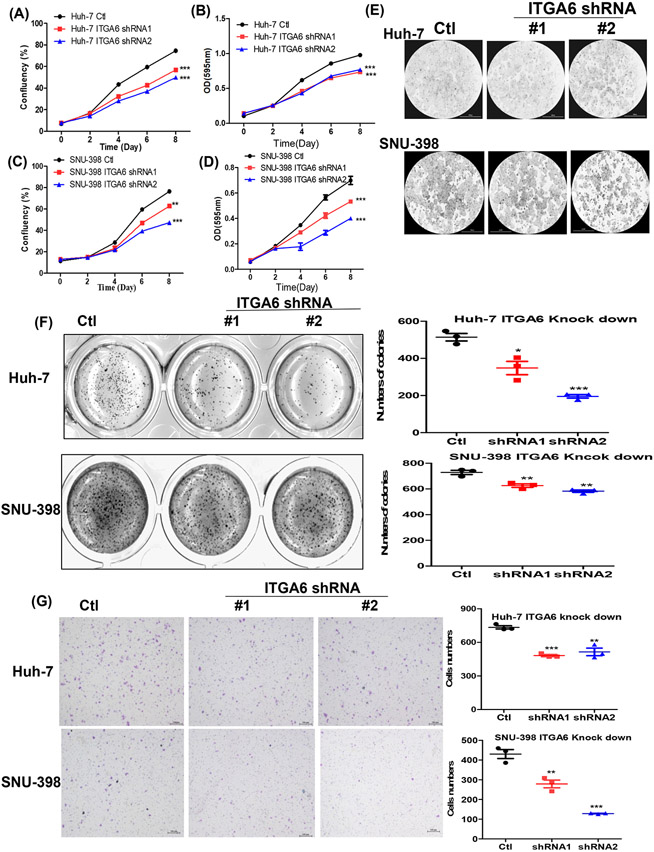
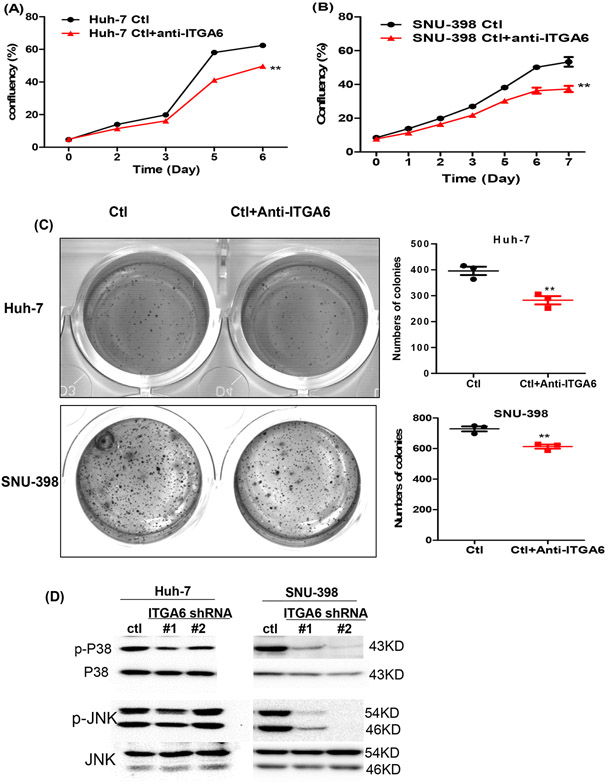
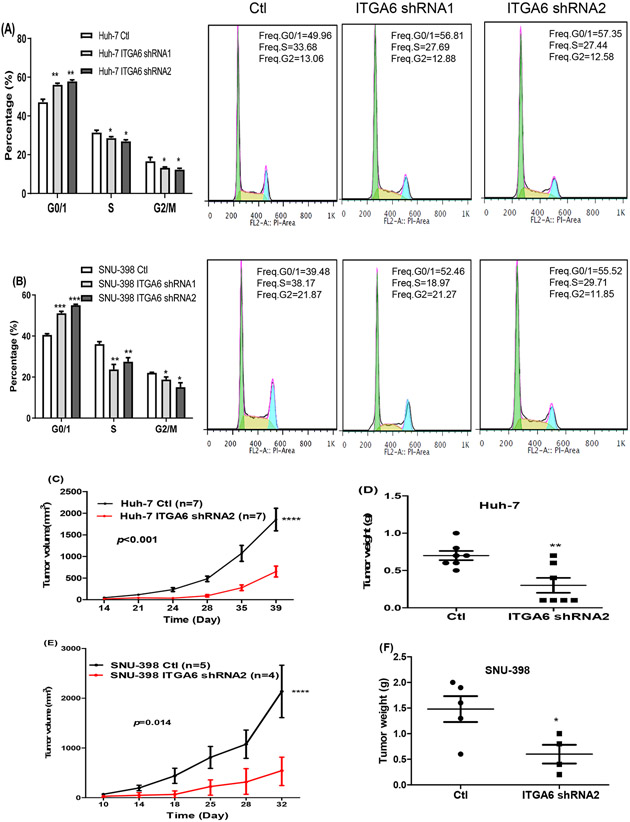
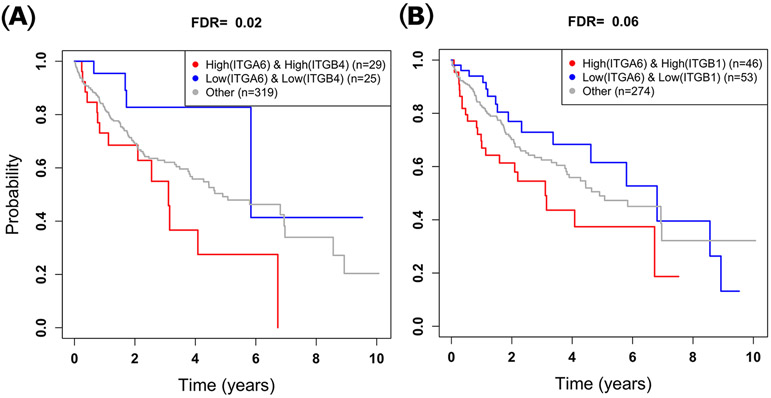
Integrin α6 (ITGA6) forms integrin receptors with either integrin β1 (ITGB1) or integrin β4 (ITGB4). How it functions to regulate hepatocellular carcinoma (HCC) progression is not well-elucidated. We found that ITGA6 RNA and protein expression levels are significantly elevated in human HCC tissues in comparison with paired adjacent nontumor tissues by RNA sequencing, RT-qPCR, Western blotting and immunofluorescence staining. Stable knockdown of ITGA6 with different ITGA6 shRNA expression lentivectors significantly inhibited proliferation, migration and anchorage-independent growth of HCC cell lines in vitro, and xenograft tumor growth in vivo. The inhibition of anchorage-dependent and -independent growth of HCC cell lines was also confirmed with anti-ITGA6 antibody. ITGA6 knockdown was shown to induce cell-cycle arrest at G0/G1 phase. Immunoprecipitation assay revealed apparent interaction of ITGA6 with ITGB4, but not ITGB1. Expression studies showed that ITGA6 positively regulates the expression of ITGB4 with no or negative regulation of ITGB1 expression. Finally, while high levels of ITGA6 and ITGB4 together were associated with significantly worse survival of HCC patients in TCGA data set, the association was not significant for high levels of ITGA6 and ITGB1. In conclusion, ITGA6 is upregulated in HCC tumors and has a malignant promoting role in HCC cells through integrin α6β4 complex. Thus, integrin α6β4 may be a therapeutic target for treating patients with HCC.

Keywords: hepatocellular carcinoma; integrin α6; integrin α6β4; migration; proliferation.


Conflict of interest statement

CONFLICT OF INTEREST

The authors declare that they have no conflict of interests.

Figures

Figure1.
Figure1.
Expression of ITGA6 in HCC tumor and paired adjacent non-tumor tissues and knockdown of ITGA6 in HCC cell lines. (A) ITGA6 mRNA levels in 9 cases by RT-qPCR. Data presented are mean±SEM of triplicate measurements. Statistical significance of the difference was assessed by two-tailed t-test: *, P< 0.05, **, P< 0.01, ***, P< 0.001. (B) Relative mRNA levels of ITGA6A and ITGA6B variants are shown by agarose gel electrophoresis of PCR products amplified for 30 cycles with a pair of primers covering both variant RNA sequences. Huh and Snu stand for human HCC Huh-7 and SNU-398 cell lines, respectively. mda stands for human breast cancer MDA-MB-231 cell line, which is known to express the two ITGA6 variants and used as a positive control. M: molecular marker in base pair. (C) ITGA6 protein levels in 2 cases by Western blotting assay. GAPDH levels were used to verify equal sample loading. (D) Increased ITGA6 protein levels in tumors as compared with adjacent non-tumor tissues in 2 cases by immunofluorescence staining. ITGA6 was shown in green, and DAPI was used to stain cell nuclei in blue. The scale bar=20 μm. (E & F) Two ITGA6 shRNA expression vectors and a control vector were transfected into HCC cell lines via lentiviral infection. ITGA6 stable knockdown (KD) in Huh-7 (E) and SNU-398 (F) cells at its mRNA level was confirmed with RT-qPCR. Data presented are mean±SEM of triplicate measurements. Statistical significance of the differences was assessed by one-way ANOVA: ***, P< 0.001, ****, P<0.0001. (G) ITGA6 stable knockdown was also confirmed at its protein level with Western blotting. GAPDH protein levels were used to verify equal sample loading.
Figure 2.
Figure 2.
Knockdown of ITGA6 inhibited the growth and migration of HCC cells. Anchorage-dependent growth of the paired cell lines was assessed with a confluence assay (A and C) with representative confluence images (E) and an MTT assay (B and D). Data presented are mean±SEM of four replicate measurements. Statistical significance of the differences was assessed by two-way ANOVA test: **, P< 0.01, ***, P<0.001. Anchorage-independent growth of the paired HCC cell lines was assessed with a soft agar assay (F), and their migration in a transwell assay (G, scale bar=200 μm). Data presented are mean±SEM of triplicate measurements. Statistical significance of the differences is assessed by one-way ANOVA: *, P< 0.05, **, P< 0.01, ***, P< 0.001.
Figure 3.
Figure 3.
Blockade or knockdown ITGA6 inhibited the growth of HCC cells and phosphorylation of p38 and JNK. Anchorage-dependent growth of control antibody (Ctl) or anti-ITGA6-treated cell lines (anti-ITGA6) was assessed with confluence assay (A and B). Data presented are mean±SEM of four replicate measurements. Statistical significance of the differences was assessed by two-way ANOVA test: **, P< 0.01. Anchorage-independent growth of the Ctl and anti-ITGA6-treated HCC cell lines was assessed with a soft agar assay (C). Data presented are mean±SEM of triplicate measurements. Statistical significance of the differences is assessed by two-tailed t-test: **, P< 0.01. (D) Knockdown of ITGA6 reduced the levels of phosphor-p38 (p-p38) and p-JNK relative to the levels of total p38 and JNK in Huh-7 and SNU-398 cells by Western blotting.
Figure 4.
Figure 4.
Knockdown of ITGA6 induced cell-cycle arrest at G0/G1 phase and inhibited xenograft tumor growth. Knockdown of ITGA6 induced cell cycle arrest at G0/G1 in Huh-7 cells (A) and SNU-398 cell (B). Data presented are mean±SEM of triplicate measurements. Statistical significance of the differences of each cycle phase was assessed by one-way ANOVA: *, P< 0.05, **, P< 0.01, ***, P< 0.001. Representative flowcytometry histograms of the cell distribution in the three phases of cell cycle are also provided for the control and ITGA6 knockdown cells. Tumor growth curve and weight of tumors formed by Huh-7 (C, D) and SNU-398 (E, F) Ctl and matched ITGA6-shRNA cells in nude mice. The tumor volume was calculated using the formula: v=length × width × width / 2. Statistical significance of the differences of survival curve was assessed by two-way ANOVA test: ****, P< 0.0001. Individual tumor weight from two group mice was collected at the end of experiment. Statistical significance of the differences was assessed by two-tailed t-test: *, P< 0.05, **, P< 0.01.
Figure 5.
Figure 5.
ITGA6 interacts with ITGB4 and stimulates ITGB4 expression in HCC cells. (A) Anti-ITGA6 antibody and matched control Anti-IgG were used to pull down proteins by immunoprecipitation assay in HCC cells. ITGB4 was detected in proteins pulled by the anti-ITGA6 antibody by Western blotting assay. The Western blots of Input shows equal amounts of ITGA6, ITGB4, ITGB1 and GAPDH proteins were subjected to pulldown by the control or anti-ITGA6 antibody. (B) Knockdown of ITGA6 significantly reduced ITGB4 mRNA levels in Huh-7 and SNU-398 cells. Data presented are mean±SEM of triplicate measurements with RT-qPCR assay. Statistical significance of the differences of each gene between the Ctl and two knockdown cells was assessed by one-way ANOVA: P< 0.01, ***, P< 0.001. (C) Knockdown of ITGA6 reduced protein levels of ITGB4, but not ITGB1, in Huh-7 and SNU-398 cells. (D and E) Over-expression of ITGA6 (OE) in HCC cells resulted in an increase of ITGB4 mRNA and protein, but had no effect or even decreased the expression of ITGB1. Data presented are mean±SEM of triplicate measurements in RT-qPCR assay. Statistical significance of the differences of each gene between the Ctl and OE cells was assessed by two-tailed t-test: P< 0.01, ***, P< 0.001.
Figure 6.
Figure 6.
Association of expression levels of ITGA6 and ITGB4 pair orITGA6 and ITGB1 pair with HCC patient survival. (A) Patients with high expression levels of ITGA6 and ITGB4 have significantly worse overall survival compared to those with low expression of levels of ITGA6 and ITGB4. (B) The difference in overall survival time between patients who have high vs. low expression levels of ITGA6 and ITGB1 is insignificant.

References

    1. Sia D, Villanueva A, Friedman SL, Llovet JM. Liver Cancer Cell of Origin, Molecular Class, and Effects on Patient Prognosis. Gastroenterology 2017;152: 745–61. - PubMed
    1. Bray F, Ferlay J, Soerjomataram I, Siegel RL, Torre LA, Jemal A. Global cancer statistics 2018: GLOBOCAN estimates of incidence and mortality worldwide for 36 cancers in 185 countries. CA Cancer J Clin 2018;68: 394–424. - PubMed
    1. El-Serag HB. Hepatocellular carcinoma. N Engl J Med 2011;365: 1118–27. - PubMed
    1. Chen Y, Mo L, Wang X, Chen B, Hua Y, Gong L, Yang F, Li Y, Chen F, Zhu G, Ni W, Zhang C, et al. TPGS-1000 exhibits potent anticancer activity for hepatocellular carcinoma in vitro and in vivo. Aging (Albany NY) 2020;12. - PMC - PubMed
    1. Shen S, Peng H, Wang Y, Xu M, Lin M, Xie X, Peng B, Kuang M. Screening for immune-potentiating antigens from hepatocellular carcinoma patients after radiofrequency ablation by serum proteomic analysis. BMC Cancer 2018;18. - PMC - PubMed

Publication types

MeSH terms