. 2022:2500:211-237.
doi: 10.1007/978-1-0716-2325-1_15.

Surface-Induced Dissociation for Protein Complex Characterization

Affiliations

Surface-Induced Dissociation for Protein Complex Characterization

Sophie R Harvey et al. Methods Mol Biol. 2022.

Abstract

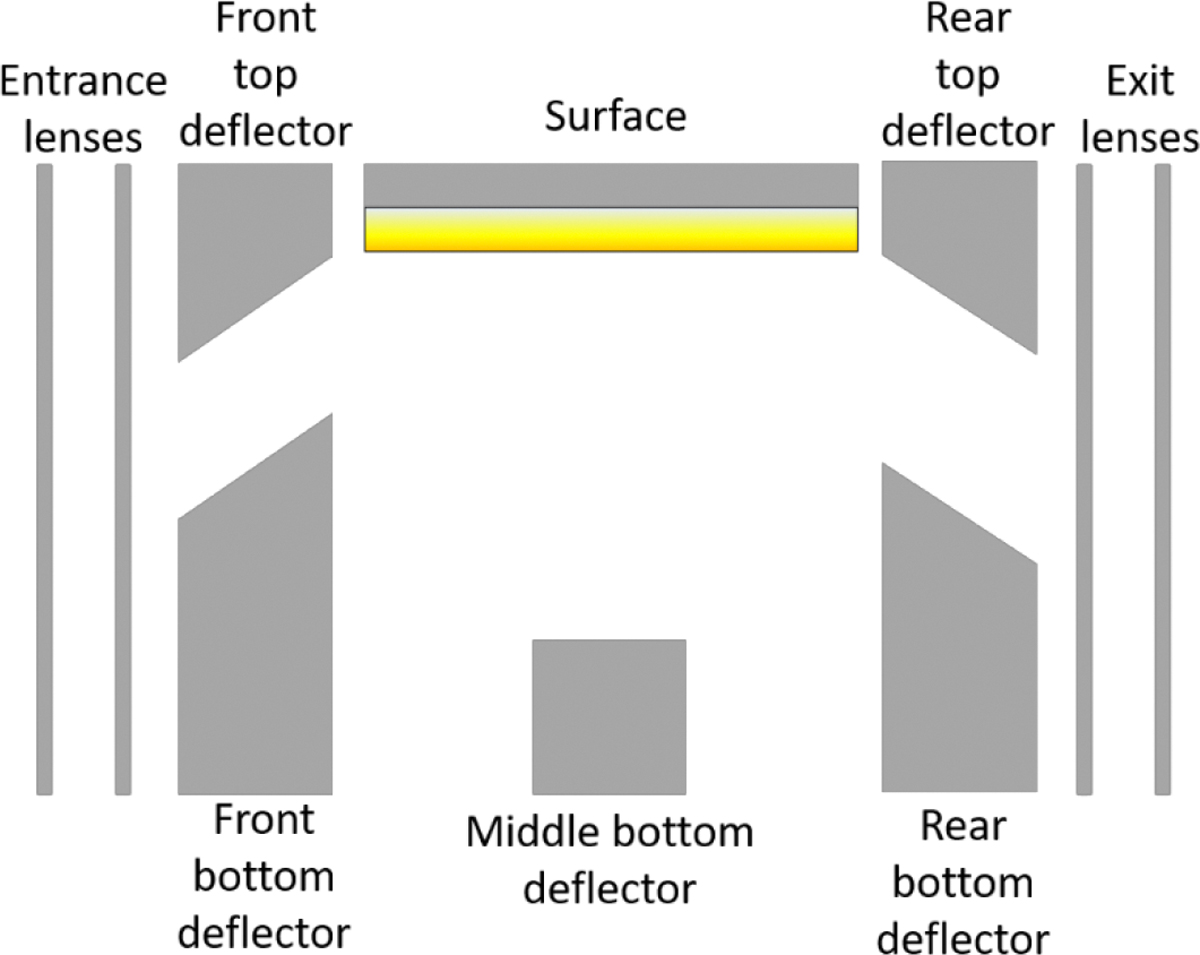
Native mass spectrometry (nMS) enables intact non-covalent complexes to be studied in the gas phase. nMS can provide information on composition, stoichiometry, topology, and, when coupled with surface-induced dissociation (SID), subunit connectivity. Here we describe the characterization of protein complexes by nMS and SID. Substructural information obtained using this method is consistent with the solved complex structure, when a structure exists. This provides confidence that the method can also be used to obtain substructural information for unknowns, providing insight into subunit connectivity and arrangements. High-energy SID can also provide information on proteoforms present. Previously SID has been limited to a few in-house modified instruments and here we focus on SID implemented within an in-house-modified Q Exactive UHMR. However, SID is currently commercially available within the Waters Select Series Cyclic IMS instrument. Projects are underway that involve the NIH-funded native MS resource (nativems.osu.edu), instrument vendors, and third-party vendors, with the hope of bringing the technology to more platforms and labs in the near future. Currently, nMS resource staff can perform SID experiments for interested research groups.

Keywords: High-resolution mass spectrometry; Native mass spectrometry; Protein complex; Protein mass spectrometry; Proteoform identification; Surface-induced dissociation.


Figures

Figure 1:
Figure 1:
Schematic representation of an SID device incorporated into a Waters Synapt G2.[30]
Figure 2:
Figure 2:
A) Schematic representation of a modified Q Exactive UHMR with SID installed in place of the transport multiple (Reproduced from Ref [34] with permission from The Royal Society of Chemistry) and B) photograph of surface assembly.
Figure 3:
Figure 3:
Photographs of the static nESI sample holder for a nano-flexspray source with platinum wire inserted. A) Back view with peek screw removed. The piece of aluminum foil, inserted in the metal housing can be observed. B) After assembly of the sample holder, the platinum wire must be in contact with the aluminum inside the metal housing and protrude from the front of the peek nut. The red peek screw is connected to a 3 mL syringe for backing pressure. C) Sample holder with filled nESI needle, ready for analysis. The platinum wire is inserted inside the needle and is in direct contact with the sample.
Figure 4:
Figure 4:
Mass spectrum of 1 μM rat 20S proteasome prepared in 150 mM AmAc and acquired with −50 V in-source trapping, trap gas 9 and a resolution of 3,125 K. Measured mass is 719, 173 ± 160 Da
Figure 5:
Figure 5:
250 V HCD of 20S proteasome from rat prepared in 150 mM AmAc, acquired with −50 V in-source trapping at 3, 125 K resolution. A) acquired with trap gas 6 B) acquired with trap gas 4. Identity of the monomers observed in B will be discussed below in the section on interpreting the data.
Figure 6:
Figure 6:
Relative voltage diagram showing how the SID voltage is defined (the difference between the voltage difference between the last optic before the SID device or the SID entrance lens and the surface. Increasing SID voltages are achieved by lowering the C-trap offset (during the injection) and lowering the SID devices from the surface onwards. Adapted with permission from VanAernum et. al., Anal Chem, 2019, 91, 3611.[18] Copyright (2019) American Chemical Society
Figure 7:
Figure 7:
Lower energy SID of rat 20S proteasome acquired with −50 V in-source trapping at 3,125 K resolution and a trap gas of 9. Prepared in either A) 150 mM AmAc (average charge state of precursor +61, determined from UniDec[59]) and acquired with 85 V SID (corresponding to an average energy of 5,185 eV) or B) 120 mM AmAc + 30 mM TEAA (average charge state of precursor +45, determined from UniDec) and acquired with 105 V SID (corresponding to an average energy of 4,725 eV).
Figure 8:
Figure 8:
Higher energy SID of rat 20S proteasome acquired with −50 V in-source trapping at 3, 125 K resolution prepared in either 150 mM AmAc (average charge state of precursor +61, determined from UniDec[59]) and acquired with 185 V SID (corresponding to an average energy of 11,346 eV) with A) trap gas 9, B) trap gas 7 and C) trap gas 5. With trap gas 7, greater coverage of the monomers is obtained, as demonstrated with the increased number of peaks in the low mass region, the identity of the monomers is discussed below in the interpreting data section.
Figure 9:
Figure 9:
Monomers and dimers identified in A) 250 V CID trap gas 4 and B) 185 V SID with trap gas 7. Data analyzed using UniDec. In both cases data was acquired with – 50 V in source trapping and at 3, 125 K resolution.

References

    1. Ben-Nissan G, Sharon M (2018) The application of ion-mobility mass spectrometry for structure/function investigation of protein complexes. Curr Opin Chem Biol 42:25–33. 10.1016/j.cbpa.2017.10.026 - DOI - PMC - PubMed
    1. Heck AJR, Heuvel RHH van den (2004) Investigation of intact protein complexes by mass spectrometry. Mass Spectrom Rev 23:368–389. 10.1002/mas.10081 - DOI - PubMed
    1. Liko I, Allison TM, Hopper JT, Robinson CV (2016) Mass spectrometry guided structural biology. Curr Opin Struct Biol 40:136–144. 10.1016/j.sbi.2016.09.008 - DOI - PubMed
    1. Eschweiler JD, Kerr R, Rabuck-Gibbons J, Ruotolo BT (2017) Sizing Up Protein–Ligand Complexes: The Rise of Structural Mass Spectrometry Approaches in the Pharmaceutical Sciences. Annu Rev Anal Chem 10:25–44. 10.1146/annurev-anchem-061516-045414 - DOI - PubMed
    1. Sarni S, Biswas B, Liu S, et al. (2020) HIV-1 Gag protein with or without p6 specifically dimerizes on the viral RNA packaging signal. J Biol Chem 295:14391–14401. 10.1074/jbc.RA120.014835 - DOI - PMC - PubMed

Publication types

LinkOut - more resources