. 2022 Jul 4;221(7):e202106046.
doi: 10.1083/jcb.202106046. Epub 2022 Jun 3.

ER-lysosome lipid transfer protein VPS13C/PARK23 prevents aberrant mtDNA-dependent STING signaling

Affiliations

ER-lysosome lipid transfer protein VPS13C/PARK23 prevents aberrant mtDNA-dependent STING signaling

William Hancock-Cerutti et al. J Cell Biol. .

Abstract

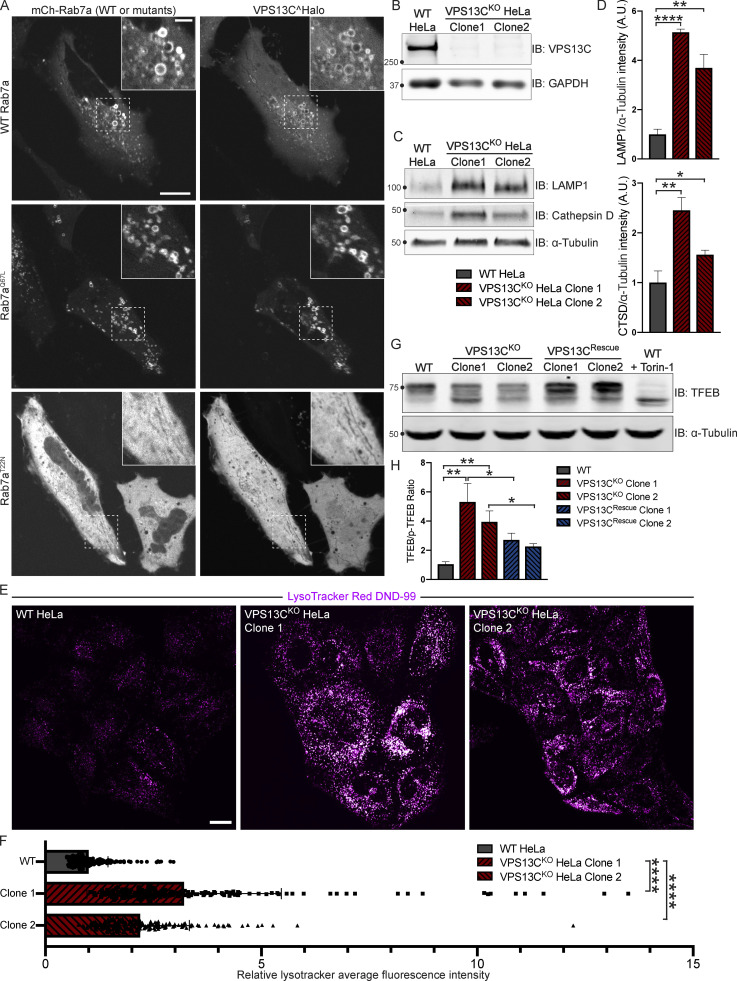
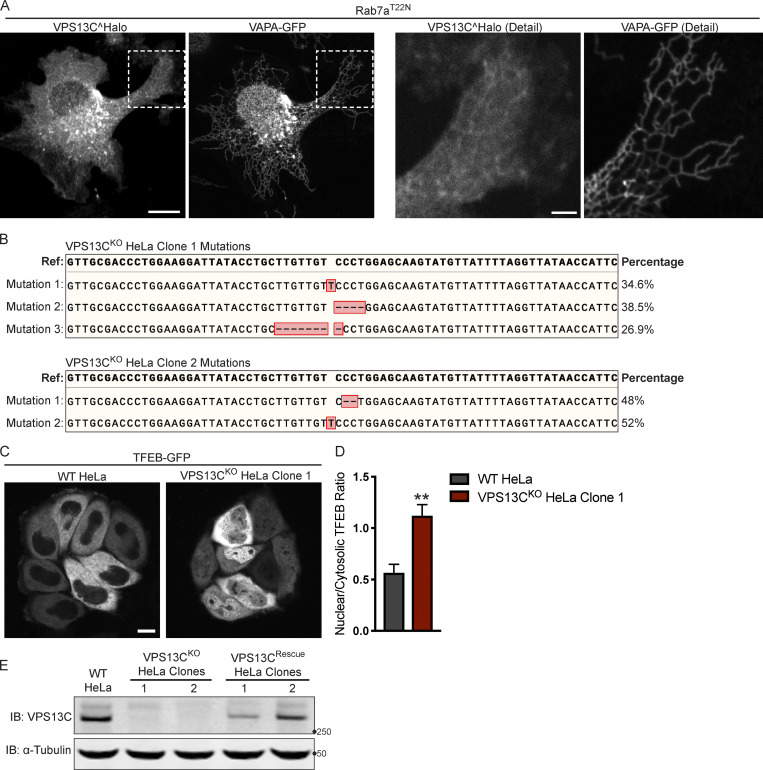
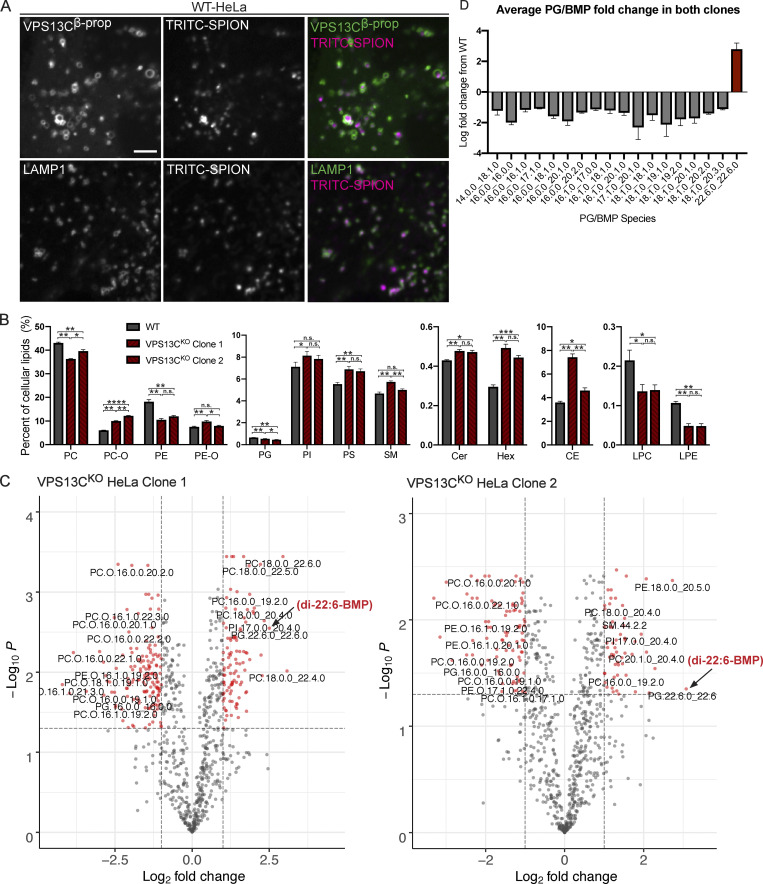
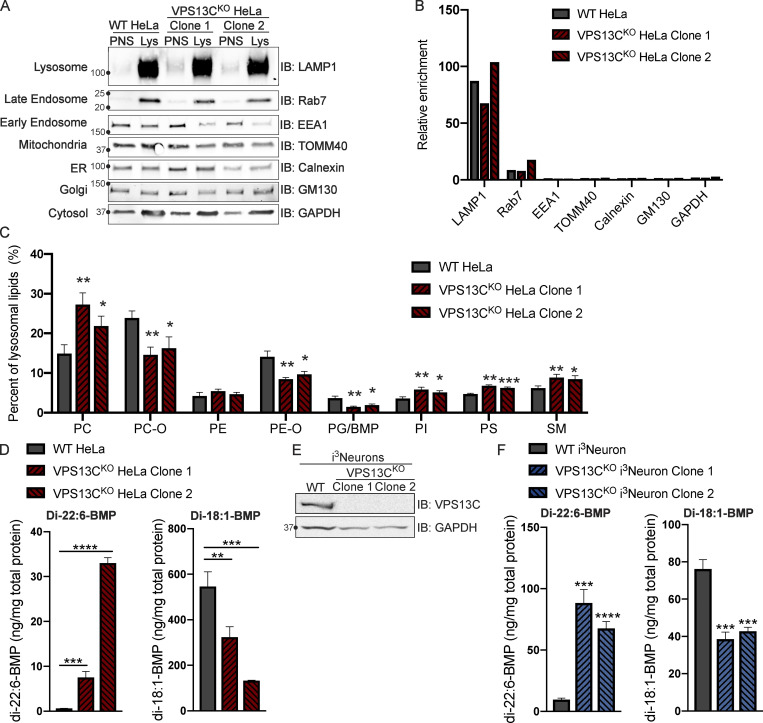
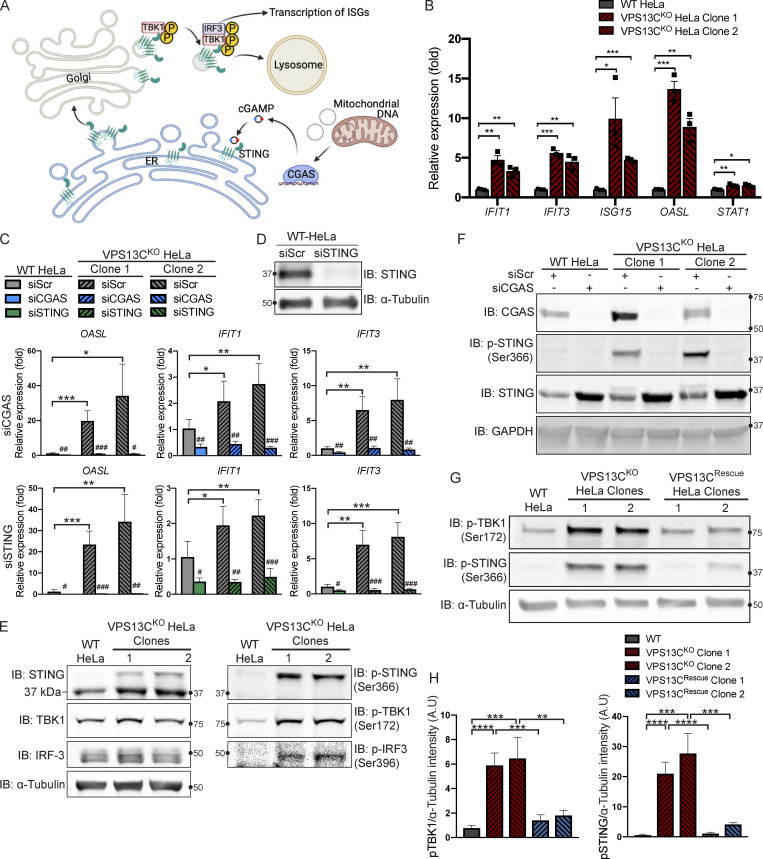
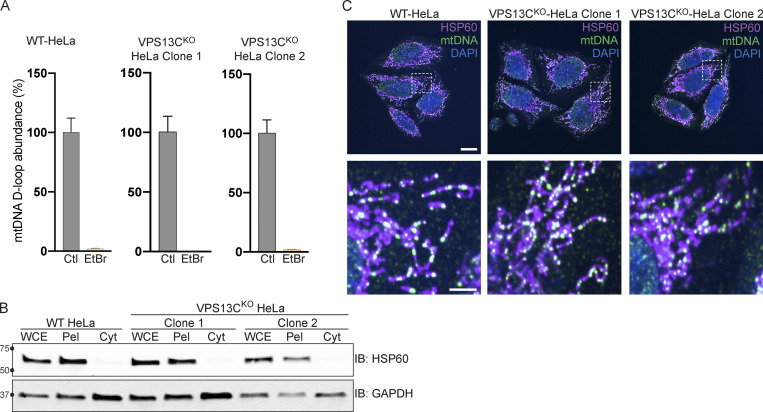
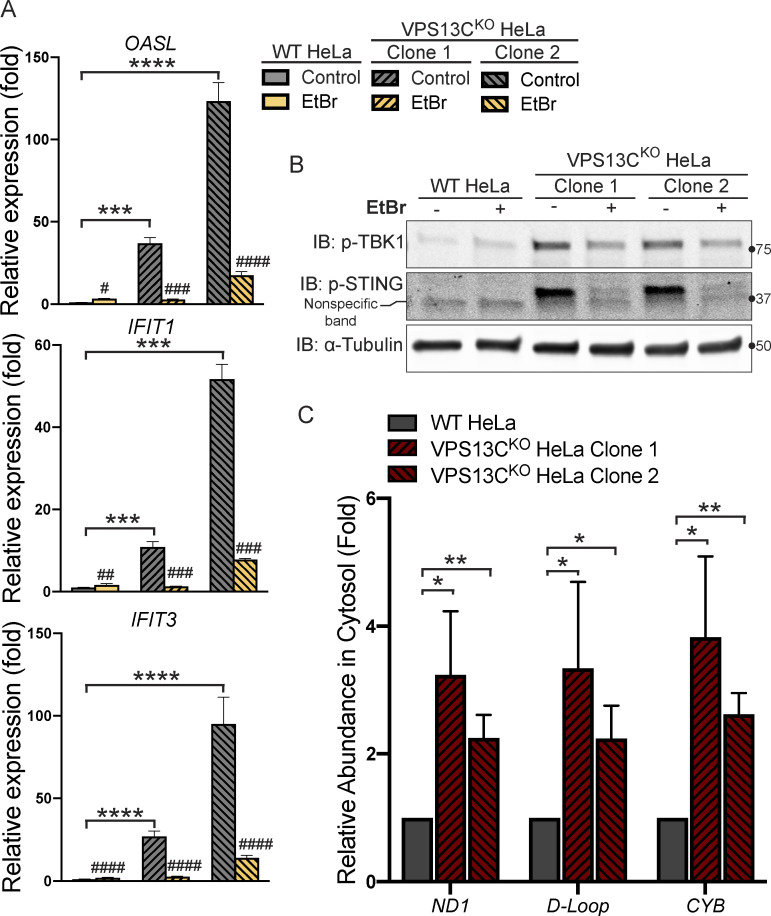
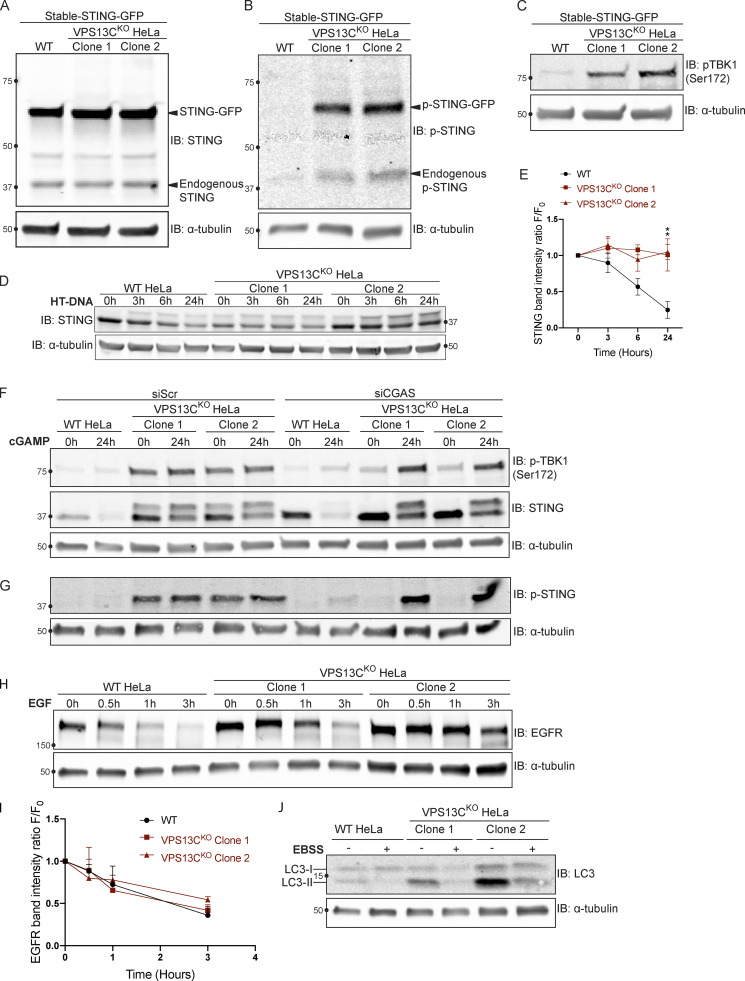
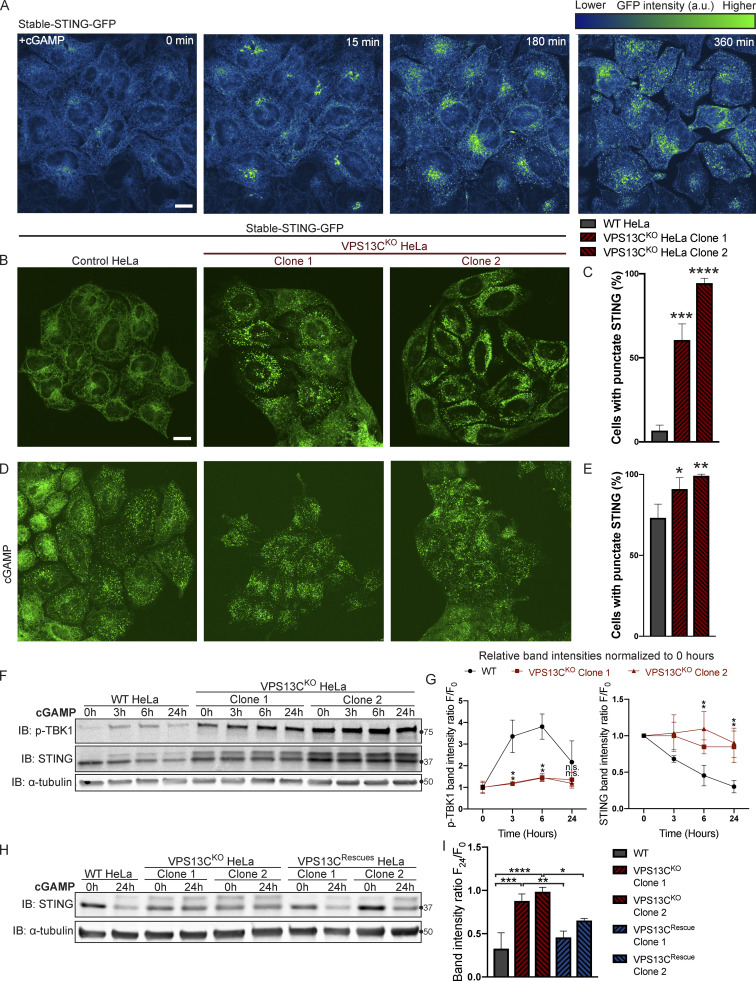
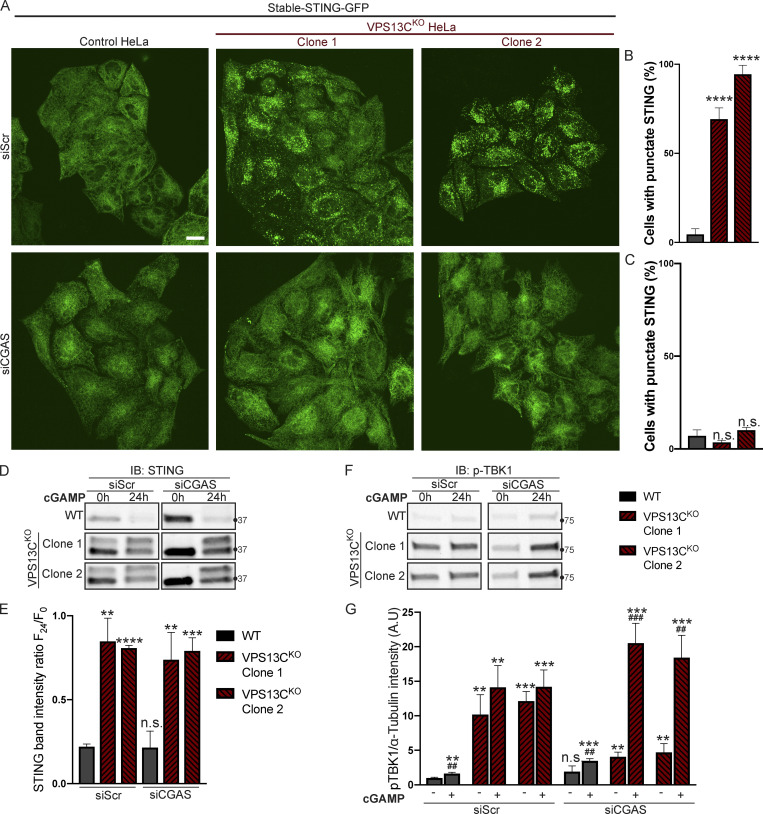
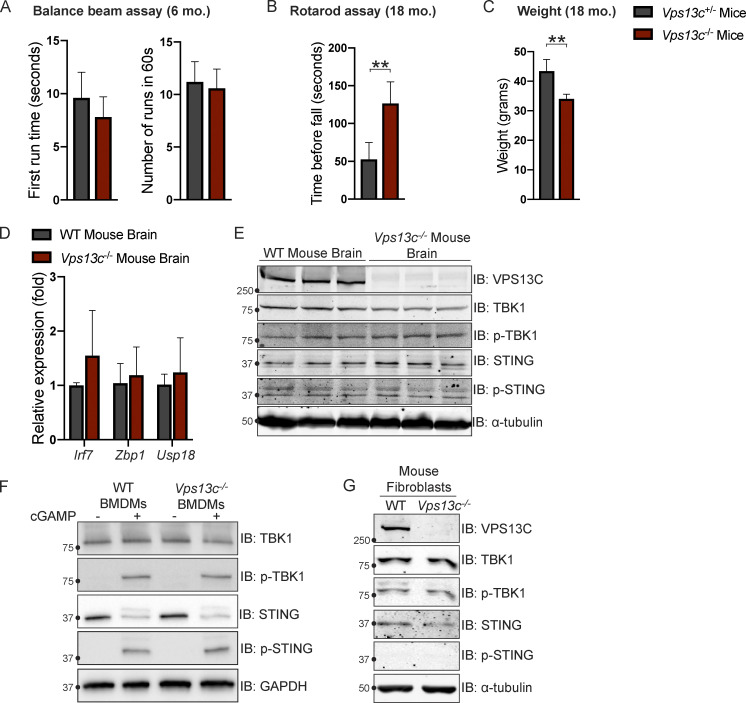
Mutations in VPS13C cause early-onset, autosomal recessive Parkinson's disease (PD). We have established that VPS13C encodes a lipid transfer protein localized to contact sites between the ER and late endosomes/lysosomes. In the current study, we demonstrate that depleting VPS13C in HeLa cells causes an accumulation of lysosomes with an altered lipid profile, including an accumulation of di-22:6-BMP, a biomarker of the PD-associated leucine-rich repeat kinase 2 (LRRK2) G2019S mutation. In addition, the DNA-sensing cGAS-STING pathway, which was recently implicated in PD pathogenesis, is activated in these cells. This activation results from a combination of elevated mitochondrial DNA in the cytosol and a defect in the degradation of activated STING, a lysosome-dependent process. These results suggest a link between ER-lysosome lipid transfer and innate immune activation in a model human cell line and place VPS13C in pathways relevant to PD pathogenesis.


Figures

Figure 1.
Figure 1.
VPS13C is a Rab7-binding protein implicated in maintaining lysosomal homeostasis. (A) Live HeLa cells expressing full-length VPS13C^Halo with WT mCherry-Rab7a (top row), constitutively active mCherry-Rab7aQ67L (middle row), or mCherry-Rab7aT22N (bottom row). (B) IB of VPS13C in WT HeLa cells and two individual clonal cell lines after CRISPR-Cas9–mediated KO of VPS13C. (C and D) IB of Lamp1 and Cathepsin D in WT and VPS13CKO cells (C), quantified in D. α-Tubulin was used as a loading control. n = 3 biological replicates. (E and F) Live WT and VPS13CKO HeLa cells stained with LysoTracker Red DND-99 (50 nM; E), quantified in F; n = 3 biological replicates, >182 cells per cell line. (G) IB of TFEB in WT, VPS13CKO, and VPS13CRescue HeLa cells. As a positive control, WT cells were treated with 1 μM Torin-1 for 1 h. α-Tubulin was used as a loading control. Images from the same blot as Fig. S1 E. (H) Quantification of the ratio of unphosphorylated (lower band) to phosphorylated (upper band) TFEB from G. n = 3 biological replicates. Scale bars, 20 μm. Inset scale bars, 5 μm. *, P < 0.05; **, P < 0.01; ****, P < 0.0001. Data were compared using two-sided t tests. Error bars represent ±SD. Source data associated with this figure can be found at https://doi.org/10.5281/zenodo.6416363. Source data are available for this figure: SourceData F1.
Figure S1.
Figure S1.
Mutations in the VPS13C locus in VPS13CKO clones 1 and 2. (A) Live HeLa cells expressing full-length VPS13C^Halo with VAPA-GFP and mCherry-Rab7aT22N (not depicted). Enlarged images of boxed areas shown to the right. (B) Percentage abundance of each mutated allele of 48 bacterial colonies sequenced. The HeLa cell genome is known to be aneuploid. (C) Live WT and VPS13CKO (clone 1) HeLa cells expressing TFEB-GFP. (D) Quantification of nuclear to cytosolic GFP intensity from C, n = 175 cells across three biological replicates. (E) IB showing lack of VPS13C band in VPS13CKO cells and return of band in repaired VPS13CRescue clones. Images from the same blot as Fig. 1 G. Scale bars, 20 μm. Inset scale bars, 5 μm. **, P < 0.01. Data were compared using a two-sided t test. Error bars represent ±SD. Source data associated with this figure can be found at https://doi.org/10.5281/zenodo.6416363. Source data are available for this figure: SourceData FS1.
Figure S2.
Figure S2.
Lipidomics of whole-cell and purified lysosomes. (A) Colocalization of TRITC-labeled SPIONs with overexpressed GFP-VPS13Cβprop (top row) or LAMP1-GFP (bottom row) after 4-h pulse and 15-h chase. Scale bar, 5 μm. (B) Percentages of lipid classes in WT and VPS13CKO whole-cell lysate normalized to total measured cell lipid content. n = 3 biological replicates. (C) Volcano plots of individual lipid species in VPS13CKO purified lysosomes. Species that surpass the q-value and fold-change thresholds are shown as red dots. Lipid species labels are centered under corresponding dot. Arrows show PG.22.6.0_22.6.0/di-22:6-BMP. (D) Barplot showing the average fold-change of PG/BMP species in both clones. n = 3 biological replicates. Only species with q values < 0.05 are shown. For lipidomic data, *, q < 0.05; **, q < 0.01; ***, q < 0.001. For all other data, *, P < 0.05; **, P < 0.01; ***, P < 0.001; ****, P < 0.0001 compared with WT control. Lipidomic data in C were compared using FDR. All other data were compared using two-sided t tests. Error bars represent ±SD. Source data associated with this figure can be found at https://doi.org/10.5281/zenodo.6416363.
Figure 2.
Figure 2.
Loss of VPS13C results in altered lysosomal lipid composition. (A) IB showing abundance of organelle markers in postnuclear supernatant (PNS) and lysosomal fractions (Lys) from WT and VPS13CKO HeLa cells. Equal amounts of total protein were loaded in each lane. Note the striking enrichment of LAMP1 in lysosomal fractions. (B) Quantification of band intensities from A normalized to GAPDH to show relative enrichment. (C) Percentages of phospho- and sphingolipid classes in WT and VPS13CKO lysosomal fractions normalized to total measured lysosomal lipid content. n = 4 biological replicates. (D) Concentrations of di-22:6- and di-18:1-BMP normalized to total protein in WT and VPS13CKO HeLa total cell lysate. n = 3 biological replicates. (E) IB showing loss of VPS13C protein expression in two clonal VPS13CKO i3Neuron lines after 14-d differentiation. GAPDH was used as a loading control. (F) Concentrations of di-22:6- and di-18:1-BMP normalized to total protein in WT and VPS13CKO i3Neuron (day 14) total cell lysate. n = 3 biological replicates. For lipidomic data, *, q < 0.05; **, q < 0.01; ***, q < 0.001. For all other data, *, P < 0.05; **, P < 0.01; ***, P < 0.001; ****, P < 0.0001 compared with WT control. Lipidomic data in C were compared using FDR. All other data were compared using two-sided t tests. Error bars represent ±SD. Source data associated with this figure can be found at https://doi.org/10.5281/zenodo.6416363.
Figure 3.
Figure 3.
Loss of VPS13C results in activation of the cGAS-STING pathway. (A) Cartoon schematic of cGAS-STING signaling pathway and STING trafficking through the Golgi to lysosomes for degradation. (B) qPCR of five ISG transcripts (IFIT1, IFIT3, ISG15, OASL, and STAT1) shows increased expression in VPS13CKO HeLa cells. n = 3 biological replicates. Created with BioRender.com. (C) qPCR of three ISG transcripts after treatment with siRNA against cGAS (top row) or STING (bottom row). n = 4 biological replicates. (D) IB showing efficiency of STING depletion after treatment with anti-STING siRNA. (E) IB showing increased levels of phosphorylated STING, TBK1, and IRF3, indicating activation of the cGAS-STING pathway. Note that the upper band in lanes 2 and 3 of the anti-STING blot corresponds to p-STING (lanes 2 and 3 of the p-STING blot). (F) Treatment of siRNA against cGAS significantly depletes cGAS and also returns p-STING to WT levels in the VPS13CKO clones. cGAS knockdown also causes an increase in total STING levels in both WT and VPS13CKO cells. (G and H) P-TBK1 and p-STING are returned toward WT levels in VPS13CRescue clones (G), quantified in H. n = 3 biological replicates. *, P < 0.05; **, P < 0.01; ***, P < 0.001; ****, P < 0.0001. #, P < 0.05; ##, P < 0.01; ###, P < 0.001 in siCGAS or siSTING compared with siScr-treated cells. Data were compared using two-sided t tests. Error bars represent ±SD. Source data associated with this figure can be found at https://doi.org/10.5281/zenodo.6416363. Source data are available for this figure: SourceData F3.
Figure S3.
Figure S3.
Control experiments for data shown in Fig. 4 and normal mtDNA nucleoid morphology in VPS13CKO cells. (A) qPCR of a D-Loop mtDNA amplicon relative to the nuclear gene hB2M shows efficient depletion of mtDNA after treatment with EtBr. The controls reflect each of the cell lines (WT, VPS13CKO clone 1, and VPS13CKO clone 2) grown in normal media. n = 3 biological replicates. (B) IB showing that mitochondrial marker HSP60 is present in the whole cell extract (WCE) and pellet (Pel) but absent in the cytosolic fraction (Cyt), while the cytosolic marker GAPDH is present in all fractions. (C) Immunofluorescence showing that mitochondria (magenta) and mtDNA nucleoids (green) have grossly normal morphology in VPS13CKO HeLa cells. Scale bar, 20 μm. Inset scale bars, 5 μm. Error bars represent ±SD. Source data associated with this figure can be found at https://doi.org/10.5281/zenodo.6416363. Source data are available for this figure: SourceData FS3.
Figure 4.
Figure 4.
Activation of the cGAS-STING pathway in VPS13CKO cells is dependent on increased cytosolic mtDNA. (A) qPCR of three ISG transcripts shows that depletion of mtDNA with EtBr reduces ISG levels in VPS13CKO cells to or near WT levels. n = 3 biological replicates. (B) p-TBK1 and p-STING are reduced in EtBr-treated VPS13CKO cells. (C) Levels of three mtDNA amplicons (ND1, D-Loop, and CYB) are elevated in the cytosolic fraction of VPS13CKO cells detected by qPCR and normalized to nuclear gene hB2M. n = 3 biological replicates. *, P < 0.05; **, P < 0.01; ***, P < 0.001; ****, P < 0.0001. #, P < 0.05; ##, P < 0.01; ###, P < 0.001; #### < 0.0001 in EtBr compared with untreated cells. Data were compared using two-sided t tests. Error bars represent ±SD. Source data associated with this figure can be found at https://doi.org/10.5281/zenodo.6416363. Source data are available for this figure: SourceData F4.
Figure S4.
Figure S4.
Supplemental data for Figs. 5 and 6 with EFGR and LC3 degradation. (A) IB showing similar levels of stable STING-GFP expression in WT and VPS13CKO cells. (B) IB showing increased levels of p-STING in VPS13CKO cells (both endogenous and STING-GFP). (C) IB showing increased levels of p-TBK1 in VPS13CKO cells. (D) Time course of WT and VPS13CKO cells treated with HT-DNA (500 ng/ml) for 0, 3, 6, and 24 h. (E) As with cGAMP treatment, STING is not significantly degraded in VPS13CKO cells, quantified in E. n = 2 biological replicates. (F) Intact blot from which the data from Fig. 6, E and G, were extracted. (G) IB of the same samples as in F with anti p-STING antibody. (H) IB of EGFR in WT and VPS13CKO cells treated with 100 ng/ml EGF for 0.5, 1, and 3 h. (I) Quantification from A of band intensity at various timepoints (F) normalized to EGFR intensity at 0 h (F0), showing no defect in EGFR degradation kinetics. n = 3 biological replicates. (J) IB of LC3 in WT and VPS13CKO cells after 6-h starvation in Earle’s balanced salt solution (EBSS). Note that the ratio of lipidated LC3-II to LC3-I is elevated under basal conditions in VPS13CKO cells, possibly downstream of STING activation, as previously reported (Fischer et al., 2020; Gui et al., 2019). **, P < 0.01. Time course data were compared using two-way ANOVA followed by FDR multiple comparisons testing. All other data were compared using two-sided t tests. Error bars represent ±SD. Source data associated with this figure can be found at https://doi.org/10.5281/zenodo.6416363. Source data are available for this figure: SourceData FS4.
Figure 5.
Figure 5.
STING is activated and translocated out of the ER at baseline in VPS13CKO cells. (A) Selected frames from time lapse of stable STING-GFP in WT HeLa cells after treatment with 50 µg/ml cGAMP (Video 1). The GFP signal is shown using the “Green Fire Blue” lookup table in ImageJ, in which lower intensities are displayed in blue and higher intensities are displayed in green, a key for which is shown at top right. STING-GFP is localized in an ER-like pattern 0 min after treatment and traffics to a Golgi-like pattern 15 min after treatment, a Golgi/vesicular pattern by 180 min after treatment, and a largely vesicular pattern by 360 min. (B) Under unstimulated basal conditions, STING-GFP is localized in an ER distribution in WT HeLa cells but a vesicular distribution in the majority of VPS13CKO cells. (C) The percentage of cells with vesicular pattern is quantified in C. n = 3 biological replicates. (D and E) treatment with cGAMP had only minimal effect on the already punctate distribution of STING-GFP in VPS13CKO cells, but induces a vesicular pattern in the majority of WT cells (D), quantified in E. n = 3 biological replicates. (F) In WT cells, treatment with 8 µg/ml cGAMP causes an increase in p-TBK1 at 3 and 6 h time points and a return to baseline at 24 h, along with a concomitant decrease in total STING levels over 24 h as STING is degraded. In VPS13CKO cells, the same treatment fails to cause a significant increase in p-TBK1, STING upper band (phospho-STING), or decrease in total STING levels. (G) Band intensity of p-TBK1 and STING at each time point is quantified relative to the 0-h value for each cell line. For quantification of the STING bands, both the upper and lower band were included. All bands were normalized to the loading control. n = 3 biological replicates. (H and I) Treatment with 8 µg/ml cGAMP in VPS13CRescue cells for 24 h results in STING degradation closer to WT levels, but fails to induce significant STING degradation in VPS13CKO cells (H), quantified in I. n = 3 biological replicates. Scale bars, 20 μM. *, P < 0.05; **, P < 0.01; ***, P < 0.001; ****, P < 0.0001 compared with WT control. cGAMP time course data were compared using two-way ANOVA followed by FDR multiple comparisons testing. All other data were compared using two-sided t tests. Error bars represent ±SD. Source data associated with this figure can be found at https://doi.org/10.5281/zenodo.6416363. Source data are available for this figure: SourceData F5.
Figure 6.
Figure 6.
Silencing of cGAS unmasks cGAMP responsiveness and reveals impaired STING degradation in VPS13CKO cells. (A–C) Treatment with siRNA against cGAS returns STING-GFP to an ER distribution in VPS13CKO cells, similar to untreated WT cells (A), quantified in B, while siScr has no effect, quantified in C. n = 3 biological replicates. (D) IB against STING in WT and VPS13CKO cells treated with either scrambled siRNA or siRNA against CGAS, followed by treatment with 8 µg/ml cGAMP for 24 h. Treatment with siRNA against CGAS returns STING to the unphosphorylated state in VPS13CKO cells, rendering them responsive to cGAMP. In VPS13CKO cells, the activation of STING is not followed by degradation, compared with WT cells. (E) Quantification of the total STING signal remaining 24 h after cGAMP treatment (F24) relative to 0 h (F0). For quantification of the STING bands, both the upper and lower band were included. All bands were normalized to the loading control. n = 3 biological replicates. (F) IB against p-TBK1 under the same conditions as E. WT cells behaved similarly in response to cGAMP treatment regardless of siScr or siCGAS pretreatment, with p-TBK1 levels returning to baseline after 24 h of cGAMP treatment, as shown by the time course of Fig. 5, F and G. In VPS13CKO cells pretreated with siScr, p-TBK1 remained at baseline after 24 h of cGAMP treatment, presumably never having increased, based on the time course in Fig. 5, F and G. In VPS13CKO cells pretreated with siCGAS, however, p-TBK1 was significantly elevated after 24 h of cGAMP, in accordance with the defect in STING degradation and continued STING signaling (E and F). (G) Quantification of p-TBK1 band intensity. All bands were normalized to the loading control. n = 3 biological replicates. Scale bars, 20 μM. **, P < 0.01; ***, P < 0.001; ****, P < 0.0001 compared with untreated WT cells. ##, P < 0.01; ###, P < 0.001 value at 24-h cGAMP treatment compared with corresponding 0-h cGAMP treatment. Data were compared using two-sided t tests. Error bars represent ±SD. Source data associated with this figure can be found at https://doi.org/10.5281/zenodo.6416363. Source data are available for this figure: SourceData F6.
Figure S5.
Figure S5.
Vps13c−/− mice do not display motor deficits or STING activation. (A) First run time (in seconds) and total number of completed runs in 60 s in the balance beam assay for Vps13c−/− and Vps13c−/+ mice at 6 mo old. n = 5. (B) Average time until fall over four runs in the Rotarod assay for Vps13c−/− and Vps13c−/+ mice at 18 mo old. n = 4. (C) Average weight of the mice used for the Rotarod assay in B. (D) qPCR of three ISG transcripts (Irf7, Zbp1, and Usp18) shows no significant difference between Vps13c−/− and WT brain lysates from 1-yr-old mice. n = 5 biological replicates. (E) IB showing no significant difference in levels of phosphorylated STING and TBK1 between Vps13c−/− and WT mouse brain lysates from 1-yr-old animals. n = 3 biological replicates. (F) IB showing no significant difference in levels of phosphorylated STING, TBK1, and IRF3 between Vps13cKO and WT BMDMs under basal conditions and after treatment with 10 μM cGAMP for 24 h. n = 3 biological replicates. (G) IB showing no significant difference in levels of phosphorylated STING, TBK1, and IRF3 between Vps13c−/− and WT fibroblasts. **, P < 0.01. Data was compared using a two-sided t test. Error bars represent ±SD. Source data associated with this figure can be found at https://doi.org/10.5281/zenodo.6416363. Source data are available for this figure: SourceData FS5.

References

    1. Abeliovich, A., and Gitler A.D.. 2016. Defects in trafficking bridge Parkinson’s disease pathology and genetics. Nature. 539:207–216. 10.1038/nature20414 - DOI - PubMed
    1. Alcalay, R.N., Hsieh F., Tengstrand E., Padmanabhan S., Baptista M., Kehoe C., Narayan S., Boehme A.K., and Merchant K.. 2020. Higher urine bis(Monoacylglycerol)Phosphate levels in LRRK2 G2019S mutation carriers: Implications for therapeutic development. Mov. Disord. 35:134–141. 10.1002/mds.27818 - DOI - PMC - PubMed
    1. Amick, J., Roczniak-Ferguson A., and Ferguson S.M.. 2016. C9orf72 binds SMCR8, localizes to lysosomes, and regulates mTORC1 signaling. Mol. Biol. Cell. 27:3040–3051. 10.1091/mbc.E16-01-0003 - DOI - PMC - PubMed
    1. Bonet-Ponce, L., Beilina A., Williamson C.D., Lindberg E., Kluss J.H., Saez-Atienzar S., Landeck N., Kumaran R., Mamais A., Bleck C.K.E., et al. . 2020. LRRK2 mediates tubulation and vesicle sorting from lysosomes. Sci. Adv. 6:eabb2454. 10.1126/sciadv.abb2454 - DOI - PMC - PubMed
    1. Brickner, J.H., and Fuller R.S.. 1997. SOI1 encodes a novel, conserved protein that promotes TGN-endosomal cycling of Kex2p and other membrane proteins by modulating the function of two TGN localization signals. J. Cell Biol. 139:23–36. 10.1083/jcb.139.1.23 - DOI - PMC - PubMed