. 2022 Jul 1;323(1):H130-H145.
doi: 10.1152/ajpheart.00514.2021. Epub 2022 Jun 3.

Development and characterization of a mass cytometry panel for detecting the effect of acute doxorubicin exposure on murine cardiac nonmyocytes

Affiliations

Development and characterization of a mass cytometry panel for detecting the effect of acute doxorubicin exposure on murine cardiac nonmyocytes

Brian S Iskra et al. Am J Physiol Heart Circ Physiol. .

Abstract

Childhood cancer survivors (CCSs) face lifelong side effects related to their treatment with chemotherapy. Anthracycline agents, such as doxorubicin (DOX), are important in the treatment of childhood cancers but are associated with cardiotoxicity. Cardiac toxicities represent a significant source of chronic disability that cancer survivors face; despite this, the chronic cardiotoxicity phenotype and how it relates to acute toxicity remains poorly defined. To address this critical knowledge gap, we studied the acute effect of DOX on murine cardiac nonmyocytes in vivo. Determination of the acute cellular effects of DOX on nonmyocytes, a cell pool with finite replicative capacity, provides a basis for understanding the pathogenesis of the chronic heart disease that CCSs face. To investigate the acute cellular effects of DOX, we present single-cell RNA sequencing (scRNAseq) data from homeostatic cardiac nonmyocytes and compare it with preexisting datasets, as well as a novel CyTOF datasets. SCANPY, a python-based single-cell analysis, was used to assess the heterogeneity of cells detected in scRNAseq and CyTOF. To further assist in CyTOF data annotation, joint analyses of scRNAseq and CyTOF data using an artificial neural network known as sparse autoencoder for clustering, imputation, and embedding (SAUCIE) are performed. Lastly, the panel is tested on a mouse model of acute DOX exposure at two time points (24 and 72 h) after the last dose of doxorubicin and examined with joint clustering. In sum, we report the first ever CyTOF study of cardiac nonmyocytes and characterize the effect of acute DOX exposure with scRNAseq and CyTOF.NEW & NOTEWORTHY We describe the first mass cytometry studies of murine cardiac nonmyocytes. The mass cytometry panel is compared with single-cell RNA sequencing data. Homeostatic cardiac nonmyocytes are characterized by mass cytometry to identify and quantify four major cell populations: endothelial cells, fibroblasts, leukocytes, and pericytes. The single-cell acute nonmyocyte response to doxorubicin is studied at 24 and 72 h after doxorubicin exposure given daily for 5 days at a dose of 4 mg/kg/day.

Keywords: anthracyclines; cardiotoxicity; nonmyocytes; single cell.


Conflict of interest statement

No conflicts of interest, financial or otherwise, are declared by the authors.

Figures

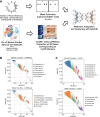
Figure 1.
Figure 1.
A: schematic explaining the experiment, as well as data analysis pipeline for scRNAseq data described. B: clustering of the dataset plotted on the UMAP embedding space with Louvain clustering with annotated “major clusters.” These were determined based on expression of the studied genes described in Table 1. C: single-cell expression displayed in dot plot format. The size of the dot corresponds to the percentage of the total number of cells detected in that cluster. Single-cell expression data are displayed as standard-scaled expression to better appreciate relative differences in the observed transcripts between groups. A total of two mice (n = 2) were used for this experiment. scRNAseq, single-cell RNA sequencing.
Figure 2.
Figure 2.
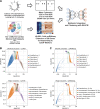
A: schematic explaining the experiment, as well as data analysis pipeline for scRNAseq data described in this figure. All available 10× single-cell transcriptomics v2 chemistry datasets of murine nonmyocytes were assessed in this analysis. B: datasets were plotted on the UMAP embedding space to visualize mixing of samples (see the graph labeled “samples”), as well as the “major cluster” annotation. Annotation of the clusters was based on analysis of gene expression profile, as well as consideration for the sample of origin. Clustering of the dataset with Louvain clustering with annotated “major clusters.” C: single-cell expression displayed in dot plot format. The size of the dot corresponds to the percentage of the total number of cells detected in that cluster. Single-cell expression data are displayed as standard-scaled expression to better appreciate relative differences in the observed transcripts between groups. Comparison of percent cell composition within each identified group may be found in Table 2. A total of 8 datasets were used for this comparison (n = 8). scRNAseq, single-cell RNA sequencing.
Figure 3.
Figure 3.
A: schematic explaining the experiment, as well as data analysis pipeline for CyTOF data described in this figure. Raw CyTOF data were transformed into hyperbolic arcsine-transformed ion counts during postprocessing. Approximately 24 h before euthanasia, mice were given IdU via intraperitoneal injection. Otherwise, no other intervention was performed on the mice. B: clustering of the CyTOF dataset plotted on the UMAP embedding space with Louvain clustering with annotated “major clusters.” C: single-cell expression displayed in dot plot format. The size of the dot corresponds to the percentage of the total number of cells detected in that cluster. Single-cell expression data are displayed as standard-scaled expression to better appreciate relative differences in the observed transcripts between groups. Comparison of percent cell composition within each identified group may be found in Table 3. A total of 6 mice were assessed (n = 6). CyTOF, mass cytometry; IdU, 5-Iodo-2′-deoxyuridine.
Figure 4.
Figure 4.
A: schematic explaining the experiment, as well as data analysis pipeline for joint analysis of scRNAseq and CyTOF data described. All available 10× Genomics Single Cell Transcriptomics v2 Chemistry datasets of murine nonmyocytes (as described in Fig. 2) and the homeostatic CyTOF data presented in Fig. 3 were assessed in this analysis. For the purpose of the SAUCIE model, CyTOF-detected signal was considered to be equivalent to gene expression data according to Table 1. B: scRNAseq datasets were plotted on the SAUCIE embedding space to visualize mixing of the SAUCIE clusters with the “major clusters” annotation. Annotation of the clusters was based on analysis of gene expression profiles associated with each “metacluster” or transcriptome-proteome cluster. A breakdown of percent cellular composition by SAUCIE cluster for each scRNAseq dataset described is provided in Table 4. C: CyTOF datasets were plotted on the SAUCIE embedding space to visualize mixing of the SAUCIE clusters with the “major clusters” annotation. A breakdown of percent cellular composition by SAUCIE cluster for each CyTOF sample, as well as statistical testing between each cohort in the CyTOF dataset, is provided in Table 5. A total of 6 mice were assessed (n = 6). CyTOF, mass cytometry; SAUCIE, sparse autoencoder for unsupervised clustering, imputation, and embedding; scRNAseq, single-cell RNA sequencing.
Figure 5.
Figure 5.
Single-cell expression displayed in dot plot format for the SAUCIE clusters described in Fig. 4. The size of the dot corresponds to the percentage of the total number of cells detected in that cluster. Single-cell expression data are displayed as standard-scaled expression to better appreciate relative differences in the observed transcripts between groups. The examined transcript-protein relationships were chosen based on Table 1. A: single-cell expression profiles of SAUCIE clusters with scRNAseq data. B: single-cell expression profiles of SAUCIE clusters with CyTOF data. A total of 6 mice were assessed (n = 6). CyTOF, mass cytometry; SAUCIE, sparse autoencoder for unsupervised clustering, imputation, and embedding; scRNAseq, single-cell RNA sequencing.
Figure 6.
Figure 6.
A: schematic explaining the experiment, as well as data analysis pipeline for CyTOF data described. The acute injury model described here was given a dose of DOX intraperitoneally daily for 5 days. Approximately 24 h before euthanasia, the animal was given IdU intraperitoneally. If this coincided with the last day of exposure, the mouse was given IdU with DOX. B: clustering of the CyTOF dataset plotted on the UMAP embedding space with Louvain clustering with annotated “major clusters.” C: single-cell expression displayed in dot plot format. The size of the dot corresponds to the percentage of the total number of cells detected in that cluster. Single-cell expression data are displayed as standard-scaled expression to better appreciate relative differences in the observed transcripts between groups. Comparison of percent cell composition within each identified group may be found in Table 6. A total of 8 mice were assessed (n = 8). CyTOF, mass cytometry; DOX, doxorubicin; IdU, 5-Iodo-2′-deoxyuridine.
Figure 7.
Figure 7.
A: schematic explaining the experiment, as well as data analysis pipeline for joint analysis of scRNAseq and CyTOF data described. All available 10× Genomics Single Cell Transcriptomics v2 Chemistry datasets of murine nonmyocytes (as described in Fig. 2) and the homeostatic CyTOF data presented in Fig. 3 were assessed in this analysis. For the purpose of the SAUCIE model, CyTOF-detected signal was considered to be equivalent to gene expression data according to Table 1. B: CyTOF datasets were plotted on the SAUCIE embedding space to visualize mixing of the SAUCIE clusters with the “major clusters” annotation. Annotation of the clusters was based on analysis of gene expression profiles associated with each “metacluster” or transcriptome-proteome cluster. A breakdown of percent cellular composition by SAUCIE cluster for each CyTOF dataset described is provided in Tables 6 and 7. C: scRNAseq datasets were plotted on the SAUCIE embedding space to visualize mixing of the SAUCIE clusters with the “major clusters” annotation. A total of 8 mice were assessed (n = 8), excluding the scRNAseq datasets. CyTOF, mass cytometry; SAUCIE, sparse autoencoder for unsupervised clustering, imputation, and embedding; scRNAseq, single-cell RNA sequencing.

Similar articles

References

    1. Miller KD, Nogueira L, Mariotto AB, Rowland JH, Yabroff KR, Alfano CM, Jemal A, Kramer JL, Siegel RL. Cancer treatment and survivorship statistics, 2019. CA Cancer J Clin 69: 363–385, 2019. doi:10.3322/caac.21565. - DOI - PubMed
    1. Armenian SH, Armstrong GT, Aune G, Chow EJ, Ehrhardt MJ, Ky B, Moslehi J, Mulrooney DA, Nathan PC, Ryan TD, van der Pal HJ, van Dalen EC, Kremer LCM. Cardiovascular disease in survivors of childhood cancer: insights into epidemiology, pathophysiology, and prevention. J Clin Oncol 36: 2135–2144, 2018. doi:10.1200/jco.2017.76.3920. - DOI - PMC - PubMed
    1. Bhakta N, Liu Q, Ness KK, Baassiri M, Eissa H, Yeo F, Chemaitilly W, Ehrhardt MJ, Bass J, Bishop MW, Shelton K, Lu L, Huang S, Li Z, Caron E, Lanctot J, Howell C, Folse T, Joshi V, Green DM, Mulrooney DA, Armstrong GT, Krull KR, Brinkman TM, Khan RB, Srivastava DK, Hudson MM, Yasui Y, Robison LL. The cumulative burden of surviving childhood cancer: an initial report from the St Jude Lifetime Cohort Study (SJLIFE). Lancet 390: 2569–2582, 2017. doi:10.1016/s0140-6736(17)31610-0. - DOI - PMC - PubMed
    1. Lindsey ML, Lange RA, Parsons H, Andrews T, Aune GJ. The tell-tale heart: molecular and cellular responses to childhood anthracycline exposure. Am J Physiol Heart Circ Physiol 307: H1379–H1389, 2014. doi:10.1152/ajpheart.00099.2014. - DOI - PMC - PubMed
    1. Mancilla TR, Iskra B, Aune GJ. Doxorubicin-induced cardiomyopathy in children. Compr Physiol 9: 905–931, 2019. doi:10.1002/cphy.c180017. - DOI - PMC - PubMed

Publication types

LinkOut - more resources