

Analysis of Urine Drug Test Results From Substance Use Disorder Treatment Practices and Overdose Mortality Rates, 2013-2020
- PMID: 35657623
- PMCID: PMC9166618
- DOI: 10.1001/jamanetworkopen.2022.15425
Analysis of Urine Drug Test Results From Substance Use Disorder Treatment Practices and Overdose Mortality Rates, 2013-2020
Abstract
Importance: Drug overdose deaths in the US are currently the highest ever recorded; data collected from public health surveillance sources can help to identify emerging drug use patterns associated with overdose mortality rates, but the time lag in results often limits utility. Urine drug testing (UDT) is one potentially underused source that could augment surveillance efforts through timely data collection.
Objective: To evaluate the correlation between real-time UDT results from a proprietary national database and overdose mortality data from the National Vital Statistics System.
Design, setting, and participants: This retrospective cross-sectional study included 500 000 urine specimens submitted for UDT by substance use disorder (SUD) treatment health care practices and collected between January 1, 2013, and December 31, 2020. Real-time UDT data were obtained from the Millennium Health proprietary national database, and overdose mortality data were obtained from the National Vital Statistics System of the Centers for Disease Control and Prevention (CDC WONDER). Specimens were analyzed for specific drugs in 5 categories (cocaine, heroin, methamphetamine, synthetic opioids, and other opioids) using liquid chromatography-tandem mass spectrometry. Participants were adults aged 18 years and older who provided urine specimens at SUD treatment practices.
Exposures: Urine drug testing.
Main outcomes and measures: The primary outcome was the correlation between UDT positivity rates and overdose mortality rates at national, state, and county levels. Univariate and multivariate regression models were also used to evaluate the association between state- and county-level overdose mortality and standardized UDT positivity rates.
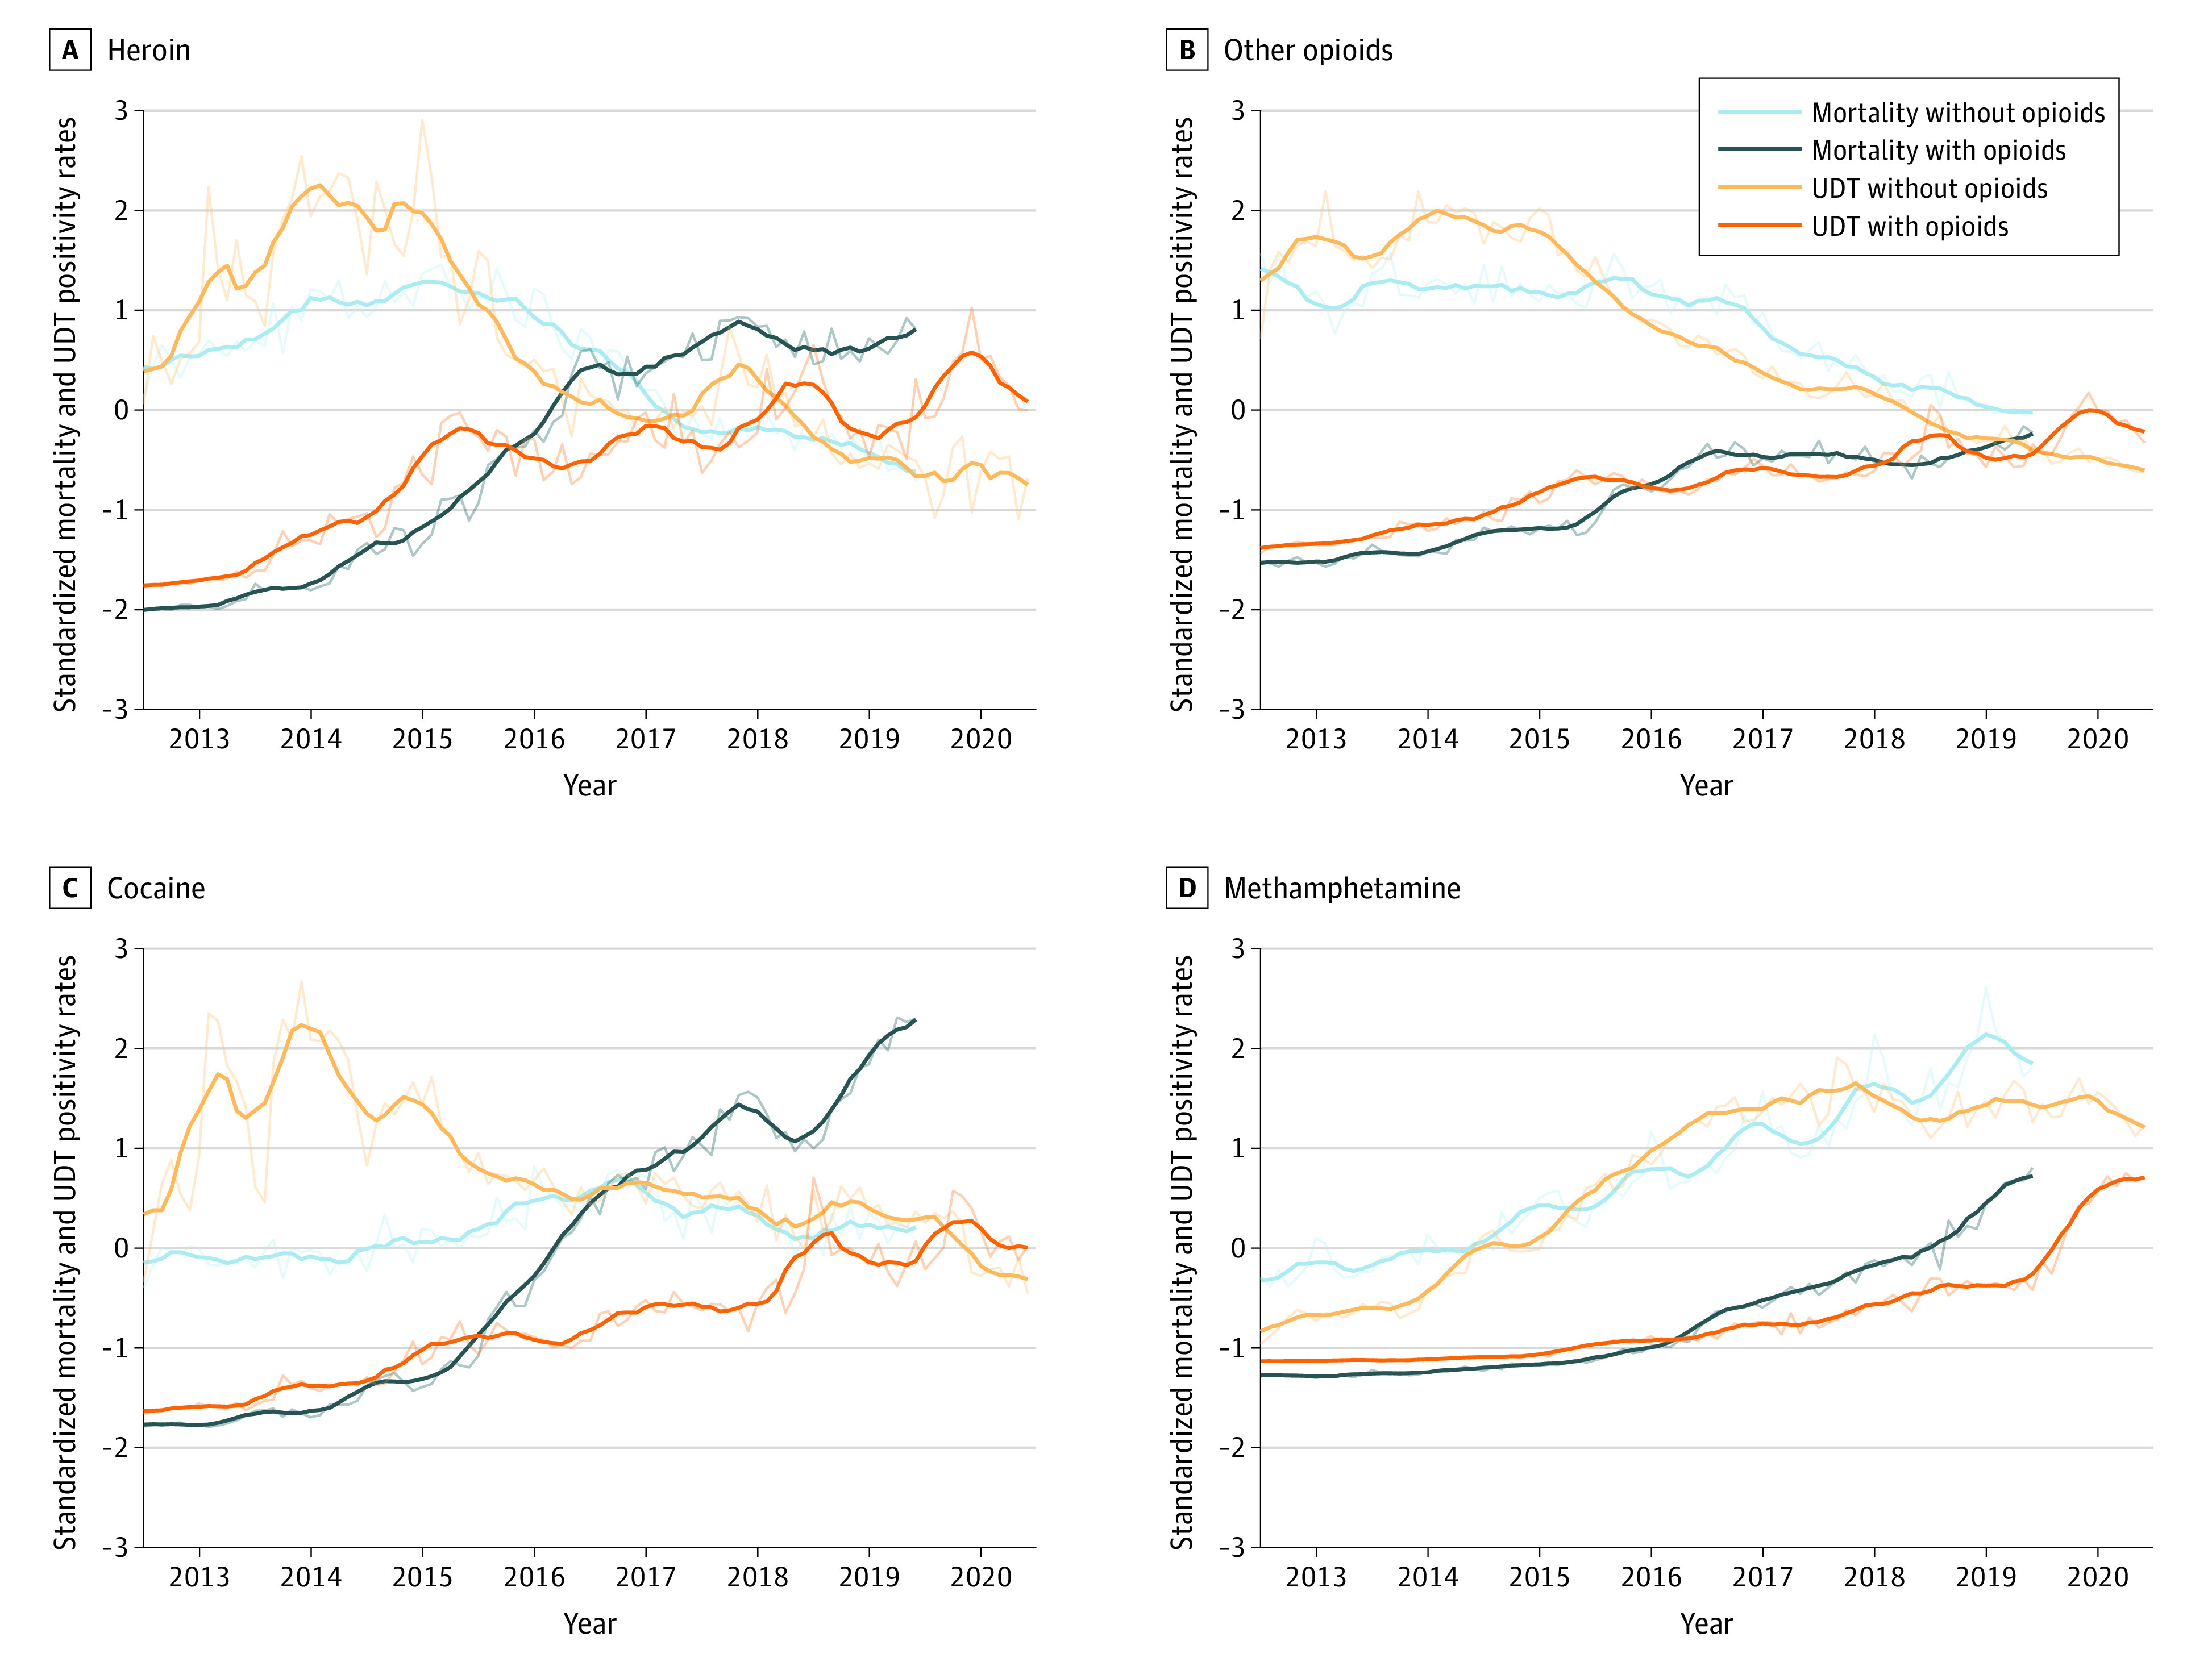
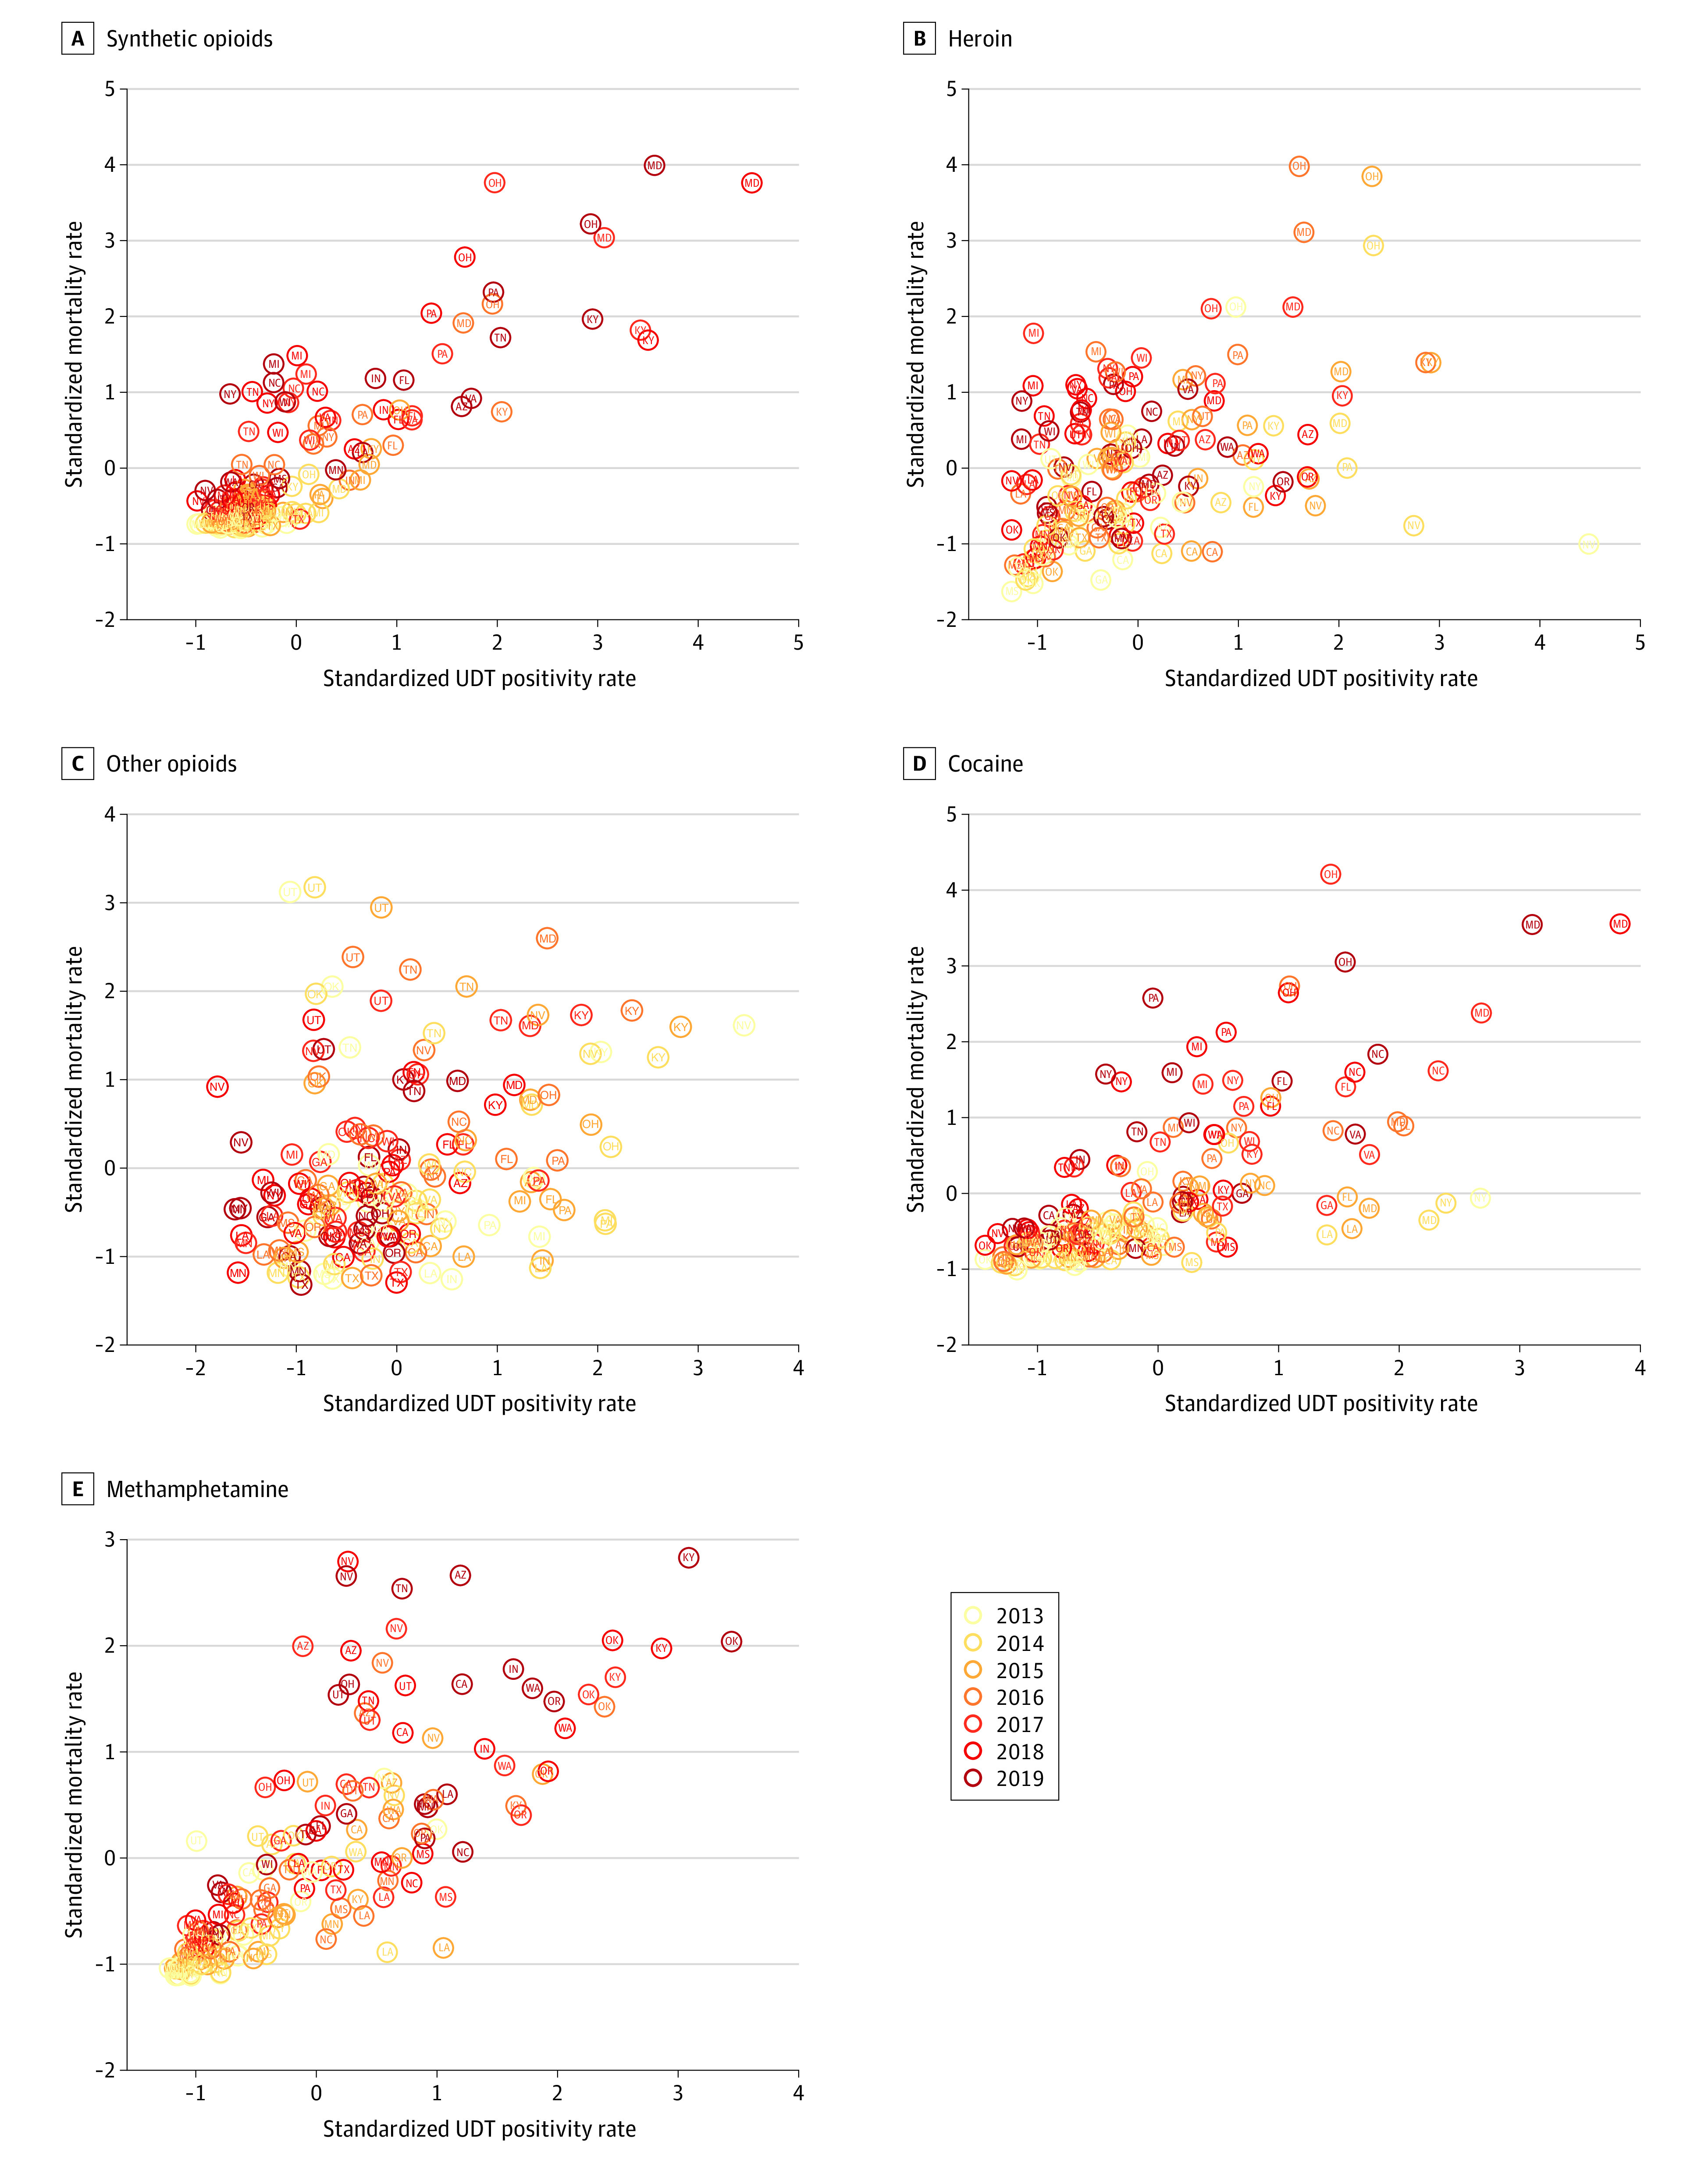
Results: Among 500 000 unique patient specimens collected from SUD treatment practices between 2013 and 2020, 288 534 specimens (57.7%) were from men, and the median age of the study population was 34 years (IQR, 17-51 years). On a national level, synthetic opioids and methamphetamine were highly correlated with overdose mortality (Spearman ρ = 0.96 for both). When synthetic opioids were coinvolved, methamphetamine (ρ = 0.98), heroin (ρ = 0.78), cocaine (ρ = 0.94), and other opioids (ρ = 0.83) were also highly correlated with overdose mortality. In the absence of synthetic opioids, all drug categories were highly correlated (ρ = 0.75 for other opioids, 0.81 for heroin, and 0.88 for methamphetamine), with the exception of cocaine (ρ = -0.37). Synthetic opioids (ρ = 0.77) and methamphetamine (ρ = 0.80) had the strongest state-level correlations over time, whereas other opioids had the lowest correlation for both total positivity (ρ = 0.31) and positivity in the absence of synthetic opioids (ρ = 0.23). In Ohio, county-level correlation was strongest for synthetic opioids (ρ = 0.71), followed by heroin (ρ = 0.69) and methamphetamine (ρ = 0.67). At the state level, the multivariate incidence rate ratio (IRR) for synthetic opioids was 1.16 (95% CI, 1.14-1.19; P < .001), and at the county level, the IRR was 1.13 (95% CI, 1.09-1.17; P < .001), suggesting that for every 1-SD increase in the UDT positivity rate, there were 16.2% and 12.8% increases, respectively, in monthly overdose deaths. Both methamphetamine (11.7% increase per 1-SD increase in UDT positivity rate; IRR, 1.12; 95% CI, 1.09-1.14; P < .001) and cocaine (5.1% increase per 1-SD increase in UDT positivity rate; IRR, 1.05; 95% CI, 1.03-1.07; P < .001) also had significant positive associations with mortality rates, but the effect sizes were smaller than that of synthetic opioids (IRR, 1.16).
Conclusions and relevance: In this study, UDT results were highly correlated with mortality rates at national, state, and county levels. These findings suggest that real-time UDT surveillance can help to quickly identify changes in drug use patterns that might inform targeted harm reduction strategies designed to prevent overdose deaths.
Conflict of interest statement
Figures
Comment in
-
The Opioid Crisis-Not Just Opioids Anymore.JAMA Netw Open. 2022 Jun 1;5(6):e2215432. doi: 10.1001/jamanetworkopen.2022.15432. JAMA Netw Open. 2022. PMID: 35657631 No abstract available.
References
-
- NIH HEAL Initiative . HEALing Communities Study. US Department of Health and Human Services; 2021. Accessed September 14, 2021. https://healingcommunitiesstudy.org/
-
- Federal Office of Rural Health Policy. Rural Communities Opioid Response Program (RCORP). Health Resources & Services Administration; 2021. Accessed September 14, 2021. https://www.hrsa.gov/rural-health/rcorp
-
- Coady JA. Preventing overdose and death. Substance Abuse and Mental Health Services Administration. August 31, 2021. Accessed September 14, 2021. https://www.samhsa.gov/blog/preventing-overdose-death
-
- Ahmad FB, Rossen LM, Sutton P. Provisional drug overdose death counts. National Center for Health Statistics; 2021. Accessed September 13, 2021. https://www.cdc.gov/nchs/nvss/vsrr/drug-overdose-data.htm
Publication types
MeSH terms
Substances
Grants and funding
LinkOut - more resources
Full Text Sources
Medical
