. 2022 Jun 3;17(6):e0268644.
doi: 10.1371/journal.pone.0268644. eCollection 2022.

Calcium imaging in intact mouse acinar cells in acute pancreas tissue slices

Affiliations

Calcium imaging in intact mouse acinar cells in acute pancreas tissue slices

Urška Marolt et al. PLoS One. .

Abstract

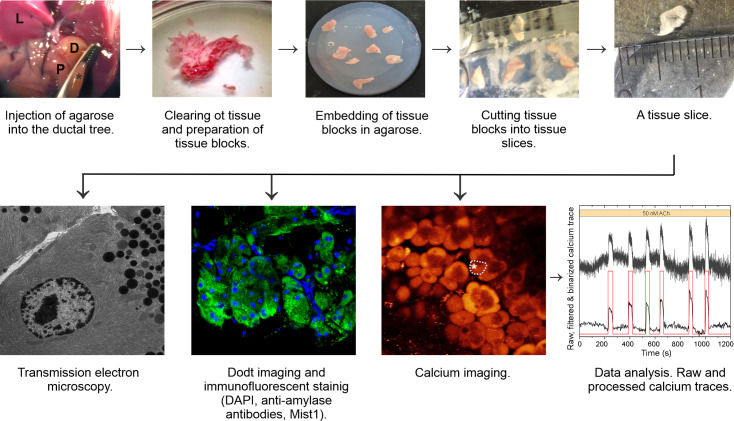
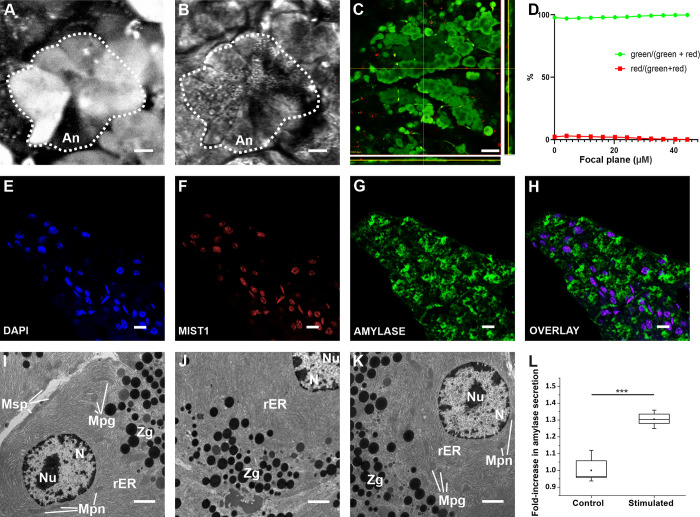
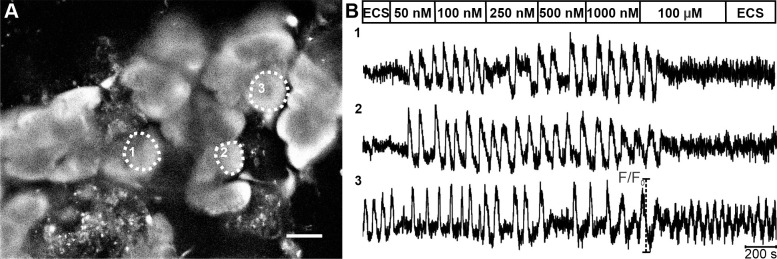
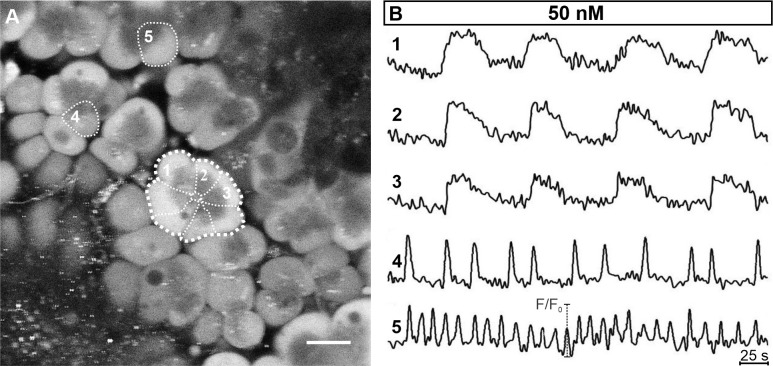
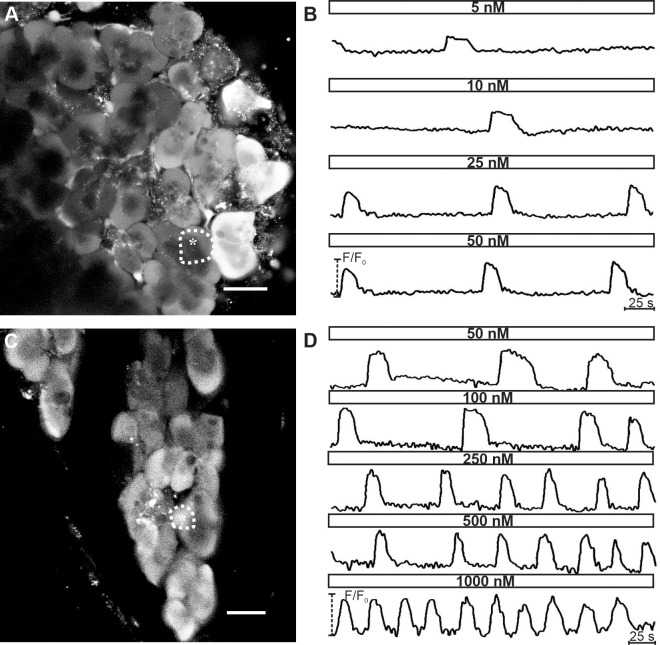
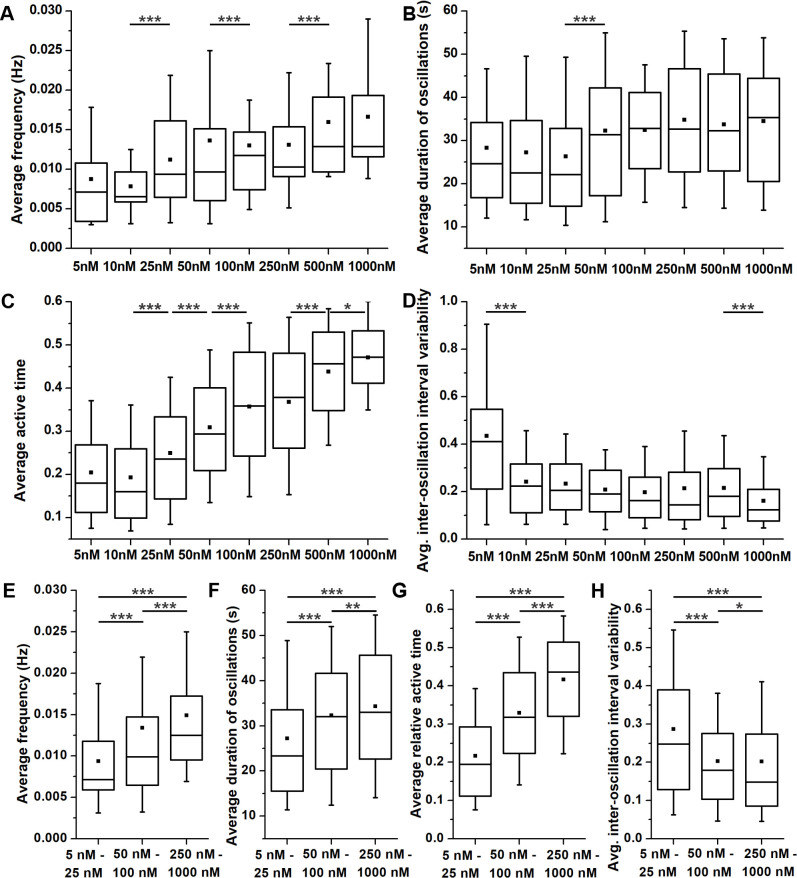
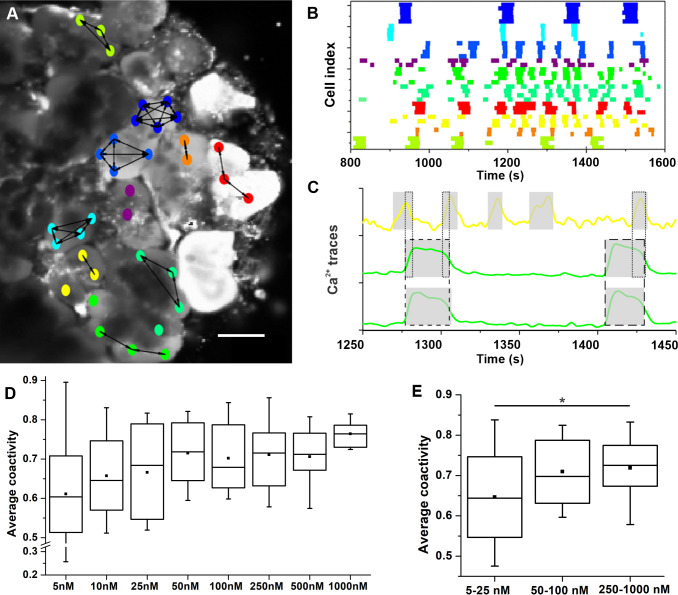
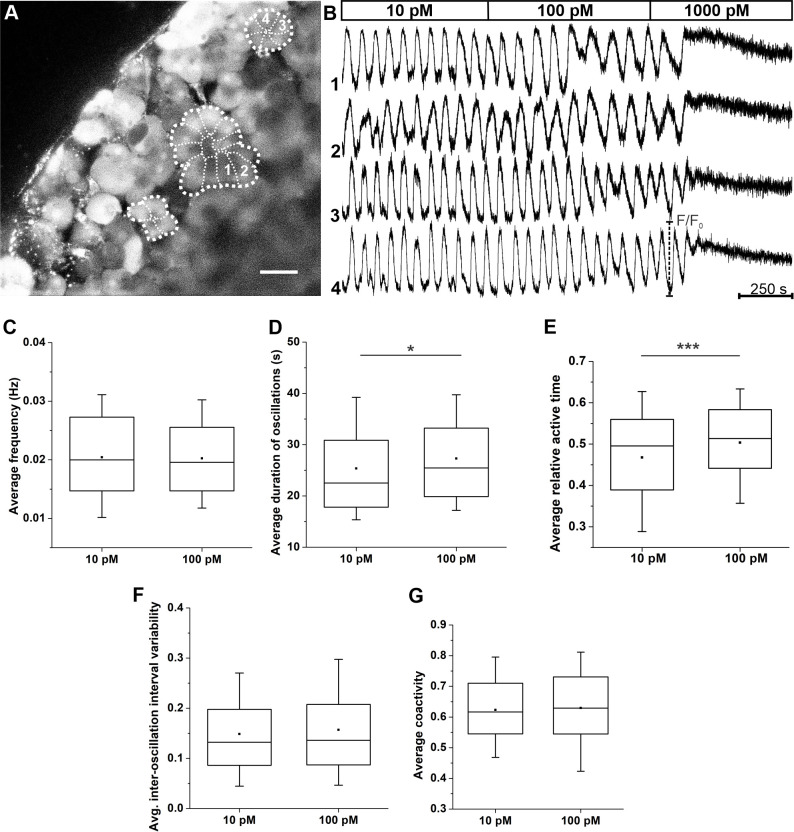
The physiology and pathophysiology of the exocrine pancreas are in close connection to changes in intra-cellular Ca2+ concentration. Most of our knowledge is based on in vitro experiments on acinar cells or acini enzymatically isolated from their surroundings, which can alter their structure, physiology, and limit our understanding. Due to these limitations, the acute pancreas tissue slice technique was introduced almost two decades ago as a complementary approach to assess the morphology and physiology of both the endocrine and exocrine pancreas in a more conserved in situ setting. In this study, we extend previous work to functional multicellular calcium imaging on acinar cells in tissue slices. The viability and morphological characteristics of acinar cells within the tissue slice were assessed using the LIVE/DEAD assay, transmission electron microscopy, and immunofluorescence imaging. The main aim of our study was to characterize the responses of acinar cells to stimulation with acetylcholine and compare them with responses to cerulein in pancreatic tissue slices, with special emphasis on inter-cellular and inter-acinar heterogeneity and coupling. To this end, calcium imaging was performed employing confocal microscopy during stimulation with a wide range of acetylcholine concentrations and selected concentrations of cerulein. We show that various calcium oscillation parameters depend monotonically on the stimulus concentration and that the activity is rather well synchronized within acini, but not between acini. The acute pancreas tissue slice represents a viable and reliable experimental approach for the evaluation of both intra- and inter-cellular signaling characteristics of acinar cell calcium dynamics. It can be utilized to assess many cells simultaneously with a high spatiotemporal resolution, thus providing an efficient and high-yield platform for future studies of normal acinar cell biology, pathophysiology, and screening pharmacological substances.


Conflict of interest statement

The authors have declared that no competing interests exist.

Figures

Fig 1
Fig 1. Flowchart for studying calcium responses in acinar cells in mouse pancreas tissue slices, from the injection of agarose into the ductal tree of the mouse pancreas and preparation of tissue slices to structural and functional imaging with data analysis.
L, liver; P, pancreas; D, duodenum; asterisks, clamped major duodenal papilla.
Fig 2
Fig 2. Morphology of acinar cells in mouse pancreas tissue slices.
(A, B) High resolution confocal fluorescence images of the exocrine part of the pancreas, labeled with OGB-1 (A) and imaged with Dodt contrast (B). An; acinus is encircled by the broken line. Scale bar 10 μm. (C) A layer from a z-stack, cells were loaded with the Live/Dead dye. Side panels represent orthogonal projections of the z-stack, positioned as indicated by yellow lines. Pseudo color-coded, such that green indicates live cells and red indicates dead cells. Scale bar 50 μm. (D) The percentage of live cells in green and dead cells in red, as a function of depth of the focal plane within the slice. (E, F, G, H) Staining of nuclei with DAPI (E) and anti-Mist1 antibodies (F), and of cytoplasm with anti-amylase antibodies (G), with the overlay (H). Scale bar 10 μm. (I-K) TEM images of acinar cells from a tissue slice. Mpn, perinuclear mitochondria; Mpg, perigranular mitochondria; Msp, subplasmalemmal mitochondria; Zg, zymogen granules; N, nucleus; Nu, nucleolus; rER, rough endoplasmic reticulum. Scale bar 10 μm. (L) Quantification of amylase secretion upon stimulation by 0.1 nM cerulein, n = 6. Significant difference is indicted by asterisks (***, p<0.001).
Fig 3
Fig 3. [Ca2+]i oscillations in acinar cells upon stimulation with a ramp of ACh concentrations.
(A) OGB-1 loaded acinar cells in a tissue slice. Scale bar 20 μm. (B) [Ca2+]i oscillations shown here belong to the acinus marked with thin broken line and the corresponding number in (A). At the beginning and end of the protocol, extracellular solution (ECS) was used (see Materials and Methods). On average, after stimulation with 100 μm ACh, a biphasic [Ca2+]i response with a rise in basal [Ca2+]i level was seen in 98.5% of acinar cells. Note that in cell 3, spontaneous [Ca2+]i activity was observed prior to stimulation, whereas cells 1&2 lacked spontaneous activity.
Fig 4
Fig 4. [Ca2+]i oscillations within different acini.
(A) OGB-1 loaded acinar cells in a tissue slice. Cells indicated with 1–3 belong to the same acinus (the thicker broken line marks the acinus, the thinner broken lines mark boundaries between individual acinar cells). Scale bar 20 μm. (B) The [Ca2+]i activity patterns in three different acinar cells from the same acinus (1–3) and in two cells from two other distinct acini (cells 4 and 5) stimulated with 50 nM ACh. Please note that [Ca2+]i oscillations were similar in shape and synchronized between cells in the same acinus but not between cells from different acini (1–3 vs. 4 vs. 5).
Fig 5
Fig 5. [Ca2+]i oscillations in acinar cells stimulated with ACh display concentration-dependence.
(A) and (C) OGB-1 loaded acinar cells in a tissue slice. Scale bar in Fig 5A 10 μm and in Fig 5C 20 μm. (B) [Ca2+]i oscillations in an acinar cell in response to ACh concentrations ranging from 5 to 50 nM. The corresponding acinar cell is marked with thin broken line and asterisk in (A). (D) [Ca2+]i oscillations cell in an acinar cell in response to ACh concentrations ranging from 50 to 1000 nM. The corresponding acinar cell is marked with thin broken line and asterisk in (C).
Fig 6
Fig 6. The dose-dependence of [Ca2+]i oscillations in acinar cells upon stimulation with different concentrations of ACh.
(A) and (E) Average frequency of oscillations. (B) and (F) Average duration of oscillations. (C) and (G) Average relative active time of oscillations. (D) and (H) Average inter-oscillation interval variability. Boxes determinate the interval within the 25th and the 75th percentile, whiskers denote the minimal and the maximal values, lines within the boxes indicate the median, and small squares stand for the average value. Significant differences are indicted by asterisks (*, p<0.05; **, p<0.01; ***, p<0.001). Panels E-H present pooled data for low (5–25 nM), medium (50–100 nM), and high (250–1000 nM) ACh concentrations. Number of analyzed slices/cells: 12/177 at 5 nM; 11/195 at 10 nM; 12/212 at 25 nM; 24/506 at 50 nM; 14/362 at 100 nM; 13/358 at 250 nM; 11/310 at 500 nM and 6/191cells at 1000 nM.
Fig 7
Fig 7. Inter-cellular synchronization of acinar cells.
(A) Functional network of acinar cells extracted from coactivity and overlayed over a corresponding confocal image. Nodes denote individual acinar cells, colors code individual acini (matching the colors in panel B), and connections represent functional associations between synchronized cells, i.e., connections were established if the coactivity coefficient exceeded 0.65). Scale bar 10 μm. (B) Raster plot of binarized activity of all acinar cells in the field of view of a tissue slice during stimulation with 50 nM ACh. White color indicates no activity, other colors represent states with elevated [Ca2+]i in particular cells, whereby colors denote individual acini. (C) Visualized coactivity between three different cells, whereby two of them were located in the same acinus (green line) and the third cell belonged to a separate acinus (yellow). The grey shaded areas indicate the duration of [Ca2+]i oscillations of individual cells and the dashed and dotted lines the degree of coactivity (i.e., overlap in activity) between the two cells displayed in green and the middle green and yellow cell, respectively. (D) Dose-dependent average coactivity between acinar cells within individual acini. (E) Pooled data for low (5–25 nM), medium (50–100 nM), and high (250–1000 nM) ACh concentrations. Boxes determinate the interval within the 25th and the 75th percentile, whiskers denote the minimal and the maximal values, lines within the boxes indicate the median and small squares stand for the average value. Significant difference is indicted by asterisk (*, p<0.05).
Fig 8
Fig 8. Activity of acinar cells during stimulation with cerulein.
(A) Acinar cells loaded with the calcium dye. Cells indicated with 1 and 2 belong to a different acinus as cells 3 and 4 (the thicker broken line marks the acinus, the thinner broken lines mark boundaries between individual acinar cells). (B) Acinar cell activity during stimulation with increasing cerulein concentrations. Shown are four traces from two different acini, as indicated in panel A. (C) Average oscillation frequency. (D) Average oscillation duration. (E) Average relative active time. (F) Average inter-oscillation interval variability. (G) Average coactivity (G). Number of analyzed slices/cells 11/606 at 10 pM CCK and 11/571 at 100 pM CCK.

References

    1. Parys JB, Bultynck G. Calcium signaling in health, disease and therapy. Biochim Biophys Acta Mol Cell Res. 2018;1865: 1657–1659. doi: 10.1016/j.bbamcr.2018.08.019 - DOI - PubMed
    1. Roberts SE, Morrison-Rees S, John A, Williams JG, Brown TH, Samuel DG. The incidence and aetiology of acute pancreatitis across Europe. Pancreatol Off J Int Assoc Pancreatol IAP Al. 2017;17: 155–165. doi: 10.1016/j.pan.2017.01.005 - DOI - PubMed
    1. Forouhi NG, Wareham NJ. Epidemiology of diabetes. Med Abingdon Engl UK Ed. 2014;42: 698–702. doi: 10.1016/j.mpmed.2014.09.007 - DOI - PMC - PubMed
    1. Khalaf N, El-Serag HB, Abrams HR, Thrift AP. Burden of Pancreatic Cancer: From Epidemiology to Practice. Clin Gastroenterol Hepatol Off Clin Pract J Am Gastroenterol Assoc. 2020. doi: 10.1016/j.cgh.2020.02.054 - DOI - PMC - PubMed
    1. Leung PS. Common pancreatic disease. Adv Exp Med Biol. 2010;690: 29–51. doi: 10.1007/978-90-481-9060-7_3 - DOI - PMC - PubMed

Publication types