. 2022 Jun 3;7(72):eabn0175.
doi: 10.1126/sciimmunol.abn0175. Epub 2022 Jun 3.

An innate IL-25-ILC2-MDSC axis creates a cancer-permissive microenvironment for Apc mutation-driven intestinal tumorigenesis

Affiliations

An innate IL-25-ILC2-MDSC axis creates a cancer-permissive microenvironment for Apc mutation-driven intestinal tumorigenesis

Eric Jou et al. Sci Immunol. .

Abstract

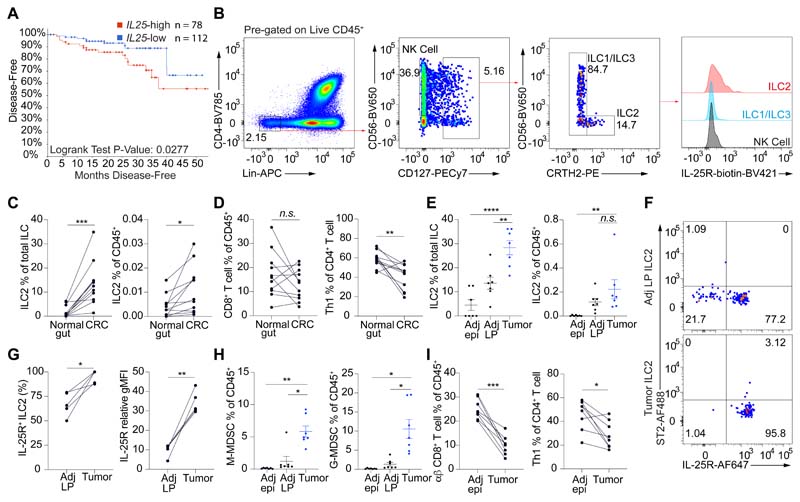
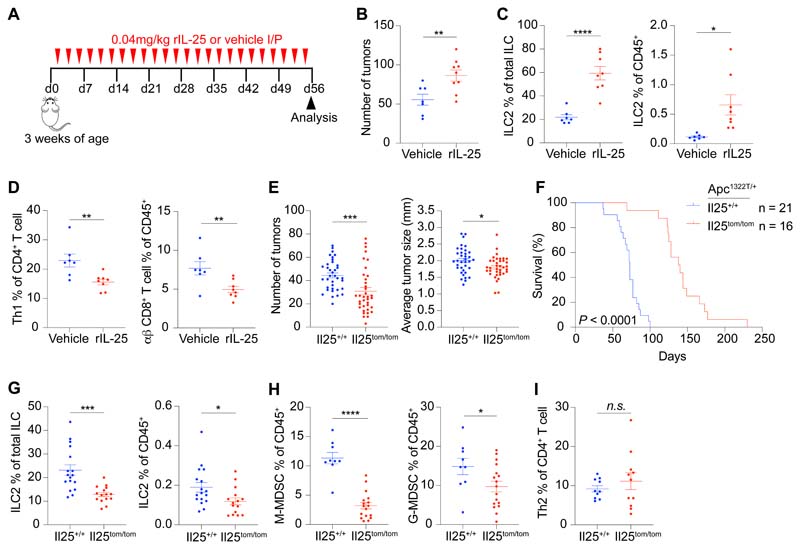
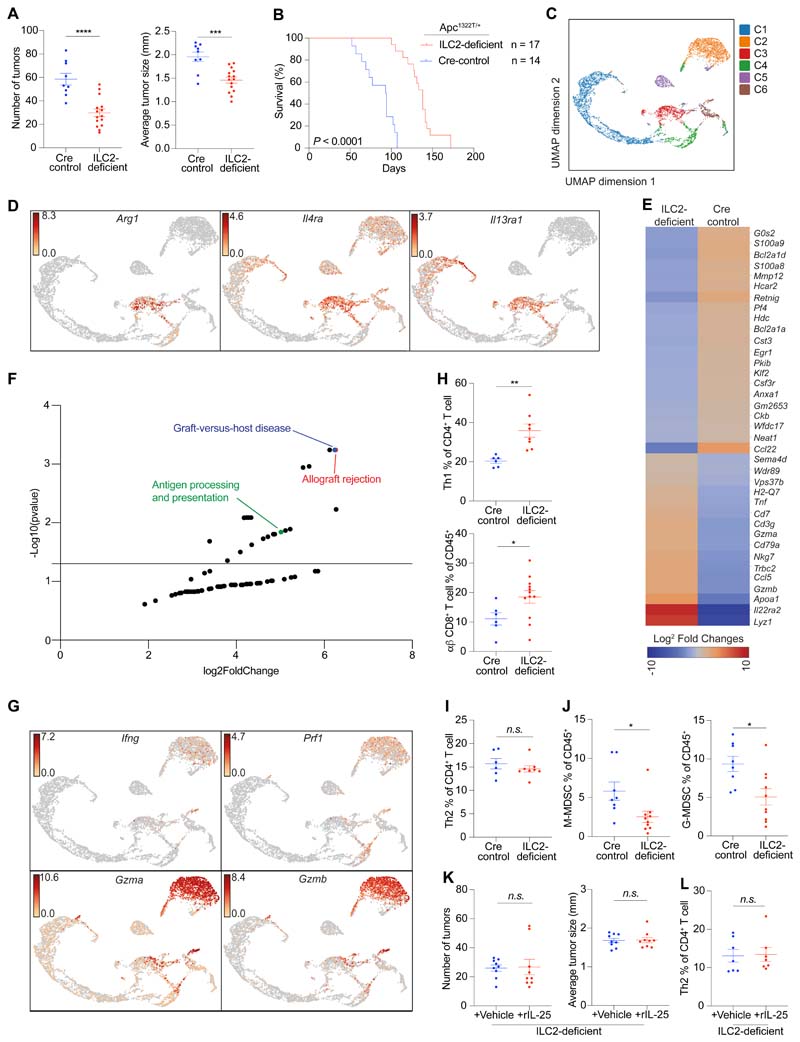
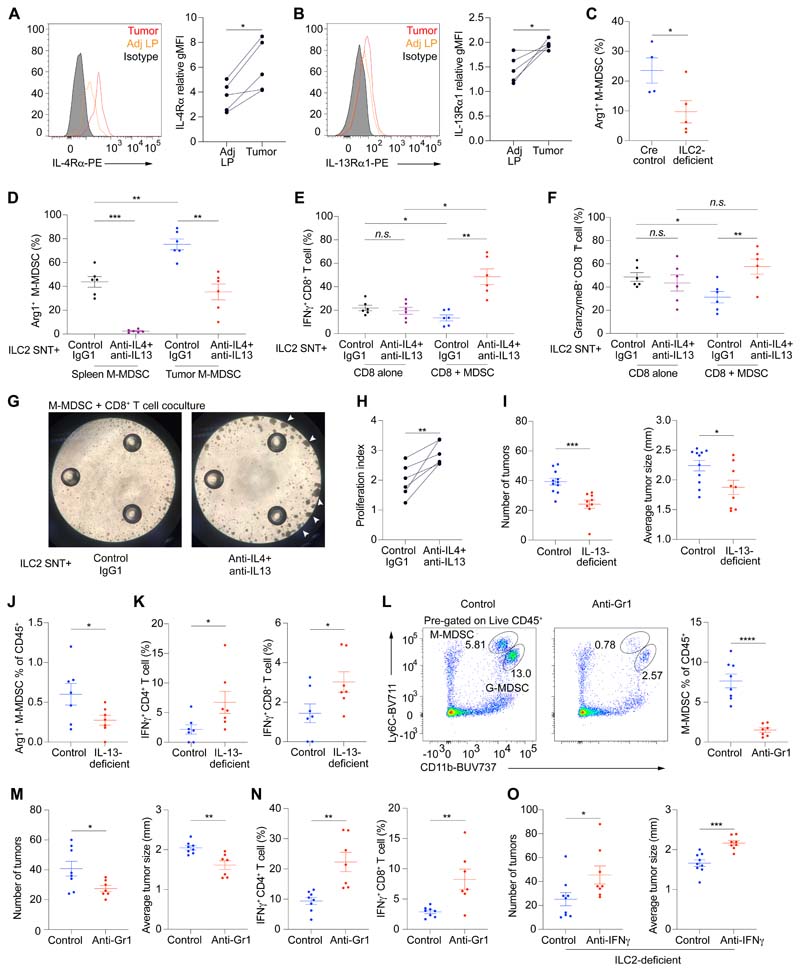
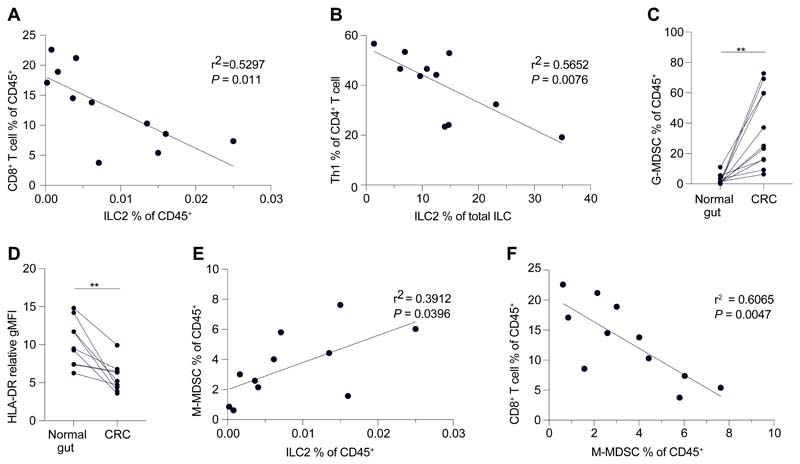
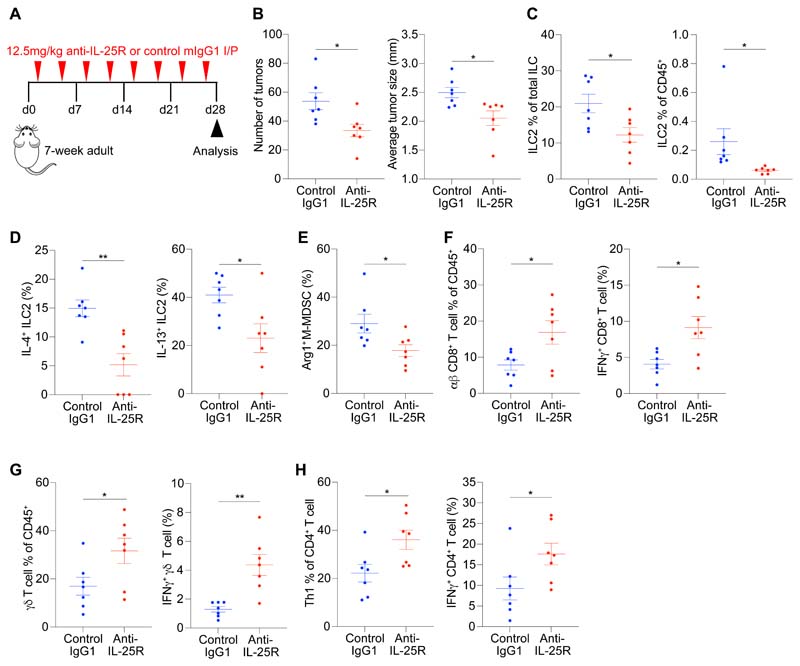
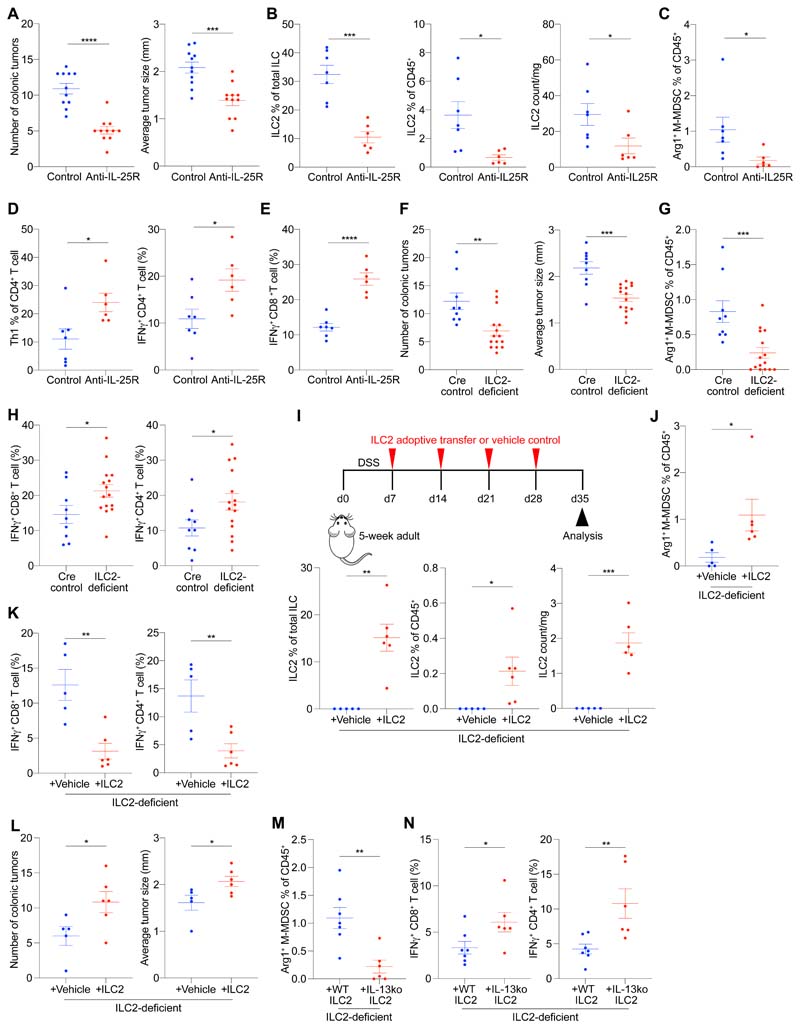
Interleukin-25 (IL-25) and group 2 innate lymphoid cells (ILC2s) defend the host against intestinal helminth infection and are associated with inappropriate allergic reactions. IL-33-activated ILC2s were previously found to augment protective tissue-specific pancreatic cancer immunity. Here, we showed that intestinal IL-25-activated ILC2s created an innate cancer-permissive microenvironment. Colorectal cancer (CRC) patients with higher tumor IL25 expression had reduced survival and increased IL-25R-expressing tumor-resident ILC2s and myeloid-derived suppressor cells (MDSCs) associated with impaired antitumor responses. Ablation of IL-25 signaling reduced tumors, virtually doubling life expectancy in an Apc mutation-driven model of spontaneous intestinal tumorigenesis. Mechanistically, IL-25 promoted intratumoral ILC2s, which sustained tumor-infiltrating MDSCs to suppress antitumor immunity. Therapeutic antibody-mediated blockade of IL-25 signaling decreased intratumoral ILC2s, MDSCs, and adenoma/adenocarcinoma while increasing antitumor adaptive T cell and interferon-γ (IFN-γ)-mediated immunity. Thus, the roles of innate epithelium-derived cytokines IL-25 and IL-33 as well as ILC2s in cancer cannot be generalized. The protumoral nature of the IL-25-ILC2 axis in CRC highlights this pathway as a potential therapeutic target against CRC.


Conflict of interest statement

Competing interests: A.N.J.M. is a Scientific Advisory Board member for SinoMab. A.N.J.M. works for UKRI MRC who licensed anti-IL-25Rmab clone D9.2 to SinoMab. A.N.J.M. receives grant funding from UKRI MRC and the Wellcome Trust. K.S. and D.M. are employed by LifeArc.

Figures

Fig. 1
Fig. 1. IL-25R expressing ILC2s infiltrate tumors in human and Apc1322T/+ mouse model of CRC.
(A) Disease-free survival of CRC patients from the TCGA Firehose Legacy microarray dataset, stratified into two groups by tumor IL25 expression. IL25-high and IL25-low groups are defined as patients with CRC that had tumor IL25 expression above and below the mean of the total samples, respectively. (B) Representative FACS plots showing gating strategy and IL-25R expression on ILCs in human CRC samples. (C and D) Frequency of ILC2s (C), CD8+ and Th1 T cells (D) in paired CRC and adjacent normal tissue from CRC patients (n = 11). (E) Frequency of ILC2s in paired tumors, adjacent normal epithelium (Adj epi) and adjacent lamina propria (Adj LP) in Apc1322T/+ mice (n = 7). (F) Representative FACS plots showing IL-25R and ST2 expression in ILC2s from Apc1322T/+ mouse tumors and Adj LP. (G) Expression of IL-25R on ILC2s from paired tumors and Adj LP from Apc1322T/+ mice (n = 5). Relative gMFI, geometric mean fluorescent intensity relative to isotype control. (H) Frequency of M-MDSCs and G-MDSCs in tumor, Adj epi, and Adj LP from Apc1322T/+ mice (n = 7). (I) Frequency of CD8+ T cells and Th1 cells in paired tumor and Adj epi from Apc1322T/+ mice (n = 8). Data pooled from two or more independent experiments and error bars show mean ± SEM. Statistical significance determined by log-rank test (A), one-way ANOVA with Tukey’s post hoc (E and H), and paired two-tailed t-test (C, D, G and I). n.s. non-signifiacnt, *P < 0.05, **P < 0.01, ***P < 0.001, ****P < 0.0001.
Fig. 2
Fig. 2. IL-25 promotes intestinal tumors and tumor ILC2s.
(A) Schematic of rIL-25 or vehicle treatment in Apc1322T/+ mice, where mice were injected three times per week for eight weeks. (B) Number of tumors in vehicle and rIL-25-treated Apc1322T/+ mice (vehicle, n = 7; rIL-25, n = 9). (C) Tumor ILC2 frequency in vehicle and rIL-25-treated Apc1322T/+ mice (vehicle, n = 7; rIL-25, n = 8). (D) Frequency of tumor infiltrating Th1 and CD8+ T cells in vehicle and rIL-25-treated Apc1322T/+ mice (vehicle, n = 7; rIL-25, n = 8). (E and F) Number of tumors and average tumor size (Il25+/+, n = 36; Il25tom/tom, n = 37) (E) and survival (F) of Il25+/+ and Il25tom/tom Apc1322T/+ mice. (G) Frequency of tumor ILC2s (Il25+/+, n = 17; Il25tom/tom, n = 15) from Il25+/+ and Il25tom/tom Apc1322T/+ mice. (H and I) Frequency of M-MDSCs and G-MDSCs (Il25+/+, n = 9; Il25tom/tom, n = 17) (H), and Th2 cells (Il25+/+, n = 10; Il25tom/tom, n = 11) (I), from Il25+/+ and Il25tom/tom Apc1322T/+ mice. Data pooled from two or more independent experiments and error bars show mean ± SEM. Statistical significance determined by unpaired two-tailed t-test, except in (F) by two-sided log-rank test. n.s. non-signifiacnt, *P < 0.05, **P < 0.01, ***P < 0.001, ****P < 0.0001.
Fig. 3
Fig. 3. Genetic ablation of ILC2s reduces intestinal tumor burden and increases life-expectancy.
(A and B) Number of tumors and average tumor size (Cre control, n = 9; ILC2-deficient, n = 15) (A), and survival (B), of ILC2-deficient (Roraf/fIl7rCre/+) and Cre control (Rora+/+Il7rCre/+ or Rora+/fIl7rCre/+) Apc1322T/+ mice. (C) UMAP plot showing combined single-cell RNAseq (scRNAseq) analysis of tumor epithelial cells (C1; CD45-EpCAM+), M-MDSCs (C3; CD45+CD11b+Ly6C+Ly6G-) and total immune population (remaining clusters; CD45+) sorted from intestinal tumors from ILC2-deficient and Cre control Apc1322T/+ mice (>10 tumors pooled from 3 ILC2-deficient mice; 5 tumors pooled from 3 Cre control mice). (D) UMAP plot with expression levels (log2 expression) of indicated genes (Arg1, Il4ra and Il13ra1) per individual cell. (E and F) Heatmap (E) and KEGG pathway analysis (F) of differentially expressed genes identified through scRNAseq, between tumor M-MDSCs from ILC2-deficient and Cre control Apc1322T/+ mice. (G) UMAP plot with expression levels (log2 expression) of indicated genes (Ifng, Prf1, Gzma and Gzmb) per individual cell. (H) Frequency of tumor Th1 cells (Cre control, n = 6; ILC2-deficient, n = 8) and CD8+ T cells (Cre control, n = 6; ILC2-deficient, n = 12), in ILC2-deficient and Cre control Apc1322T/+ mice. (I and J) Frequency of tumor Th2 cells (Cre control, n = 6; ILC2-deficient, n = 8) (I), and M-MDSCs and G-MDSCs (Cre control, n = 8; ILC2-deficient, n = 10) (J), in ILC2-deficient and Cre control Apc1322T/+ mice. (K) Number of tumors and average tumor size in vehicle or rIL-25-treated ILC2-deficient (Roraf/fIl7rCre/+) Apc1322T/+ mice (vehicle, n = 9; rIL-25, n = 9). (L) Frequency of tumor Th2 cells in vehicle or rIL-25-treated ILC2-deficient Apc1322T/+ mice (vehicle, n = 7; rIL-25, n = 7). Data pooled from two or more independent experiments and error bars show mean ± SEM (A, B, and H to L). Statistical significance determined by unpaired two-tailed t-test, except in (B) by two-sided log-rank test, and in (F) by 10x Genomics Loupe Browser and Enrichr. n.s. non-signifiacnt, *P < 0.05, **P < 0.01, ***P < 0.001, ****P < 0.0001.
Fig. 4
Fig. 4. ILC2s promote M-MDSCs via IL-4 and IL-13 to suppress anti-tumor immunity.
(A and B) Representative FACS plots and expression level (relative gMFI) of IL-4Rα (A) and IL-13Rα1 (B), on M-MDSCs in tumor and adjacent lamina propria (Adj LP) from Apc1322T/+ mice (n = 5). Relative gMFI, geometric mean fluorescent intensity relative to isotype control. (C) Arginase 1 (Arg1) expression in tumor M-MDSCs from ILC2-deficient and Cre control Apc1322T/+ mice (Cre control, n = 4; ILC2-deficient, n = 5). (D) Arg1 expression in splenic and tumor M-MDSCs cultured with ILC2-supernatent (ILC2-SNT) pre-treated with anti-IL-4 and anti-IL-13 neutralizing antibodies (αIL-4/13Ab-ILC2-SNT) or control antibody (conAb-ILC2-SNT) (n = 6). (E and F) IFNγ (E) and granzyme B (F) expression in CD8+ T cells cultured alone or with tumor M-MDSCs, in the presence of αIL-4/13Ab-ILC2-SNT or conAb-ILC2-SNT (n = 6). (G) Representative light microscopy images showing tumor M-MDSC and CD8+ T cell coculture treated with αIL-4/13Ab-ILC2-SNT or conAb-ILC2-SNT; images taken after 3 days of coculture and arrows point to examples of T cell proliferation foci. (H) Quantification of CD8+ T cell proliferation when cocultured with tumor M-MDSCs treated with αIL-4/13Ab-ILC2-SNT or conAb-ILC2-SNT (n = 6). (I) Number of tumors and average tumor size in control (Il13+/+ and Il13+/tom) and IL-13-deficient (Il13tom/tom) Apc1322T/+ mice (control, n = 11; IL-13-deficient, n = 9). (J) Frequency of Arg1 expressing M-MDSCs in control and IL-13-deficient Apc1322T/+ mice (control, n = 7; IL-13-deficient, n = 7). (K) IFNγ expression in tumor CD4+ and CD8+ T cells, from control and IL-13-deficient Apc1322T/+ mice (control, n = 7; IL-13-deficient, n = 7). (L) Representative FACS plots and frequency of M-MDSCs in control rIgG2b and anti-Gr1 treated Apc1322T/+ mice (control, n = 8; treatment, n = 7). (M) Number of tumors and average tumor size in control and anti-Gr1 treated Apc1322T/+ mice (control, n = 8; treatment, n = 7). (N) IFNγ expression in tumor CD4+ and CD8+ T cells, from control and anti-Gr1 treated Apc1322T/+ mice (control, n = 8; treatment, n = 7). (O) Number of tumors and average tumor size in control rIgG1 or anti-IFNγ treated ILC2-deficient (Roraf/fIl7rCre/+) Apc1322T/+ mice (control, n = 9; anti-IFNγ, n = 8). Data pooled from 25 two or more independent experiments and error bars show mean ± SEM. Statistical significance determined by paired two-tailed t-test (A, B, and H), unpaired two-tailed t-test (C, and I to O), and one-way ANOVA with Tukey’s post hoc (D to F). n.s. non-signifiacnt, *P < 0.05, **P < 0.01, ***P < 0.001, ****P < 0.0001.
Fig. 5
Fig. 5. ILC2s are associated with impaired anti-tumor immunity in human CRC.
(A and B) Correlation of CD8+ T cells and ILC2s (A), and Th1 cells and ILC2s (B), in human CRC samples. (C) Frequency of G-MDSCs in human CRC and adjacent normal gut. (D) HLA-DR expression level (relative gMFI) of M-MDSCs in human CRC and adjacent normal gut. Relative gMFI, geometric mean fluorescent intensity relative to FMO control. FMO, full-minus-one. (E) Correlation of M-MDSCs and ILC2s in human CRC samples. (F) Correlation of M-MDSCs and CD8+ T cells in human CRC samples. Each dot or pair of dots indicates an individual human CRC patient; (A to C, E and F) n = 11; (D), n = 9. Data pooled from two or more independent experiments and error bars show mean ± SEM. Statistical significance determined by paired two-tailed t-test (C and D), and by Pearson’s rank correlation coefficient (A, B, E and F). **P < 0.01.
Fig. 6
Fig. 6. Therapeutic intervention blocking the IL-25-ILC2 axis promotes anti-tumor immunity and decreases tumor burden.
(A) Schematic of anti-IL-25R or control treatment starting in adult Apc1322T/+ mice with established tumors; mice were injected two times per week for four weeks. (B) Number of tumors and average tumor size in anti-IL-25R or control IgG1-treated Apc1322T/+ mice (control IgG1, n = 7; anti-IL-25R, n = 7). (C and D) Frequency (C), and IL-4 and IL-13 expression (D) in tumor ILC2s from anti-IL-25R or control IgG1-treated Apc1322T/+ mice (control IgG1, n = 7; anti-IL-25R, n = 7). (E) Arginase 1 (Arg1) expression in tumor M-MDSCs from anti-IL-25R or control IgG1-treated Apc1322T/+ mice (control IgG1, n = 7; anti-IL-25R, n = 7). (F to H) Frequency and IFNγ expression in tumor CD8+ T cells (F), gd T cells (G), and Th1 cells (H), from anti-IL-25R or control IgG1-treated Apc1322T/+ mice (control IgG1, n = 7; anti-IL-25R, n = 7). Data collected from age-matched female mice treated with anti-IL-25R or control IgG1, and pooled from two independent experiments; error bars show mean ± SEM. Statistical significance determined by unpaired two-tailed t-test. *P < 0.05, **P < 0.01.
Fig. 7
Fig. 7. Therapeutic anti-IL-25R treatment shows mechanistic conservation against mice colonic adenocarcinoma.
(A) Number of colonic tumors and average tumor size in anti-IL-25R or control IgG1-treated Apc1322T/+-DSS mice (control IgG1, n = 11; anti-IL-25R, n = 11). Apc1322T/+-DSS mice, dextran sulfate sodium treated Apc1322T/+ mice. (B and C) Frequency of ILC2s (B) and Arg1+ M-MDSCs (C) in anti-IL-25R or control IgG1-treated Apc1322T/+-DSS mice (control IgG1, n = 7; anti-IL-25R, n = 6). (D) Frequency of tumor Th1 cells and CD4+ T cell IFNγ expression in anti-IL-25R or control IgG1-treated Apc1322T/+-DSS mice (control IgG1, n = 7; anti-IL-25R, n = 6). (E) IFNγ expression in tumor CD8+ T cells from anti-IL-25R or control IgG1-treated Apc1322T/+-DSS mice (control IgG1, n = 7; anti-IL-25R, n = 6). (F) Number of colonic tumors and average tumor size (Cre control, n = 9; ILC2-deficient, n = 15) in ILC2-deficient (Roraf/fIl7rCre/+) and Cre control (Rora+/+Il7rCre/+) Apc1322T/+-DSS mice. (G) Frequency of colonic tumor Arg1+ M-MDSCs (Cre control, n = 9; ILC2-deficient, n = 15) from ILC2-deficient and Cre control Apc1322T/+-DSS mice. (H) IFNγ expression in colonic tumor CD8+ and CD4+ T cells (Cre control, n = 9; ILC2-deficient, n = 15) from ILC2-deficient and Cre control Apc1322T/+-DSS mice. (I) Schematic (top) of ILC2-deficient Apc1322T/+-DSS mice adoptively transferred with ILC2s or control, and frequency (bottom) of colonic tumor ILC2s at point of analysis (Control, n = 5; ILC2, n = 6). (J) Frequency of Arg1+ M-MDSCs in ILC2-deficient Apc1322T+-DSS mice adoptively transferred with ILC2s or control (Control, n = 5; ILC2, n = 6). (K and L) IFNγ expression in colonic tumor CD8+ and CD4+ T cells (K), and colon tumor number and size (L), in ILC2-deficient Apc1322T/+-DSS mice adoptively transferred with ILC2s or control (Control, n = 5; ILC2, n = 6). (M and N) Frequency of colonic tumor Arg1+ M-MDSCs (M), and CD8+ and CD4+ T cell IFNγ expression (N) in ILC2-deficient Apc1322T/+-DSS mice adoptively transferred with wild type or IL-13-deficient ILC2s (wild type, n = 7; IL-13-deficient, n = 6). Data collected from age-matched female mice treated with DSS, and pooled from two or more independent experiments; error bars show mean ± SEM. Statistical significance determined by unpaired two-tailed t-test. *P < 0.05, **P < 0.01, ***P < 0.001, ****P < 0.0001.

Comment in

  • ILC2s-Bipartisan politicians in cancer.
    Zebboudj A, Amisaki M, Balachandran VP. Zebboudj A, et al. Sci Immunol. 2022 Jun 3;7(72):eabq2791. doi: 10.1126/sciimmunol.abq2791. Epub 2022 Jun 3. Sci Immunol. 2022. PMID: 35658014 Free PMC article.

References

    1. Neill DR, Wong SH, Bellosi A, Flynn RJ, Daly M, Langford TKA, Bucks C, Kane CM, Fallon PG, Pannell R, Jolin HE, et al. Nuocytes represent a new innate effector leukocyte that mediates type-2 immunity. Nature. 2010;464:1367–1370. - PMC - PubMed
    1. Fallon PG, Ballantyne SJ, Mangan NE, Barlow JL, Dasvarma A, Hewett DR, McIlgorm A, Jolin HE, McKenzie ANJ. Identification of an interleukin (IL)-25-dependent cell population that provides IL-4, IL-5, and IL-13 at the onset of helminth expulsion. The Journal of experimental medicine. 2006;203:1105–1116. - PMC - PubMed
    1. von Moltke J, Ji M, Liang H-E, Locksley RM. Tuft-cell-derived IL-25 regulates an intestinal ILC2-epithelial response circuit. Nature. 2016;529:221–225. - PMC - PubMed
    1. Oliphant CJ, Hwang YY, Walker JA, Salimi M, Wong SH, Brewer JM, Englezakis A, Barlow JL, Hams E, Scanlon ST, Ogg GS, et al. MHCII-mediated dialog between group 2 innate lymphoid cells and CD4(+) T cells potentiates type 2 immunity and promotes parasitic helminth expulsion. Immunity. 2014;41:283–295. - PMC - PubMed
    1. Bray F, Ferlay J, Soerjomataram I, Siegel RL, Torre LA, Jemal A. Global cancer statistics 2018: GLOBOCAN estimates of incidence and mortality worldwide for 36 cancers in 185 countries. CA: A Cancer Journal for Clinicians. 2018;68:394–424. - PubMed

Publication types