. 2022 Jun 3;8(22):eabm5563.
doi: 10.1126/sciadv.abm5563. Epub 2022 Jun 3.

Patched 1 regulates Smoothened by controlling sterol binding to its extracellular cysteine-rich domain

Affiliations

Patched 1 regulates Smoothened by controlling sterol binding to its extracellular cysteine-rich domain

Maia Kinnebrew et al. Sci Adv. .

Abstract

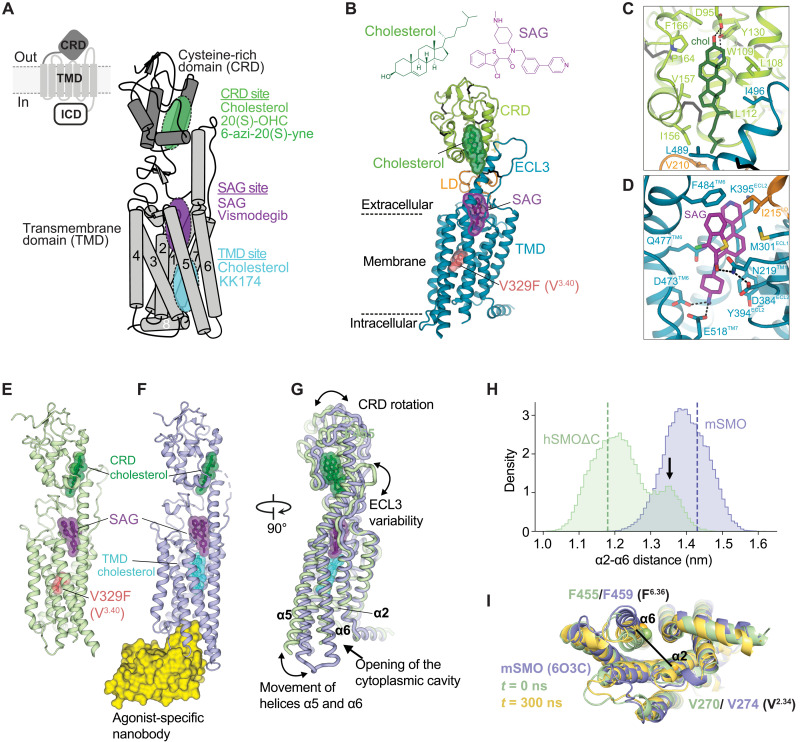
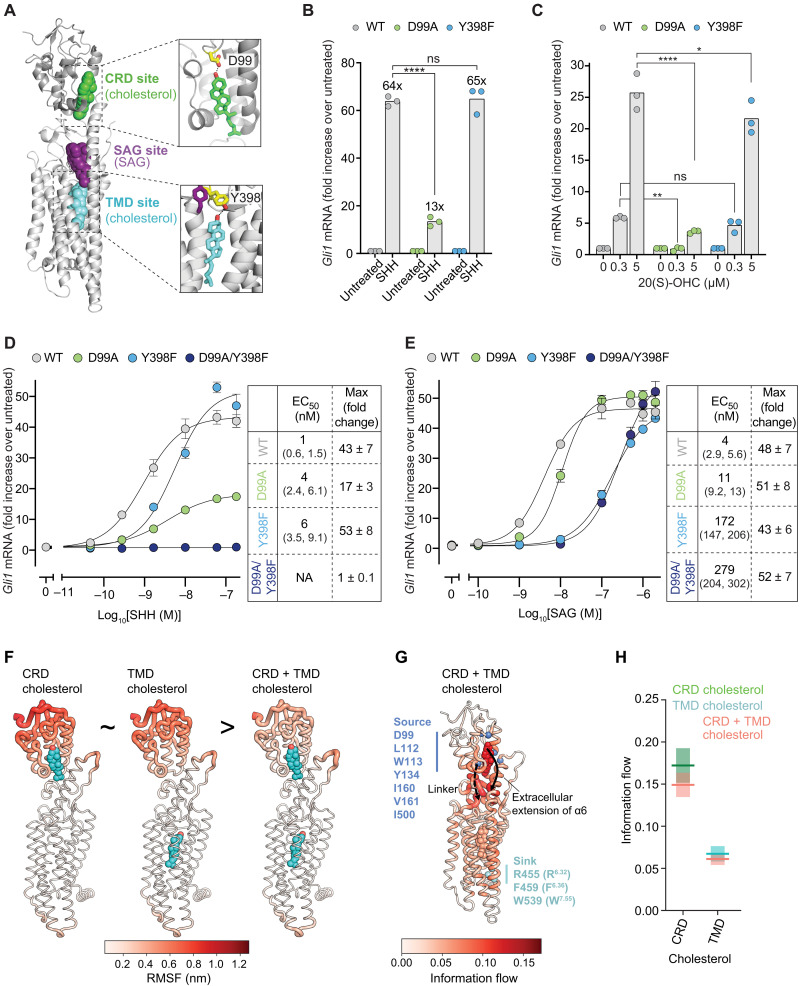
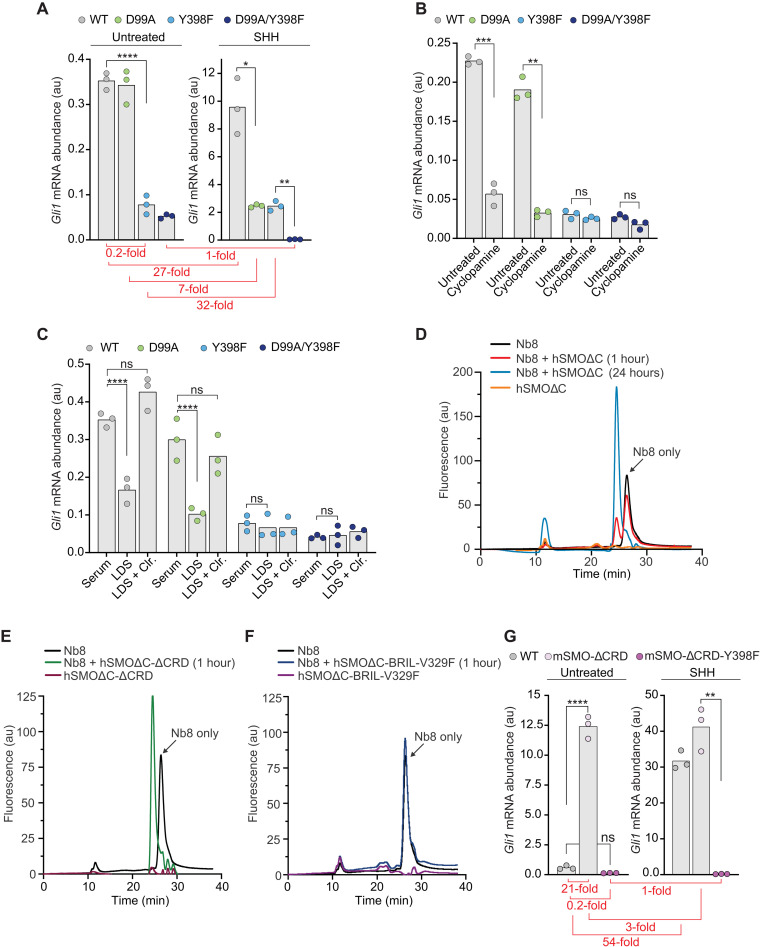
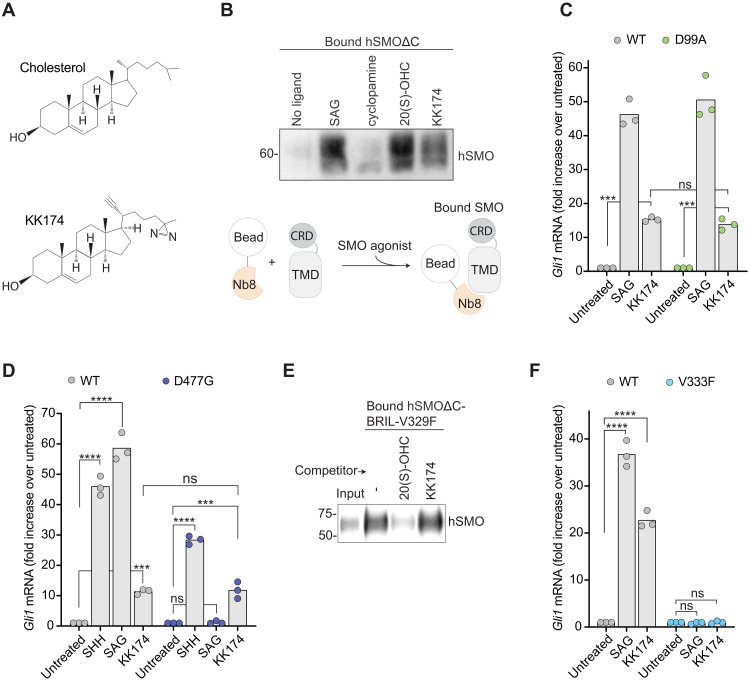
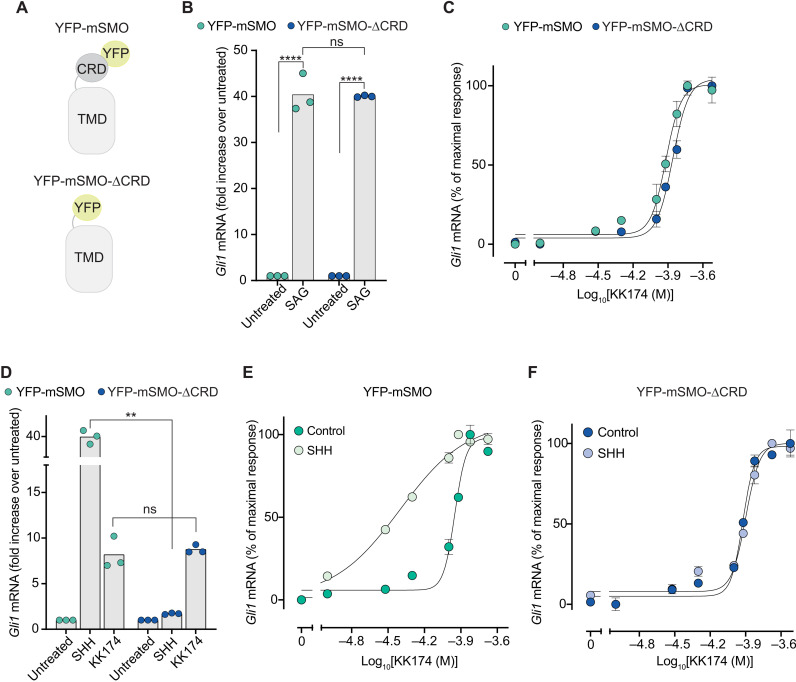
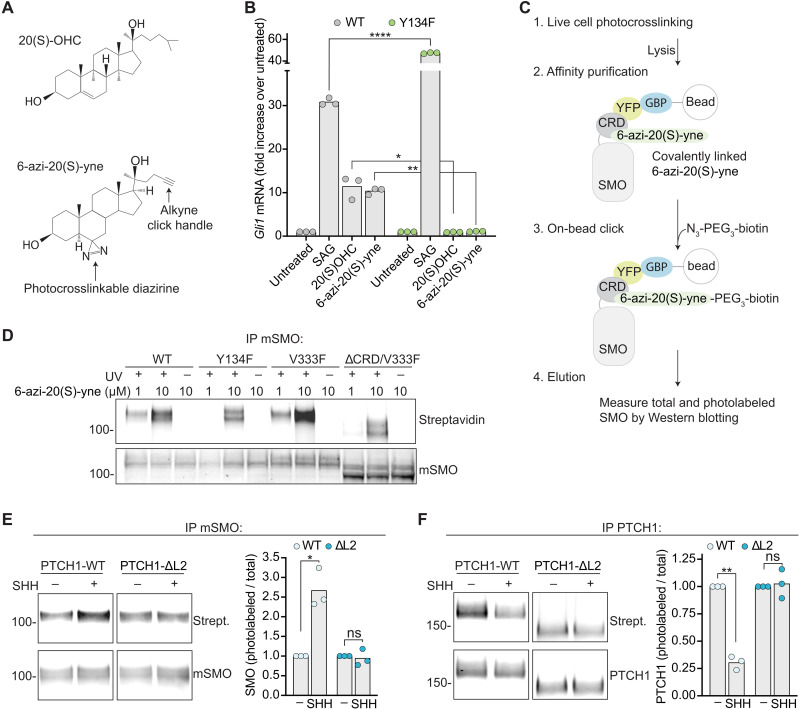
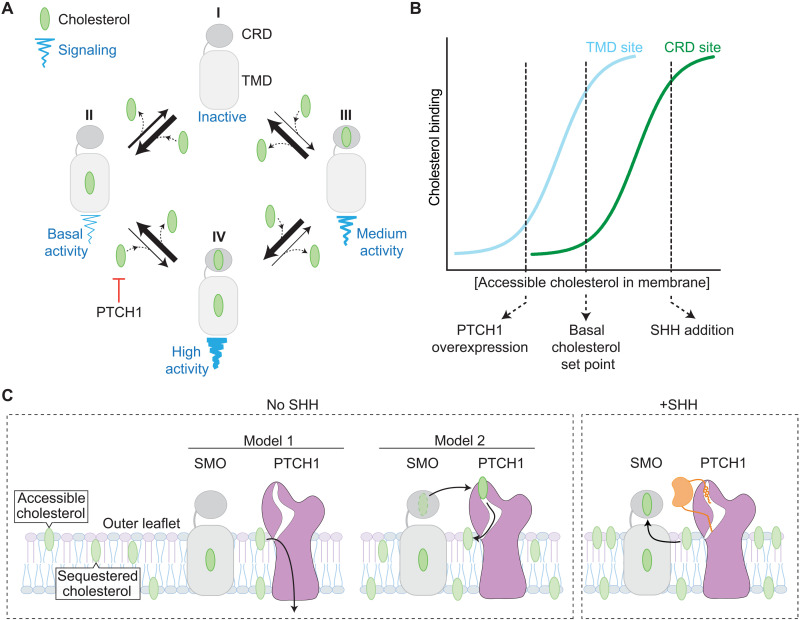
Smoothened (SMO) transduces the Hedgehog (Hh) signal across the plasma membrane in response to accessible cholesterol. Cholesterol binds SMO at two sites: one in the extracellular cysteine-rich domain (CRD) and a second in the transmembrane domain (TMD). How these two sterol-binding sites mediate SMO activation in response to the ligand Sonic Hedgehog (SHH) remains unknown. We find that mutations in the CRD (but not the TMD) reduce the fold increase in SMO activity triggered by SHH. SHH also promotes the photocrosslinking of a sterol analog to the CRD in intact cells. In contrast, sterol binding to the TMD site boosts SMO activity regardless of SHH exposure. Mutational and computational analyses show that these sites are in allosteric communication despite being 45 angstroms apart. Hence, sterols function as both SHH-regulated orthosteric ligands at the CRD and allosteric ligands at the TMD to regulate SMO activity and Hh signaling.


Figures

Fig. 1.
Fig. 1.. Multiple ligand-binding sites control SMO activation.
(A) SMO is composed of a CRD, TMD, and intracellular domain (ICD). Schematic of mSMO highlighting three ligand-binding sites (the CRD, SAG, and TMD sites) along with interacting ligands. (B) Structure of hSMOΔC-BRIL-V329F in complex with cholesterol and SAG, with close-ups shown in (C) and (D). (E to G) Superposition (G) of the hSMOΔC-BRIL-V329F:cholesterol:SAG complex (E) with the complex of mSMO with SAG, cholesterol, and a nanobody (Nb8) (PDB 6O3C, 13) (F). (F) is considered an active-state SMO structure. (H) Histogram of the distances between the Cα atoms of hSMO V270 (V2.34) on helix α2 and hSMO F455 (F6.36) on helix α6 in atomistic simulations of mSMO (blue) and hSMOΔC (green), each bound to SAG and CRD cholesterol. Dashed lines indicate the starting α2 to α6 distances, and the arrow indicates the increased distance between α2 and α6 caused by outward movement of α6 (fig. S1). (I) Snapshots showing the outward movement of α6 in hSMOΔC (yellow, fig. S1D). The structure in green shows the distance between α2 and α6 at the start of the hSMOΔC simulation, and the structure in blue shows active-state mSMO [Protein Data Bank (PDB) 6O3C] (fig. S1).
Fig. 2.
Fig. 2.. The CRD mediates the fold increase in SMO activity triggered by SHH.
(A) Close-ups of cholesterol bound to the CRD and TMD sites of mSMO (PDB 6O3C). D99 in the CRD and Y398 in the TMD make hydrogen bonds with the 3β-hydroxyl of cholesterol. (B and C) Fold change in endogenous Gli1 mRNA abundance in response to SHH (50 nM for 20 hours) (B) or 20(S)-OHC (20 hours) (C) in Smo−/− cells stably expressing the indicated mSMO variants. ns, not significant. (D and E) Dose response curves for SHH (D) and SAG (E) in Smo−/− cells stably expressing the indicated mSMO variants (20 hour treatment). Tables list the EC50 (with 95% confidence intervals) and the maximum fold change (with SEM). NA, not applicable. (F) RMSF in residues of mSMO bound to the indicated ligands during simulations are mapped onto the mSMO structure and colored from low (white) to high (red) fluctuation. (G) Information flow from source residues lining the CRD pocket (blue) to sink residues on α6/7 (cyan) is colored from regions of low (white) to high (red) information flow. Cholesterol molecules are also colored on the basis of information flow. (H) Information flow through the cholesterol molecules in simulations of mSMO initiated with cholesterol bound to the CRD alone, the TMD alone, or both. Exact P values for comparisons: (B) WT versus D99A (+SHH) < 0.0001 and WT versus Y398F (+SHH) = 0.7545. (C) WT versus D99A [0.3 mM 20(S)-OHC] = 0.0057, WT versus D99A [5 mM 20(S)-OHC] < 0.0001, WT versus Y398F [0.3 mM 20(S)-OHC] = 0.7891, and WT versus Y398F [5 uM 20(S)-OHC] = 0.0399. Experiments shown in (B) to (E) were performed three different times with similar results.
Fig. 3.
Fig. 3.. The TMD site regulates basal SMO activity in the absence of SHH.
(A and B) Absolute Gli1 mRNA abundance (au, arbitrary units) in the presence and absence of SHH (50 nM) (A) or cyclopamine (5 μM) (B) in Smo−/− cells stably expressing the indicated mSMO variants. (C) Gli1 mRNA abundances in the absence of SHH (a measure of basal SMO activity) in medium supplemented with fetal bovine serum (Serum), lipoprotein-depleted fetal bovine serum (LDS), or LDS supplemented with 10 μM MβCD:cholesterol (Clr.). (D to F) Fluorescence-detection size exclusion chromatography (FSEC) was used to assess binding of Nb8-mVenus (13) to the indicated hSMO variants after incubation for 1 hour or 24 hours. Binding to hSMO causes a shift in the Nb8-mVenus elution profile to a higher apparent molecular weight (earlier elution time). (G) Gli1 mRNA abundance in the presence and absence of SHH (50 nM) in Smo−/− cells stably expressing mSMO-WT, mSMO-ΔCRD, or mSMO-ΔCRD-Y398F. The duration of drug treatment in (A), (B), (C), and (G) was 20 hours. The y axes of the graphs without (left) and with (right) SHH in (A) and (G) are different to clearly show basal mSMO signaling activity. The fold change (SHH-stimulated Gli1 divided by basal Gli1) for each of the mSMO variants is depicted in red in (A) and (G). Exact P values for comparisons: (A) WT versus Y398F (untreated) < 0.0001, WT versus D99A (+SHH) = 0.0255, and Y398F versus D99A/Y398F (+SHH) = 0.0068. (B) WT untreated versus cyclopamine = 0.0009, D99A untreated versus cyclopamine = 0.0013, Y398F untreated versus cyclopamine = 0.2262, and D99A/Y398F untreated versus cyclopamine = 0.0622. (C) WT serum versus LDS < 0.0001, WT serum versus LDS + cholesterol = 0.0604, D99A serum versus LDS < 0.0001, D99A serum versus LDS + cholesterol = 0.4310, Y398F serum versus LDS = 0.6333, and D99A/Y398F serum versus LDS = 0.7885. (G) WT versus mSMO-ΔCRD (untreated) < 0.0001, WT versus mSMO-ΔCRD-Y398F (untreated) = 0.5700, and mSMO-ΔCRD versus mSMO-ΔCRD-Y398F (+SHH) = 0.0073.
Fig. 4.
Fig. 4.. KK174 is a SMO agonist that functions at the TMD.
(A) Structures of cholesterol and KK174. (B) The interaction between hSMOΔC and Nb8 was assessed using a pull-down assay in the presence of the indicated SMO ligands (100 μM each for 16 hours). Immunoblot shows the amount of hSMOΔC that coprecipitates with Nb8 captured on beads. Figure S5A shows the abundance of SMO in flow-through samples from this pull-down. (C, D, and F) Fold increase in Gli1 mRNA induced by the addition of the indicated SMO agonists (100 nM SAG, 300 μM MβCD:KK174, and 50 nM SHH for 20 hours) in Smo−/− cells stably expressing mSMO-WT, mSMO-D99A, mSMO-D477G, or mSMO-V333F. (E) A ligand-affinity assay was used to measure the amount of hSMOΔC-BRIL-V329F (7) captured on 20(S)-yne–coupled beads in the presence of 50 μM MβCD:20(S)-OHC or MβCD:KK174. The immunoblot shows 1% of the protein added to each binding reaction (input) and 50% of the protein captured on beads. Exact P values for comparisons: (C) WT untreated versus KK174 = 0.0003, D99A untreated versus KK174 = 0.0009, and WT versus D99A (+KK174) = 0.9194. (D) WT untreated versus SHH < 0.0001, WT untreated versus SAG < 0.0001, WT untreated versus KK174 = 0.0003, D477G untreated versus SHH < 0.0001, D477G untreated versus SAG > 0.9999, D477G untreated versus KK174 = 0.0002, and WT versus D477G (+KK174) > 0.9999. (F) WT untreated versus SAG < 0.0001, WT untreated versus KK174 < 0.0001, V333F untreated versus SAG > 0.9999, and V333F untreated versus KK174 > 0.9999.
Fig. 5.
Fig. 5.. The CRD is required for SMO activation in response to SHH.
(A) Cartoons showing the domain structures of the YFP-mSMO and YFP-mSMO-ΔCRD proteins used in this figure. (B) Fold increase in Gli1 mRNA induced by SAG (100 nM) in Smo−/− cells stably expressing YFP-mSMO or YFP-mSMO-ΔCRD. (C) Dose-response curve for KK174 in Smo−/− cells stably expressing YFP-mSMO or YFP-mSMO-ΔCRD. On the basis of the curve fits, the EC50 of MβCD:KK174 is ~100 μM. (D) Fold increase in Gli1 mRNA induced by SHH (50 nM) or MβCD:KK174 (300 μM) in Smo−/− cells stably expressing YFP-mSMO or YFP-mSMO-ΔCRD. (E and F) Dose-response curves for KK174 in cells expressing either YFP-mSMO or YFP-mSMO-ΔCRD in the presence of a low, subactivating concentration (1 nM) of SHH. In (B) to (F), cells were treated with drugs for 20 hours. Exact P values for comparisons: (B) YFP-mSMO untreated versus SAG < 0.0001, YFP-mSMO versus YFP-mSMO-ΔCRD (+SAG) = 0.9957, and YFP-mSMO-ΔCRD untreated versus SAG < 0.0001. (D) YFP-mSMO versus YFP-mSMO-ΔCRD (+SHH) = 0.0025 and YFP-mSMO versus YFP-mSMO-ΔCRD (+KK174) = 0.6355.
Fig. 6.
Fig. 6.. PTCH1 controls sterol binding to the SMO CRD.
(A) Structures of 20(S)-OHC and 6-azi-20(S)-yne. (B) Fold increase in Gli1 mRNA in response to a 20-hour exposure to 100 nM SAG, 5 μM 20(S)-OHC, or 5 μM 6-azi-20(S)-yne in Smo−/− cells stably expressing either mSMO-WT or mSMO-Y134F (7). (C) Covalent attachment of 6-azi-20(S)-yne to YFP-mSMO in intact cells was measured using diazirine photocrosslinking and click chemistry (31). (D) Photocrosslinking of 6-azi-20(S)-yne to the indicated YFP-mSMO variants with or without exposure to 365 nm ultraviolet (UV) light. The abundances of photolabeled YFP-mSMO (top) and total YFP-mSMO (mSMO) eluted from beads were measured using immunoblotting (fig. S6B shows inputs). IP, immunoprecipitation. (E and F) Photocrosslinking of YFP-mSMO (E) or PTCH1 (F) to 6-azi-20(S)-yne was assessed using the pipeline shown in (C). Graphs depict the ratios of photolabeled to total eluted YFP-mSMO or PTCH1 in three independent experiments. Figure S6 (C and D) show inputs, and fig. S6E shows 6-azi-20(S)-yne cross-linking to YFP-mSMO in the presence or absence of PTCH1. Exact P values for comparisons: (B) mSMO-WT versus mSMO-Y134F (+SAG) < 0.0001, mSMO-WT versus mSMO-Y134F [+20(S)-OHC] = 0.0208, and mSMO-WT versus mSMO-Y134F [+6-azi-20(S)-yne] = 0.0020. (E) PTCH1-WT untreated versus SHH = 0.0288 and PTCH1-DL2 untreated versus SHH = 0.6955. (F) PTCH1-WT untreated versus SHH = 0.0026 and PTCH1-ΔL2 untreated versus SHH = 0.7730.
Fig. 7.
Fig. 7.. A model for SMO activation by dual sterol binding to the TMD and CRD sites.
(A) Linked equilibria showing four states of SMO defined by sterol occupancy of the CRD and TMD sites. At physiological membrane cholesterol levels, SMO mostly exists in state II, with cholesterol bound to the TMD driving basal signaling activity. PTCH1 inhibits the transition from state II to the fully active state IV by reducing accessible cholesterol in the outer leaflet of the membrane. (B) A cartoon depicting the binding of cholesterol to the TMD site (cyan) or the CRD site (green) at increasing levels of accessible cholesterol in the membrane outer leaflet. Under basal (no SHH) conditions, the TMD site is largely occupied, while the CRD site is largely empty. PTCH1 overexpression (especially above physiological levels) can reduce cholesterol binding to both sites by depleting the membrane outer leaflet of accessible cholesterol. Conversely, SHH increases cholesterol binding to the CRD by inactivating PTCH1. (C) Two models for the regulation of SMO signaling by PTCH1. In model 1, PTCH1 depletes the membrane of accessible cholesterol, indirectly inhibiting SMO, while in model 2, PTCH1 directly removes cholesterol from the SMO CRD.

References

    1. Kong J. H., Siebold C., Rohatgi R., Biochemical mechanisms of vertebrate hedgehog signaling. Development 146, dev166892 (2019). - PMC - PubMed
    1. Kinnebrew M., Iverson E. J., Patel B. B., Pusapati G. V., Kong J. H., Johnson K. A., Luchetti G., Eckert K. M., McDonald J. G., Covey D. F., Siebold C., Radhakrishnan A., Rohatgi R., Cholesterol accessibility at the ciliary membrane controls hedgehog signaling. eLife 8, e50051 (2019). - PMC - PubMed
    1. Radhakrishnan A., Rohatgi R., Siebold C., Cholesterol access in cellular membranes controls Hedgehog signaling. Nat. Chem. Biol. 16, 1303–1313 (2020). - PMC - PubMed
    1. Kinnebrew M., Luchetti G., Sircar R., Frigui S., Viti L. V., Naito T., Beckert F., Saheki Y., Siebold C., Radhakrishnan A., Rohatgi R., Patched 1 reduces the accessibility of cholesterol in the outer leaflet of membranes. Elife 10, e70504 (2021). - PMC - PubMed
    1. Luchetti G., Sircar R., Kong J. H., Nachtergaele S., Sagner A., Byrne E. F., Covey D. F., Siebold C., Rohatgi R., Cholesterol activates the G-protein coupled receptor Smoothened to promote Hedgehog signaling. eLife 5, e20304 (2016). - PMC - PubMed

Publication types