. 2022 Jun 3;8(22):eabn7192.
doi: 10.1126/sciadv.abn7192. Epub 2022 Jun 3.

Magnetic-field-dependent stimulated emission from nitrogen-vacancy centers in diamond

Affiliations

Magnetic-field-dependent stimulated emission from nitrogen-vacancy centers in diamond

Felix A Hahl et al. Sci Adv. .

Abstract

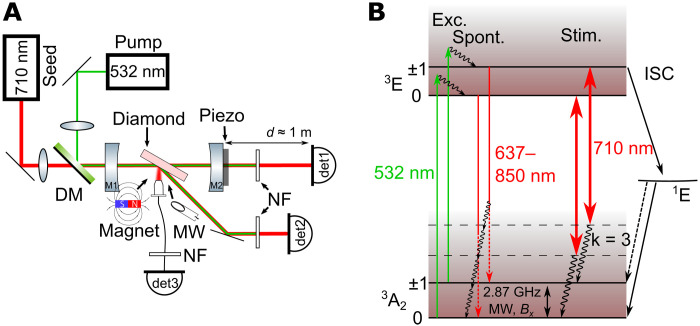
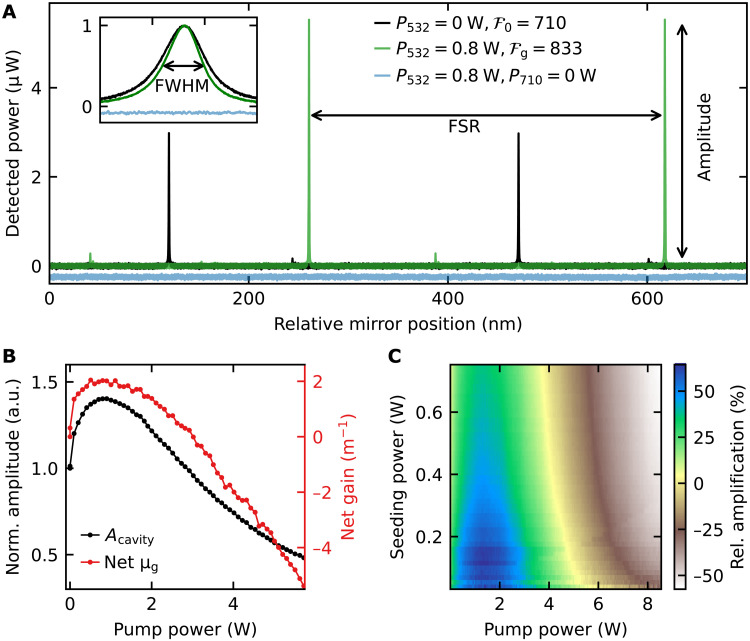
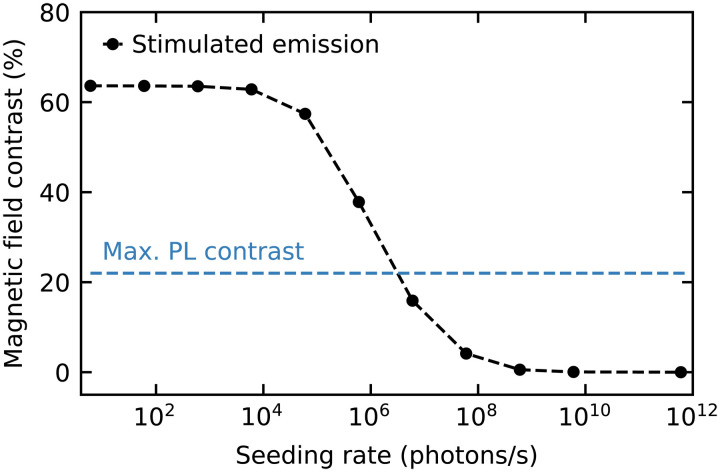
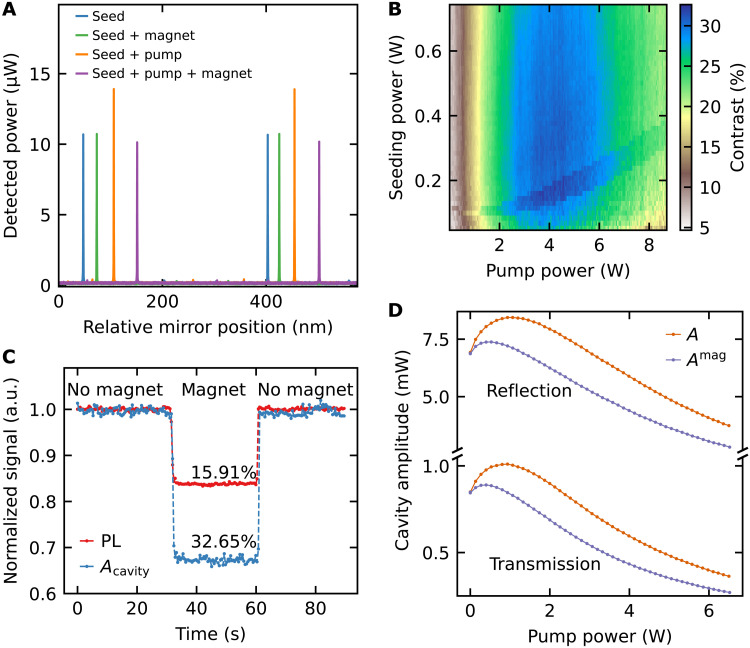
Negatively charged nitrogen-vacancy (NV) centers in diamond are promising magnetic field quantum sensors. Laser threshold magnetometry theory predicts improved NV center ensemble sensitivity via increased signal strength and magnetic field contrast. Here, we experimentally demonstrate laser threshold magnetometry. We use a macroscopic high-finesse laser cavity containing a highly NV-doped and low absorbing diamond gain medium that is pumped at 532 nm and resonantly seeded at 710 nm. This enables a 64% signal power amplification by stimulated emission. We test the magnetic field dependency of the amplification and thus demonstrate magnetic field-dependent stimulated emission from an NV center ensemble. This emission shows an ultrahigh contrast of 33% and a maximum output power in the milliwatt regime. The coherent readout of NV centers pave the way for novel cavity and laser applications of quantum defects and diamond NV magnetic field sensors with substantially improved sensitivity for the health, research, and mining sectors.


Figures

Fig. 1.
Fig. 1.. Concept for measuring stimulated emission.
(A) Experimental setup: The pump laser (532 nm) and the seeding laser (710 nm) are combined with a dichroic mirror (DM) and individually focused into the cavity. The green laser is blocked via 532-nm notch filters (NF). Detected are the transmitted (det1), reflected (det2), and PL signals (det3). (B) NV center energy level schematic: The system is pumped (Exc.) by a 532-nm laser from the ground (3A2) to the excited state (3E). The spontaneous emission (Spont.) spectrum is in the red to near-infrared regime (637 to 850 nm). The effective magnetic field Bx, as well as a continuous microwave drive at 2.87 GHz, lead to spin-mixing. Phonon levels are indicated by the shaded area. The three-phonon transitions of the spin ms = 0 ± 1 states at λ = 710 nm, where stimulated emission (Stim.) occurs, are indicated with the large double arrow.
Fig. 2.
Fig. 2.. Measurement and amplification of the cavity mode.
(A) Finesse and amplification measurement of the cavity via scanning the position of one mirror. The black trace shows the signal of the seeding laser only at 710 nm. When the green laser pumps the NV centers, the finesse and amplitude increase (green trace). The signal of only the green laser pumping (blue trace) is shifted for better visibility. The inset shows a zoom into normalized and overlapped peaks. (B) Cavity amplitude Acavity (black) and net gain μg (red) as a function of the pump power. Acavity is normalized to the amplitude at zero pump power. The net gain is calculated from the measured finesse (section S1). (C) Amplification ΔA over input pumping power P532 and input seeding power P710. The amplification ΔA is the relative difference to the case of zero pumping power P532 = 0 W. Maximal amplification of 64% occurs at 1- to 2-W pump and <0.2-W seeding power. a.u., arbitrary units.
Fig. 3.
Fig. 3.. Simulation of the magnetic field contrast by stimulated emission in a seeded cavity.
The contrast by stimulated emission is exceeding the PL contrast for low external seeding, i.e., a high contribution of the stimulated emission to the detection signal. The contrast is calculated by the relative difference of the stimulated emission rates C = 1 − Γst(B ≠ 0)/Γst(B = 0). A detailed calculation can be found in section S8.
Fig. 4.
Fig. 4.. Magnetic field–dependent amplification with ultrahigh contrast.
(A) Detection of the transmitted cavity power over the relative mirror position. The transmission of only the red laser (Seed) is not influenced when a strong magnet is brought close to the diamond (Seed + magnet). Strong amplification of the mode appears when the green laser pumps the NV centers (Seed + pump). Bringing a magnet close to the diamond substantially reduces the amplified signal (Seed+ pump + magnet). The power for the seed and pump laser is P710 = 0.3 W and P532 = 1.37 W, respectively. The data are shifted horizontally for clarity. (B) Contrast of the detected amplitude over the pump P532 and seeding P710 power. (C) Transmitted peak amplitude (det1) of the cavity mode Acavity and laterally emitted PL (det3) are detected simultaneously over time. When the magnet is brought close to the diamond for 30 s, both signals decrease. (D) Measurement of the reflected (det2) and transmitted (det1) amplitudes in absolute values with (Amag) and without (A) magnet over the pump power P532 (note the subdivided vertical axis). The seeding power is set to P710 = 1.14 W. The data represent the mean value of eight measurements.
Fig. 5.
Fig. 5.. ODMR via stimulated emission.
(A) Normalized detected power of the transmitted cavity amplitude (Acavity, det1) and PL signal (det3). The arrows show that the cavity mode has better contrast than the simultaneous PL measurement. (B) The detected absolute power of the reflected cavity amplitude (Aref, det2) is much higher than the PL signal, when optimized for high power. A double Lorentzian is fitted to the data for all cases (black lines).

References

    1. Boto E., Holmes N., Leggett J., Roberts G., Shah V., Meyer S. S., Muñoz L. D., Mullinger K. J., Tierney T. M., Bestmann S., Barnes G. R., Bowtell R., Brookes M. J., Moving magnetoencephalography towards real-world applications with a wearable system. Nature 555, 657–661 (2018). - PMC - PubMed
    1. Zhang R., Xiao W., Ding Y., Feng Y., Peng X., Shen L., Sun C., Wu T., Wu Y., Yang Y., Zheng Z., Zhang X., Chen J., Guo H., Recording brain activities in unshielded Earth’s field with optically pumped atomic magnetometers. Sci. Adv. 6, eaba8792 (2020). - PMC - PubMed
    1. Bison G., Castagna N., Hofer A., Knowles P., Schenker J.-L., Kasprzak M., Saudan H., Weis A., A room temperature 19-channel magnetic field mapping device for cardiac signals. Appl. Phys. Lett. 95, 173701 (2009).
    1. Lembke G., Erné S. N., Nowak H., Menhorn B., Pasquarelli A., Bison G., Optical multichannel room temperature magnetic field imaging system for clinical application. Biomed. Opt. Express 5, 876–881 (2014). - PMC - PubMed
    1. Keenan S. T., Blay K. R., Romans E. J., Mobile magnetic anomaly detection using a field-compensated high-Tc single layer SQUID gradiometer. Supercond. Sci. Technol. 24, 085019 (2011).