. 2022 Jun 3;18(6):e1010569.
doi: 10.1371/journal.ppat.1010569. eCollection 2022 Jun.

Longitudinal kinetics of RBD+ antibodies in COVID-19 recovered patients over 14 months

Affiliations

Longitudinal kinetics of RBD+ antibodies in COVID-19 recovered patients over 14 months

Tsuf Eyran et al. PLoS Pathog. .

Abstract

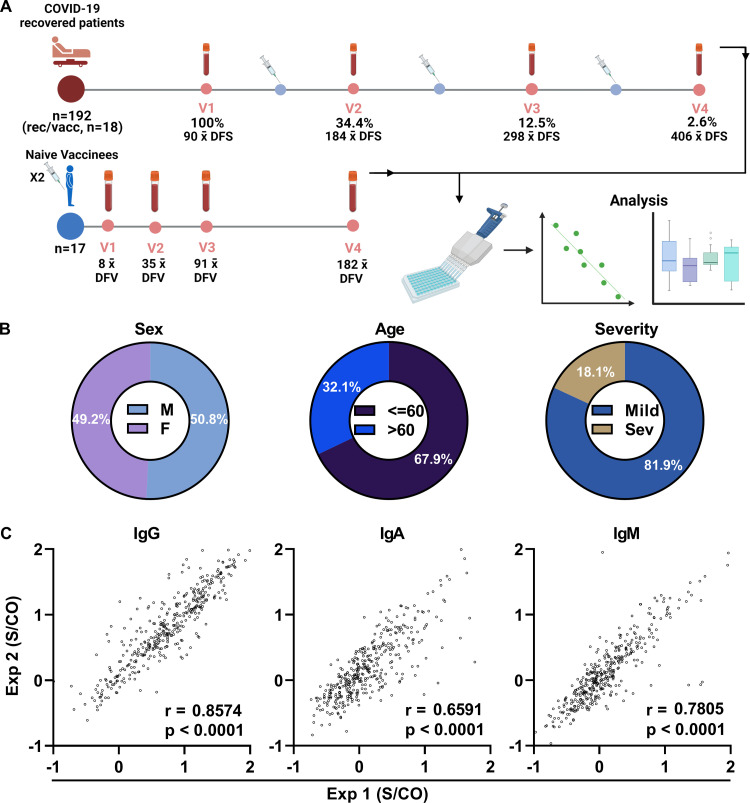
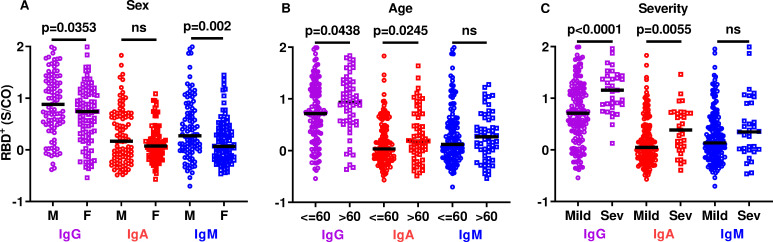
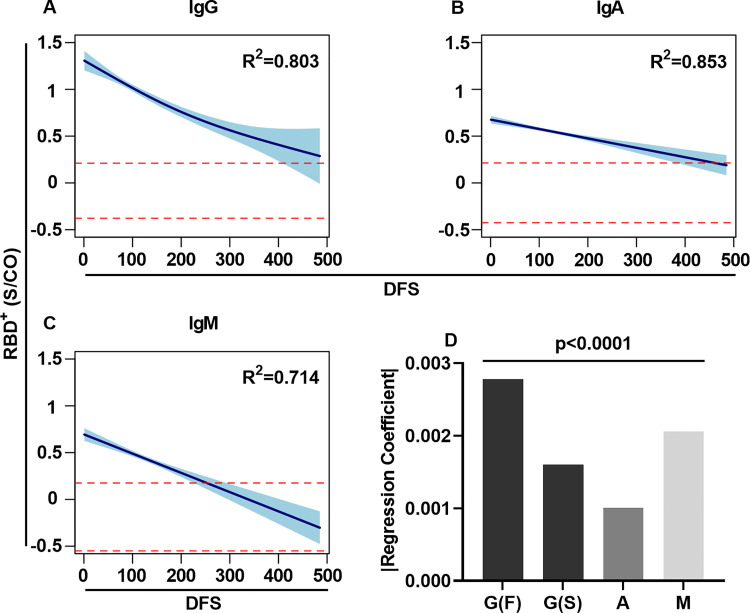
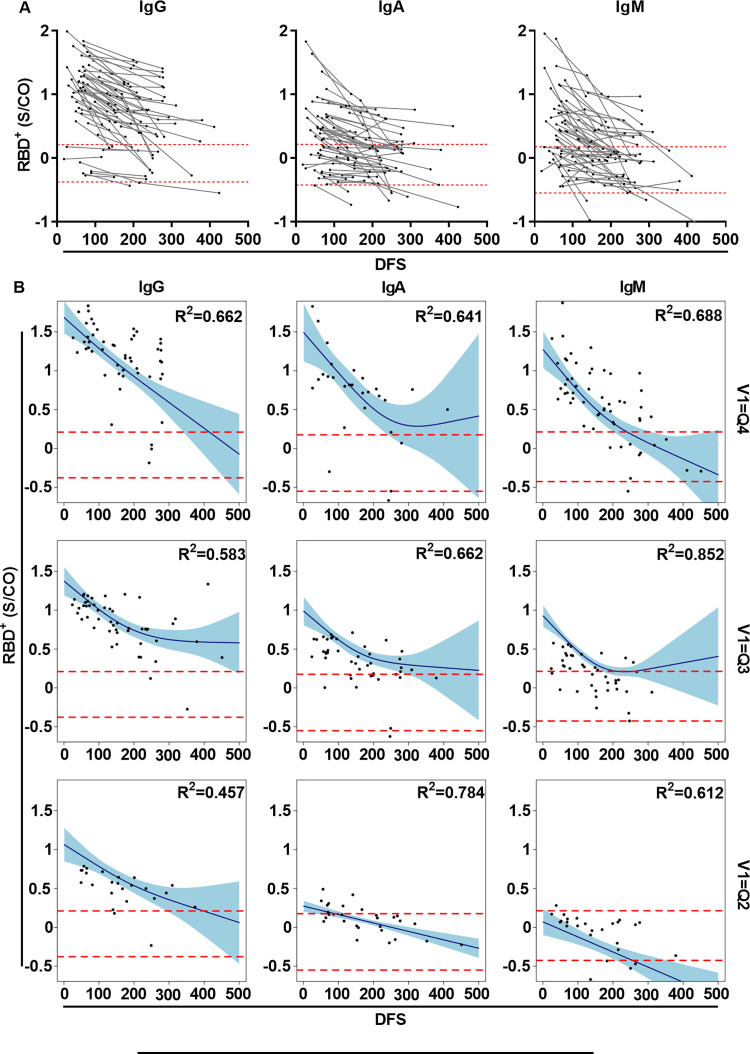
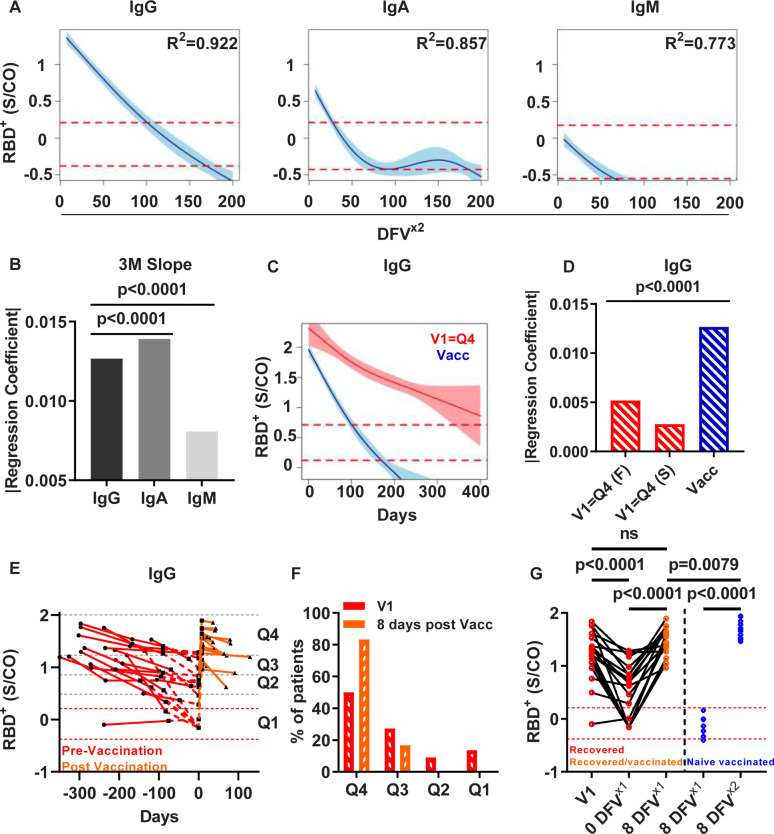
We describe the longitudinal kinetics of the serological response in COVID-19 recovered patients over a period of 14 months. The antibody kinetics in a cohort of 192 recovered patients, including 66 patients for whom follow-up serum samples were obtained at two to four clinic visits, revealed that RBD-specific antibodies decayed over the 14 months following the onset of symptoms. The decay rate was associated with the robustness of the response in that antibody levels that were initially highly elevated after the onset of symptoms subsequently decayed more rapidly. An exploration of the differences in the longitudinal kinetics between recovered patients and naïve vaccinees who had received two doses of the BNT162b2 vaccine showed a significantly faster decay in the naïve vaccinees, indicating that serological memory following natural infection is more robust than that following to vaccination. Our data highlighting the differences between serological memory induced by natural infection vs. vaccination contributed to the decision-making process in Israel regarding the necessity for a third vaccination dose.


Conflict of interest statement

The authors have declared that no competing interests exist.

Figures

Fig 1
Fig 1. Experimental design, cohort characteristics, and reproducibility of antibody level measurements.
(A) The cohort comprised 192 COVID-19 recovered patients; blood samples were obtained from all the patients at V1, and from 66 patients at subsequent visits (V2-V4) at intervals of approximately 3 months between visits. A subset of the patients (n = 18) received one dose of an mRNA-vaccine at various time points [days following the onset of symptoms (DFS)], indicated by syringe icons at various time points. Blood samples were also collected from a cohort of naïve vaccinees (n = 17) who received 1 and 2 doses the mRNA-vaccine. All blood samples were fractionated for the isolation of plasma samples, which were used for the determination of the RBD+ antibody levels and for the analysis of the longitudinal kinetics. (B) The characteristics of the cohort of COVID-19 recovered patients included a balanced male/female population, with 67.9% below and 32.1% above 60 years. The majority of patients exhibited mild symptoms (81.9%), but symptoms were severe in 18.1% of patients. (C) RBD+ measurements were carried out in duplicate, and each experiment was repeated twice (designated Exp1 and Exp2 on the x- and y-axes, respectively). Values on the x and y axes are presented as log10 signal over cutoff (S/CO). Pearson’s correlation coefficient (r) was used to determine the reproducibility of the experiments. p values < 0.05 were considered significant.
Fig 2
Fig 2. SARS-CoV-2 RBD+ antibody levels at V1 by sex, age, and disease severity.
Scatter plots of RBD+ IgG/A/M levels in COVID-19 recovered patients at V1, by sex (A), age (B), and COVID-19 severity (C). Values on the y-axis are presented as the ratio between the signal obtained to the mean signal for the negative controls (cutoff) in each microwell plate (S/CO). Mean values are indicated by solid black lines. P values were determined using an unpaired, two-sided Mann-Whitney U-test; p < 0.05 was considered statistically significant. M—male; F—female; Mild—mild symptoms during the active phase of the disease; Sev—severe symptoms during the active phase of the disease.
Fig 3
Fig 3. RBD+ antibody longitudinal kinetics over the period of 14 months.
GAMM analysis of RBD+ antibody longitudinal kinetics for IgG (A), IgA (B) and IgM (C). The y-axis in log10 and the x-axis show days following symptoms (DFS). Dashed red lines represent the maximum and minimum range of the antibody levels, as measured in negative control samples (n = 27). GAMM analysis was used to determine the regression coefficient for each isotype. Negative regression coefficients (i.e., slope) of a two-phase decay or a linear decay were determined for IgG, IgA, and IgM, indicating that all isotypes decayed over the 14-month period. The 95% CI is plotted in turquoise. (D) Bar plot showing the multiple comparison analysis of the regression coefficients obtained for IgG in its fast (F) and slow (S) decay rate phases and the decay rate of IgA, and IgM. For all graphs, p values, R2, effective degrees of freedom (edf) and slopes are shown in S2 Table. p values < 0.05 were considered significant.
Fig 4
Fig 4. Longitudinal kinetics of RBD+ antibodies in COVID-19 recovered follow-up patients.
(A) RBD+ IgG/A/M levels in COVID-19 recovered patients for whom we collected follow-up samples at visits 2–4. Y-axis in log10 and x-axis show days following symptoms (DFS). Dashed red lines represent the range of the antibody levels as measured in negative control samples (n = 27). Follow up samples from the same patient are connected by gray lines. (B) GAMM analysis of RBD+ antibody longitudinal kinetics stratified by quartiles. The antibody levels at V1 determined the assigned quartile, and follow-up samples from the same patients were used to determine the regression coefficients for each quartile. Four quartiles for each isotype were analyzed. The 95% CI is plotted in turquoise. For all plots, p values, R2, effective degrees of freedom (edf), and regression coefficients are shown in S2 Table. p values < 0.05 were considered significant.
Fig 5
Fig 5. Comparison of RBD+ antibody decay between quartile groups for each isotype in COVID-19 recovered patients.
Linear regression models were fitted to each quartile for all the isotypes. The linear regression coefficients were determined from the F and S phases of the two-phase decay model. Y-axis shows the absolute regression coefficient, x-axis represents the quartile and the phase of the decay (F/S and no indication for F/S if the regression did not fir a two-phase decay model) For all plots, p values, R2, effective degrees of freedom(edf), and slopes are shown in S2 Table. p values < 0.05 were considered significant.
Fig 6
Fig 6. RBD+ antibody longitudinal kinetics in naïve vaccinees and recovered/vaccinated patients.
(A) RBD+ IgG/A/M longitudinal kinetics in naïve vaccinees following two vaccine doses (n = 17). GAMM analysis was applied, and regression coefficient was determined. The 95% CI is shown in turquoise. Y-axis log10 and X-axis show days following vaccination (DFVx2). Dashed red lines indicate the upper and lower limit of negative control samples (n = 27). (B) Bar plot comparing the regression coefficient obtained for IgG, IgA, and IgM during the 90 DFVx2 (3 months following vaccine, 3M slope). For all plots R2 is indicated, and p value, slopes, and effective degree of freedom (edf) can be found in S2 Table. p values < 0.05 were considered significant. (C) RBD+ IgG longitudinal kinetics in naïve vaccinees in comparison with the kinetics in recovered patients whose IgG levels were assigned to Q4 at V1. Y-axis log10 shows IgG levels (S/CO), x-axis shows DFS for recovered patients (red) and DFVx2 for naïve vaccinees (blue). (D) Multiple comparison analysis of the regression coefficients obtained for the fast decay (F) and slow (S) decay rate in recovered patients and naïve vaccinees. Y-axis represents the absolute regression coefficient values. (E) Utilizing each patients’ regression model pre-vaccination and the known vaccination day, the RBD+ IgG level was extrapolated to predict the IgG level on the day of vaccination (0 DFVx1). IgG levels post vaccination at V4 were used to extrapolate the antibody levels for 8 DFVx1. Y-axis represents the RBD+ IgG levels in log10, x-axis represents days in relation to the day of vaccination (i.e. 0 DFVx1). Dashed red lines indicate the upper and lower limit of negative control samples (n = 27). (F) Distribution of the recovered/vaccinated patients among quartiles based on their antibody levels at V1 compared to the extrapolated antibody levels at 8 DFVx1. Y-axis shows the percentage of recovered patients that were assigned to each quartile. X-axis shows quartile groups. (G) Comparison of the RBD+ IgG levels in recovered patients at V1, the RBD+ IgG levels at 0 DFVx1 and 8 DFVx1 in recovered patients, and the RBD+ IgG levels of naïve vaccinees 8 DFVx1 and DFVx2. Y-axis in log10 IgG levels (S/CO), x-axis shows the relative days from vaccination of each sub-cohort. Dashed red lines indicate the upper and lower limits of the antibody levels in the negative control group (n = 27).

Similar articles

Cited by

References

    1. Wang C, Horby PW, Hayden FG, Gao GF. A novel coronavirus outbreak of global health concern. The Lancet. 2020;395(10223):470–3. doi: 10.1016/S0140-6736(20)30185-9 - DOI - PMC - PubMed
    1. Phelan AL, Katz R, Gostin LO. The Novel Coronavirus Originating in Wuhan, China: Challenges for Global Health Governance. JAMA. 2020;323(8):709–10. doi: 10.1001/jama.2020.1097 - DOI - PubMed
    1. Cucinotta D, Vanelli M. WHO Declares COVID-19 a Pandemic. Acta Biomed. 2020;91(1):157–60. doi: 10.23750/abm.v91i1.9397 - DOI - PMC - PubMed
    1. Zhu N, Zhang D, Wang W, Li X, Yang B, Song J, et al.. A Novel Coronavirus from Patients with Pneumonia in China, 2019. NEJM. 2020;382(8):727–33. doi: 10.1056/NEJMoa2001017 - DOI - PMC - PubMed
    1. Huang AT, Garcia-Carreras B, Hitchings MDT, Yang B, Katzelnick LC, Rattigan SM, et al.. A systematic review of antibody mediated immunity to coronaviruses: kinetics, correlates of protection, and association with severity. Nat Commun. 2020;11(1):4704. doi: 10.1038/s41467-020-18450-4 - DOI - PMC - PubMed

Publication types