

The neural signature of the decision value of future pain
- PMID: 35658082
- PMCID: PMC9191656
- DOI: 10.1073/pnas.2119931119
The neural signature of the decision value of future pain
Abstract
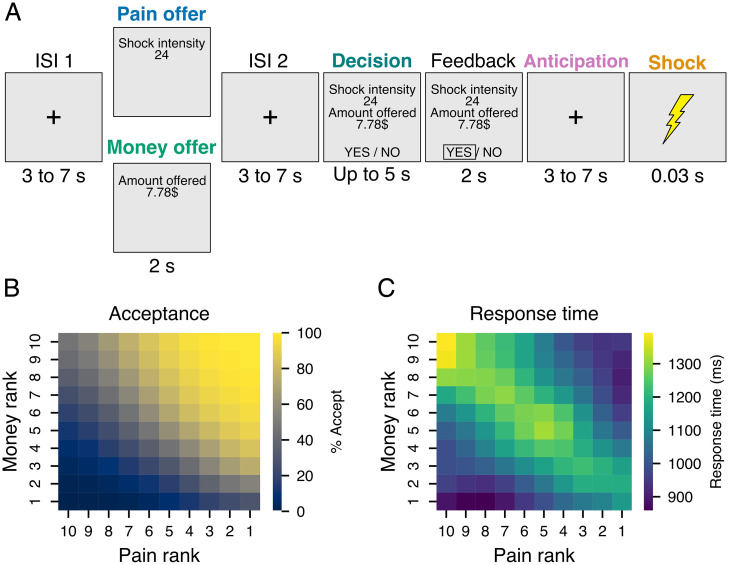
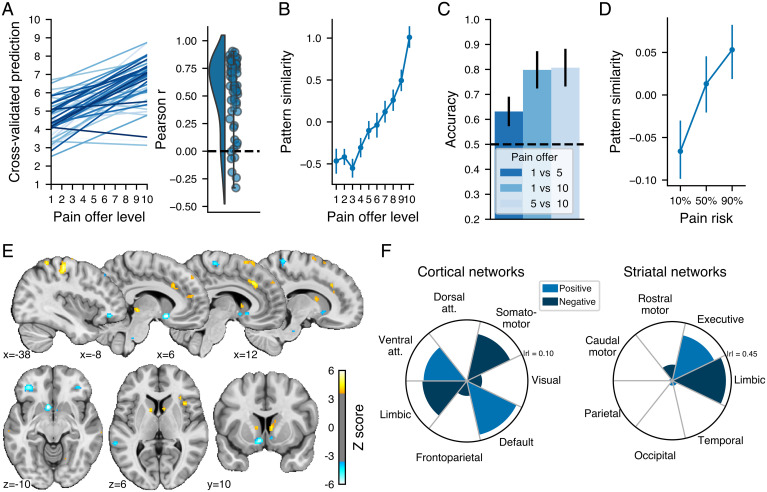
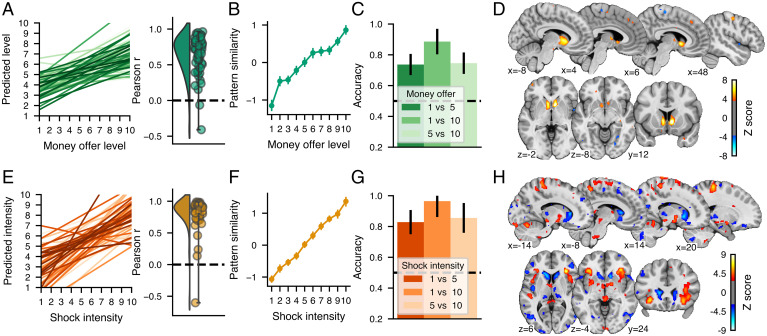
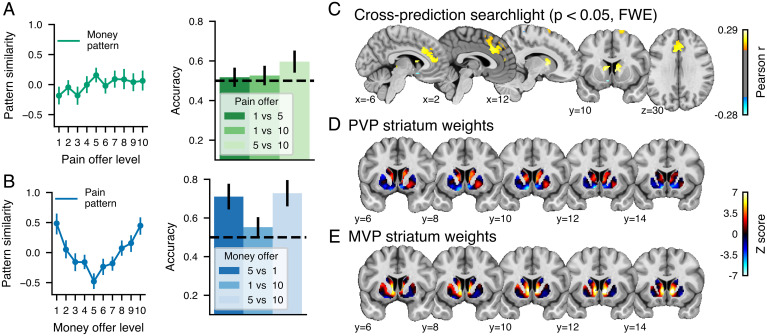
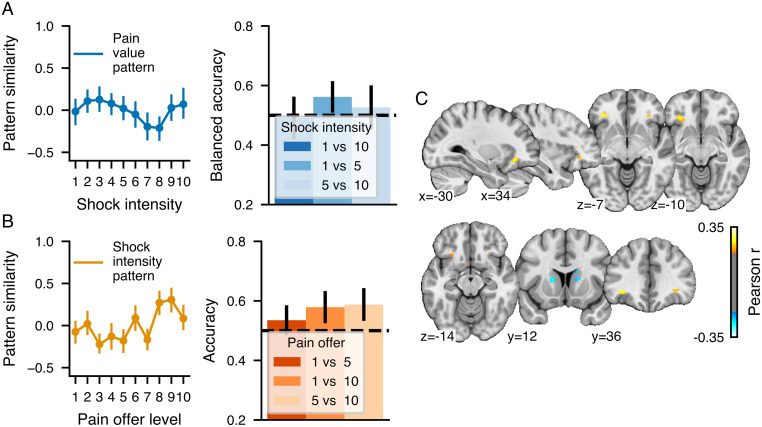
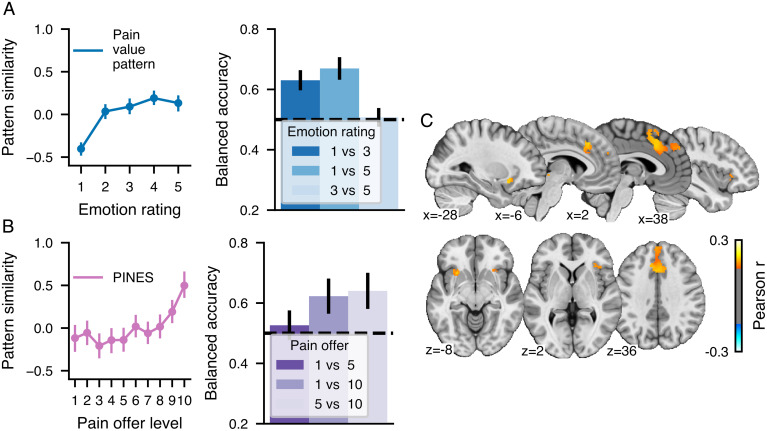
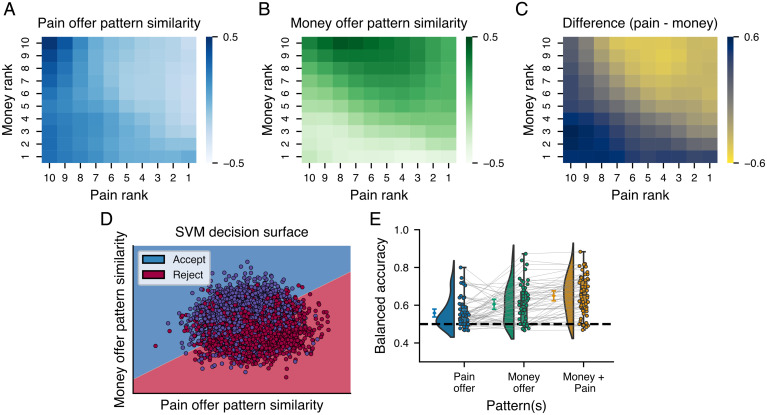
Pain is a primary driver of action. We often must voluntarily accept pain to gain rewards. Conversely, we may sometimes forego potential rewards to avoid associated pain. In this study, we investigated how the brain represents the decision value of future pain. Participants (n = 57) performed an economic decision task, choosing to accept or reject offers combining various amounts of pain and money presented visually. Functional MRI (fMRI) was used to measure brain activity throughout the decision-making process. Using multivariate pattern analyses, we identified a distributed neural representation predicting the intensity of the potential future pain in each decision and participants’ decisions to accept or avoid pain. This neural representation of the decision value of future pain included negative weights located in areas related to the valuation of rewards and positive weights in regions associated with saliency, negative affect, executive control, and goal-directed action. We further compared this representation to future monetary rewards, physical pain, and aversive pictures and found that the representation of future pain overlaps with that of aversive pictures but is distinct from experienced pain. Altogether, the findings of this study provide insights on the valuation processes of future pain and have broad potential implications for our understanding of disorders characterized by difficulties in balancing potential threats and rewards.
Keywords: MVPA; decision-making; pain; reward; value.
Conflict of interest statement
The authors declare no competing interest.
Figures
Similar articles
-
Enhanced Neural Responses to Imagined Primary Rewards Predict Reduced Monetary Temporal Discounting.J Neurosci. 2015 Sep 23;35(38):13103-9. doi: 10.1523/JNEUROSCI.1863-15.2015. J Neurosci. 2015. PMID: 26400940 Free PMC article.
-
Frontal, Striatal, and Medial Temporal Sensitivity to Value Distinguishes Risk-Taking from Risk-Aversive Older Adults during Decision Making.J Neurosci. 2016 Dec 7;36(49):12498-12509. doi: 10.1523/JNEUROSCI.1386-16.2016. J Neurosci. 2016. PMID: 27927964 Free PMC article.
-
The Neural Basis of Aversive Pavlovian Guidance during Planning.J Neurosci. 2017 Oct 18;37(42):10215-10229. doi: 10.1523/JNEUROSCI.0085-17.2017. Epub 2017 Sep 18. J Neurosci. 2017. PMID: 28924006 Free PMC article.
-
The alcoholic brain: neural bases of impaired reward-based decision-making in alcohol use disorders.Neurol Sci. 2018 Mar;39(3):423-435. doi: 10.1007/s10072-017-3205-1. Epub 2017 Nov 29. Neurol Sci. 2018. PMID: 29188399 Review.
-
The neural basis of effort valuation: A meta-analysis of functional magnetic resonance imaging studies.Neurosci Biobehav Rev. 2021 Dec;131:1275-1287. doi: 10.1016/j.neubiorev.2021.10.024. Epub 2021 Oct 25. Neurosci Biobehav Rev. 2021. PMID: 34710515 Review.
Cited by
-
Neural signatures of emotion regulation.Sci Rep. 2024 Jan 20;14(1):1775. doi: 10.1038/s41598-024-52203-3. Sci Rep. 2024. PMID: 38245590 Free PMC article.
-
A neural signature of social support mitigates negative emotion.Sci Rep. 2023 Oct 12;13(1):17293. doi: 10.1038/s41598-023-43273-w. Sci Rep. 2023. PMID: 37828064 Free PMC article.
-
Acute stress promotes effort mobilization for safety-related goals.Commun Psychol. 2024 Jun 1;2(1):50. doi: 10.1038/s44271-024-00103-7. Commun Psychol. 2024. PMID: 39242906 Free PMC article.
-
A distributed brain response predicting the facial expression of acute nociceptive pain.bioRxiv [Preprint]. 2024 May 30:2023.07.26.550504. doi: 10.1101/2023.07.26.550504. bioRxiv. 2024. Update in: Elife. 2024 Nov 11;12:RP87962. doi: 10.7554/eLife.87962. PMID: 37547018 Free PMC article. Updated. Preprint.
-
A distributed brain response predicting the facial expression of acute nociceptive pain.Elife. 2024 Nov 11;12:RP87962. doi: 10.7554/eLife.87962. Elife. 2024. PMID: 39526882 Free PMC article.
References
-
- Seymour B., Pain: A precision signal for reinforcement learning and control. Neuron 101, 1029–1041 (2019). - PubMed
-
- Crombez G., Eccleston C., Van Damme S., Vlaeyen J. W. S., Karoly P., Fear-avoidance model of chronic pain: The next generation. Clin. J. Pain 28, 475–483 (2012). - PubMed
-
- Knutson B., Huettel S. A., The risk matrix. Curr. Opin. Behav. Sci. 5, 141–146 (2015).
Publication types
MeSH terms
Grants and funding
LinkOut - more resources
Full Text Sources
Medical
