. 2022 Aug 5;12(8):1922-1941.
doi: 10.1158/2159-8290.CD-21-1566.

BCL10 Mutations Define Distinct Dependencies Guiding Precision Therapy for DLBCL

Affiliations

BCL10 Mutations Define Distinct Dependencies Guiding Precision Therapy for DLBCL

Min Xia et al. Cancer Discov. .

Abstract

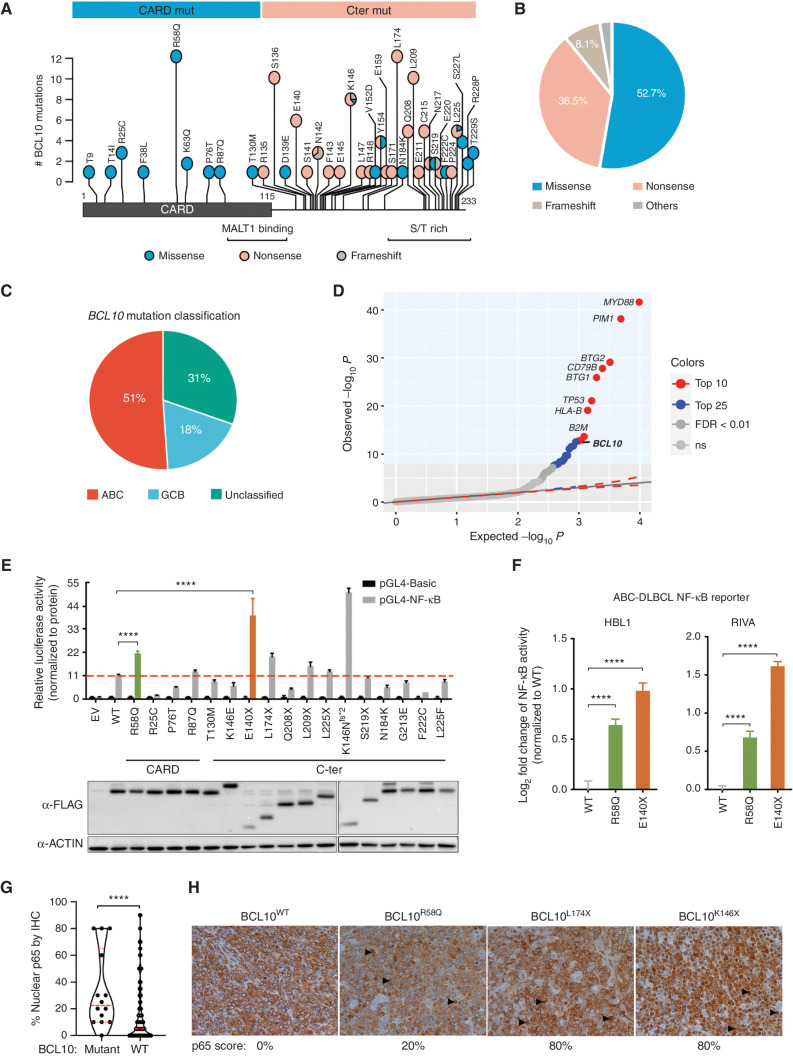
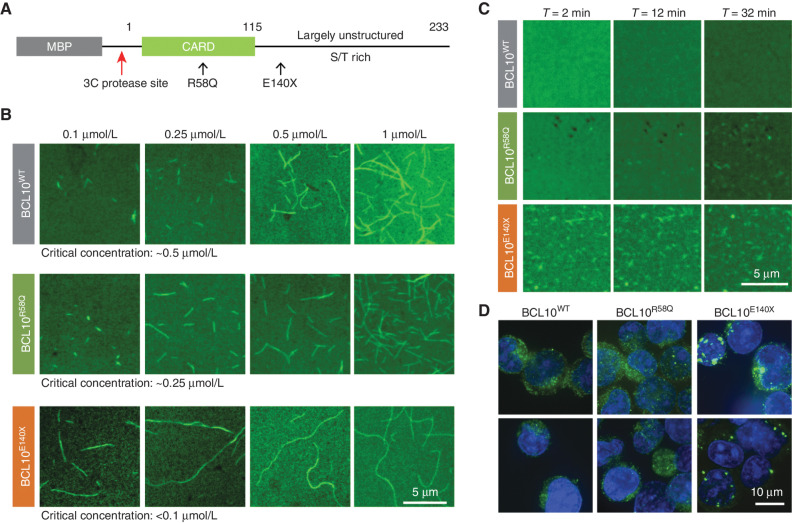
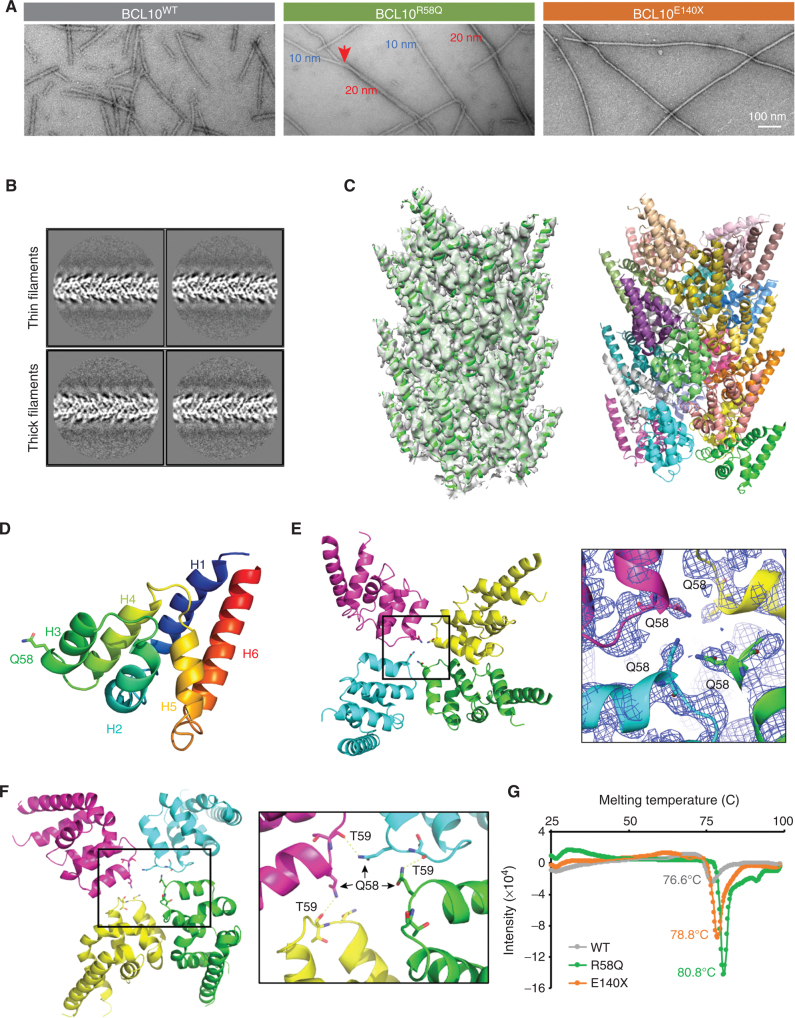
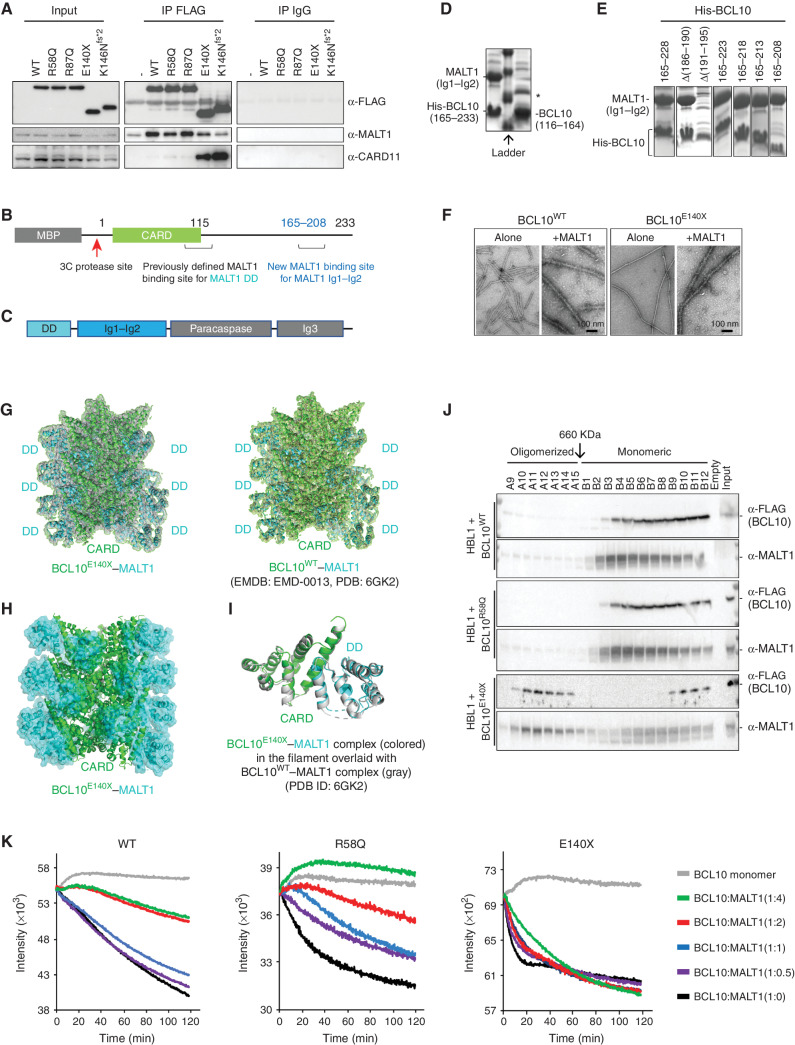
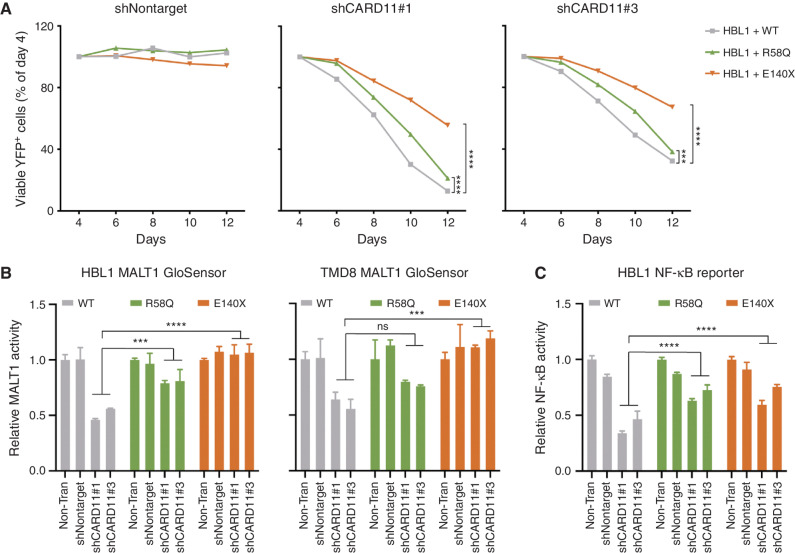
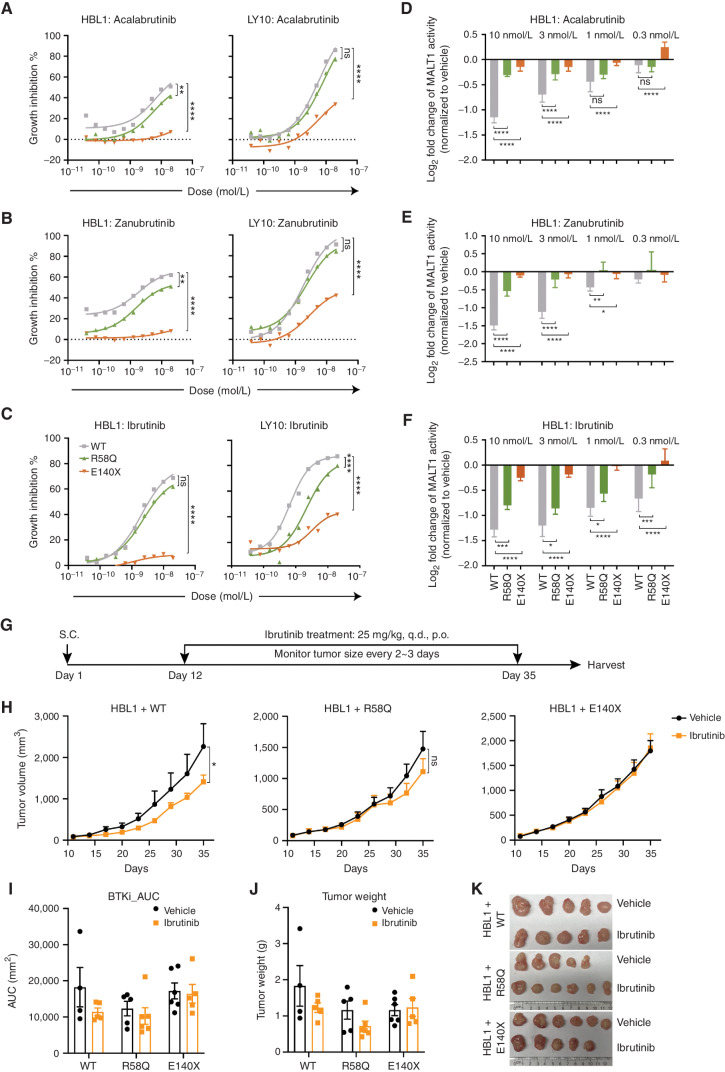
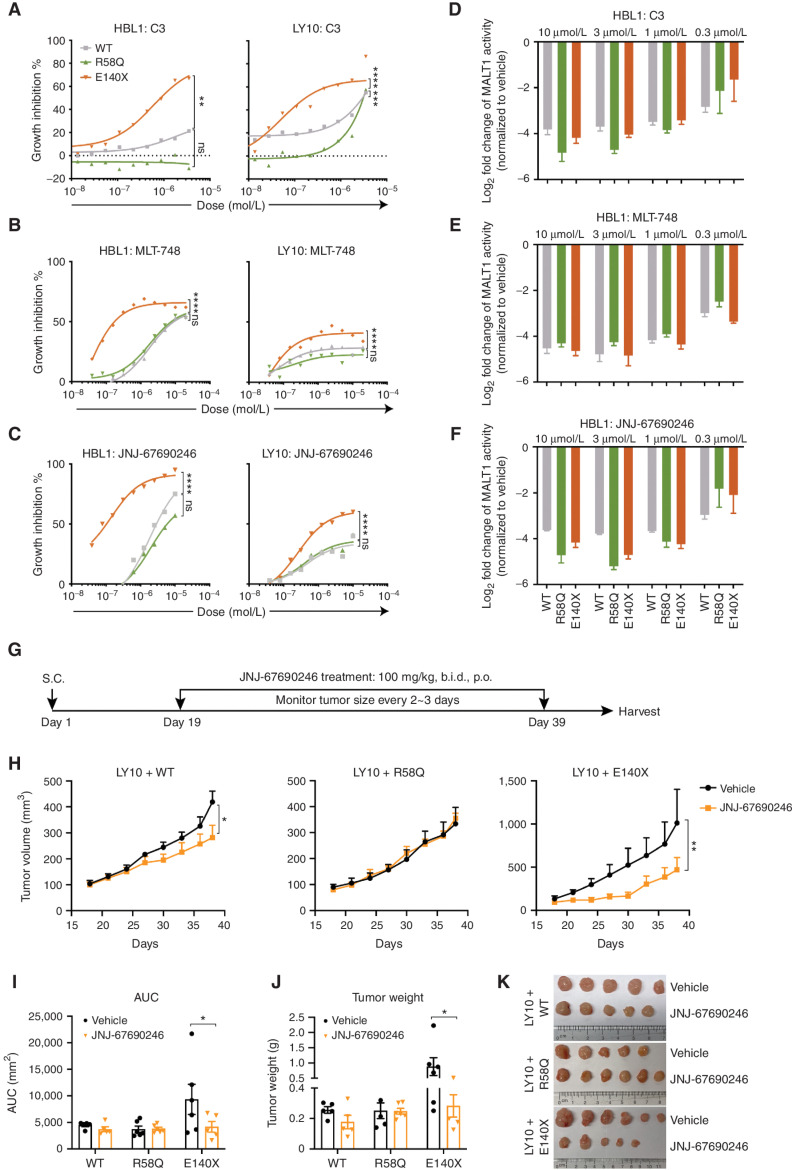
Activated B cell-like diffuse large B-cell lymphomas (ABC-DLBCL) have unfavorable outcomes and chronic activation of CARD11-BCL10-MALT1 (CBM) signal amplification complexes that form due to polymerization of BCL10 subunits, which is affected by recurrent somatic mutations in ABC-DLBCLs. Herein, we show that BCL10 mutants fall into at least two functionally distinct classes: missense mutations of the BCL10 CARD domain and truncation of its C-terminal tail. Truncating mutations abrogated a motif through which MALT1 inhibits BCL10 polymerization, trapping MALT1 in its activated filament-bound state. CARD missense mutations enhanced BCL10 filament formation, forming glutamine network structures that stabilize BCL10 filaments. Mutant forms of BCL10 were less dependent on upstream CARD11 activation and thus manifested resistance to BTK inhibitors, whereas BCL10 truncating but not CARD mutants were hypersensitive to MALT1 inhibitors. Therefore, BCL10 mutations are potential biomarkers for BTK inhibitor resistance in ABC-DLBCL, and further precision can be achieved by selecting therapy based on specific biochemical effects of distinct mutation classes.

Significance: ABC-DLBCLs feature frequent mutations of signaling mediators that converge on the CBM complex. We use structure-function approaches to reveal that BCL10 mutations fall into two distinct biochemical classes. Both classes confer resistance to BTK inhibitors, whereas BCL10 truncations confer hyperresponsiveness to MALT1 inhibitors, providing a road map for precision therapies in ABC-DLBCLs. See related commentary by Phelan and Oellerich, p. 1844. This article is highlighted in the In This Issue feature, p. 1825.


Figures

Figure 1.
Figure 1.
Characterization of human BCL10 mutations in DLBCL. A, BCL10 protein domain and the locations of all BCL10 mutations in DLBCL identified and reported from the literature and open databases. S/T, serine/threonine. B, Proportion of mutation types among patients with BCL10 mutations. C, Cell-of-origin classification of DLBCL patients with BCL10 mutations. D, Quantile–quantile plot showing the P values for BCL10 single-nucleotide variants across 243 patients with ABC-DLBCL. E, NF-κB activity measured by NF-κB-RE luciferase reporter 24 hours after transfection of different BCL10 mutations into 293T cells. Luciferase activity was normalized to the expression level of each mutation. EV, empty vector. β-Actin was used as an internal control. ****, P < 0.0001. F, NF-κB reporter activity in lymphoma cells expressing mutations. ****, P < 0.0001. G, Statistical comparison of nuclear p65 staining scores between BCL10 WT and BCL10-mutant tumors in tissue microarray for patients with DLBCL (n = 298). ****, Mann–Whitney P < 0.0001. H, Representative images of p65 IHC staining in BCL10 WT and BCL10-mutant DLBCLs in G. Images were taken under magnification of 400×. Black arrowheads point to examples of p65 nuclear staining.
Figure 2.
Figure 2.
Representative missense and truncating mutant BCL10 enabled a faster polarization rate. A, Domain organization of the MBP-BCL10 construct. S/T, serine/threonine. B, Critical concentration determination of WT, E140X, and R58Q based on confocal images of BCL10 filaments formed at a concentration range between 0.1 and 1 μmol/L, imaged 4 hours after MBP cleavage. C, Confocal time lapse of WT, E140X, and R58Q imaged at 1 μmol/L for 30 minutes. E140X exhibits the fastest polymerization rate in comparison with WT and R58Q. D, Confocal images of HBL1 cells stably expressing FLAG-tagged WT, E140X, and R58Q, visualized by IF for BCL10 and DNA (Hoechst dye, blue).
Figure 3.
Figure 3.
Cryo-EM structure of the BCL10R58Q filament. A, Negative stained EM micrographs of WT, R58Q, and E140X filaments. R58Q formed a mixture of thin (10 nmol/L) and thick (20 nmol/L) filaments, whereas E140X formed only thin filaments similar to WT. Scale bar, 100 nmol/L. B, Representative 2D classes of BCL10R58Q thin and thick filaments. C, Cryo-EM structure of BCL10R58Q at 4.6 Å. Left, BCL10R58Q filament fitted into the cryo-EM map. Right, BCL10R58Q 16-mer filament in which each subunit is colored differently. D, BCL10R58Q monomer. 58Q residue is labeled as stick. E, BCL10R58Q layer, showing 58Q residues facing one another for stabilizing type III intrastrand interface (left). Zoom-in view of BCL10 Q58 fitted into cryo-EM density (right). F, Potential hydrogen bonding network formed by the Q58 side chain of one protomer and the carbonyl oxygen of T59 from the next protomer in the helical spiral, shown on four consecutive R58Q subunits in the filament (left), and as a zoom-in view (right). These interactions stabilize the type III intrastrand interface. G, Filament thermal stability assay performed by thermal shift assay for WT, E140X, and R58Q purified filaments. E140X and R58Q filaments showed a significant shift in 2.1°C and 4.2°C, respectively, in comparison with WT filaments.
Figure 4.
Figure 4.
Cryo-EM structure of the BCL10E140X filament. A, Immunoblot analysis of BCL10 interactors performed by coimmunoprecipitating with anti-FLAG antibody in Raji cells overexpressing either FLAG-BCL10WT or FLAG-BCL10mutant protein. Samples were blotted for anti-FLAG, anti-MALT1, and anti-CARD11. Input was loaded with 1% of total cell lysate used for immunoprecipitation (IP). Anti-IgG antibody was used as a negative control for coimmunoprecipitation. B, Domain organization of the MBP-human BCL10 construct mapped with MALT1 previously defined and new binding sites. C, Domain organization of the human MALT1 construct. D, SDS-PAGE of MALT1 (Ig1–Ig2) pulldown by His-tagged BCL10 (165–233; left) and His-tagged BCL10 (116–164; right). *, A contaminant. E, SDS-PAGE of MALT1 (Ig1–Ig2) pulldown by different truncations of His-tagged BCL10. F, Negative stained EM micrographs of purified BCL10 WT filaments alone and with MALT1 (left) in comparison with BCL10E140X filaments alone and with MALT1 filaments (right) resulted in similar filaments. G, Cryo-EM structure of BCL10E140X–MALT1 DD filament at 4.3 Å fitted into the cryo-EM density map (left). The 4.3 Å structure is similar to the previously published BCL10WT CARD-MALT1 DD structure at 4.9 Å (right). However, BCL10E140X–MALT1 DD shows improved density for the MALT1 DD domain. EMDB, Electron Microscopy Data Bank; PDB, Protein Data Bank. H, Cryo-EM structure of BCL10E140X CARD and MALT1 DD (cyan) filament, emphasizing EM density for MALT1 DD. I, Monomeric BCL10E140X CARD–MALT1 DD (cyan) align to published monomeric BCL10WT CARD–MALT1 DD. J, Western blot for gel filtration fractions from HBL1 cells stably expressing FLAG-tagged BCL10 WT, R58Q and E140X. Different fractions were blotted with anti-FLAG and anti-MALT1 antibodies. BCL10E140X formed highly ordered oligomers migrating together with MALT1. K, MALT1 inhibits BCL10 filament formation through the BCL10 C-terminal binding site. Quenching polymerization was measured for purified Alexa488-labeled BCL10 WT, E140X, and R58Q at 3 μmol/L in the presence of increasing amounts of MALT1 (0, 1.5, 3, 6, and 12 μmol/L). The assay was initiated upon the addition of the 3C protease in order to remove the MBP tag from BCL10 WT, E140X, and R58Q for allowing filament polymerization. Quenching was monitored for 2 hours with 30-second intervals using a Neo BioTek plate reader and performed with three biological replicates. Titration of increasing doses of MALT1 suppressed filament polymerization of fluorescently labeled BCL10 WT and R58Q. However, increasing doses of MALT1 had very little effect on E140X filament polymerization.
Figure 5.
Figure 5.
BCL10 mutations are less dependent on upstream CARD11. A, Viability of HBL1 lymphoma cell lines transduced to express shRNA targeting CARD11 with two independent hairpins or nontargeting control. The indicated lines stably expressing WT and mutant BCL10 were transduced with lentiviruses expressing CARD11 shRNA along with YFP. The relative number of YFP+ live cells was plotted by normalizing them to day 4 (the YFP+ peak). ***, P < 0.001; ****, P < 0.0001. B, MALT1 activity using the MALT1 GloSensor reporter cells with CARD11 knockdown. The indicated MALT1 GloSensor cell lines were stably expressing WT and mutant BCL10, and then transduced with lentiviruses expressing nontargeting or two independent CARD11 hairpins coexpressing a YFP reporter. At day 4, cells were harvested for a MALT1 activity assay. Error bars, SEM with four biological replicates. ***, P < 0.001; ****, P < 0.0001; ns, not significant. C, NF-κB activity in lymphoma reporter cells with shCARD11. The HBL1 NF-κB reporter cells were stably expressing WT and mutant BCL10, and then transduced with lentiviruses expressing nontargeting or two independent CARD11 hairpins coexpressing a YFP reporter. NF-κB activity was measured 72 hours posttransduction. Error bars, SEM with four biological replicates. ****, P < 0.0001.
Figure 6.
Figure 6.
BCL10 gain-of-function mutant lymphomas are resistant to upstream BTK inhibitors. A–C, A growth inhibition assay of lymphoma cells expressing WT or mutant BCL10 in response to BTK inhibitors. X-axis, concentration of compound (mol/L); y-axis, inhibition of cell growth normalized to vehicle-treated cells.**, P < 0.01; ****, P < 0.0001; ns, not significant. D–F, Luciferase activity measured in the MALT1 GloSensor reporter cell lines with BTK inhibitor treatment. Indicated MALT1 GloSensor reporter lines were stably expressing WT and mutant BCL10, and then treated with BTK inhibitors of different ranges (10–0.3 nmol/L). NF-κB activity was performed 24 hours after treatment. Error bars, SEM with four biological replicates. *, P < 0.05; **, P < 0.01; ***, P < 0.001; ****, P < 0.0001; ns, not significant. G, Experimental design of xenografts with ibrutinib treatment. p.o., orally; q.d., every day; S.C., subcutaneous. H, Tumor growth curve for xenografts of HBL1 cells expressing WT and mutant BCL10 treated with vehicle and ibrutinib (n = 5–6/group). Mice were treated orally with 25 mg/kg ibrutinib once per day for 24 consecutive days. *, P < 0.05; ns, not significant. I, Analysis of area under the curve (AUC) in H. AUC was calculated with Prism. BTKi, BTK inhibitor. J, Tumor weight measured at the endpoint. K, Representative photos of tumors harvested at the endpoint.
Figure 7.
Figure 7.
BCL10 truncating mutant lymphomas are hypersensitive to MALT1 protease inhibitors. A–C, A growth inhibition assay of lymphoma cells expressing WT or mutant BCL10 in response to MALT1 inhibitors. X-axis, concentration of compound (mol/L); y-axis, inhibition of cell growth normalized to vehicle-treated cells. **, P < 0.01; ***, P < 0.001; ****, P < 0.0001; ns, not significant. D–F, Luciferase activity measured in the MALT1 GloSensor reporter cell lines with MALT1 inhibitor treatment. Indicated MALT1 GloSensor reporter lines were stably expressing wild-type and mutant BCL10, and then treated with MALT1 inhibitors of different ranges (10–0.3 μmol/L). NF-κB activity was performed 24 hours after treatment. Error bars, SEM with four biological replicates. G, Experimental design of xenografts with JNJ-67690246 treatment. b.i.d., twice per day; p.o., orally; S.C., subcutaneous. H, Tumor growth curve for xenografts of HBL1 cells expressing WT and mutant BCL10 treated with vehicle and JNJ-67690246 (n = 3–6/group). Mice were treated orally with 100 mg/kg twice per day for 19 consecutive days. *, P < 0.05; **, P < 0.01. I, Analysis of area under the curve (AUC) in H. AUC is calculated with Prism. *, P < 0.05. J, Tumor weight measured at the endpoint. *, P < 0.05. K, Representative photos of tumors harvested at the endpoint.

Comment in

References

    1. Thome M, Charton JE, Pelzer C, Hailfinger S. Antigen receptor signaling to NF-kappaB via CARMA1, BCL10, and MALT1. Cold Spring Harb Perspect Biol 2010;2:a003004. - PMC - PubMed
    1. Meininger I, Krappmann D. Lymphocyte signaling and activation by the CARMA1-BCL10-MALT1 signalosome. Biol Chem 2016;397:1315–33. - PubMed
    1. Juilland M, Thome M. Role of the CARMA1/BCL10/MALT1 complex in lymphoid malignancies. Curr Opin Hematol 2016;23:402–9. - PMC - PubMed
    1. Turvey SE, Durandy A, Fischer A, Fung SY, Geha RS, Gewies A, et al. . The CARD11-BCL10-MALT1 (CBM) signalosome complex: stepping into the limelight of human primary immunodeficiency. J Allergy Clin Immunol 2014;134:276–84. - PMC - PubMed
    1. Lamason RL, McCully RR, Lew SM, Pomerantz JL. Oncogenic CARD11 mutations induce hyperactive signaling by disrupting autoinhibition by the PKC-responsive inhibitory domain. Biochemistry 2010;49:8240–50. - PMC - PubMed

Publication types

MeSH terms

Substances