

Sex-specific differences in metabolic outcomes after sleeve gastrectomy and intermittent fasting in obese middle-aged mice
- PMID: 35658544
- PMCID: PMC9273270
- DOI: 10.1152/ajpendo.00017.2022
Sex-specific differences in metabolic outcomes after sleeve gastrectomy and intermittent fasting in obese middle-aged mice
Abstract
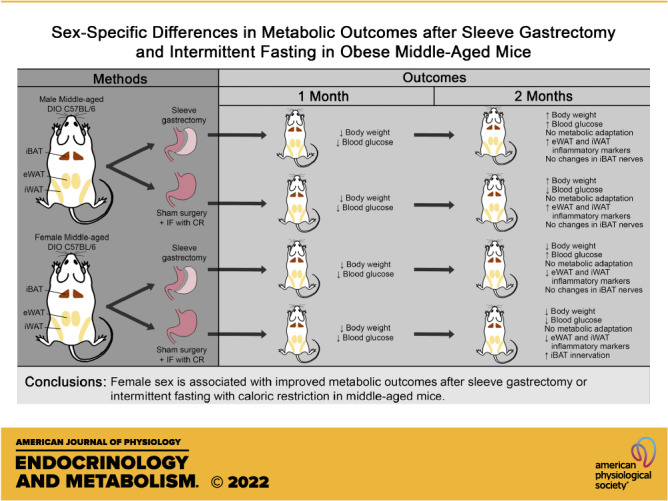
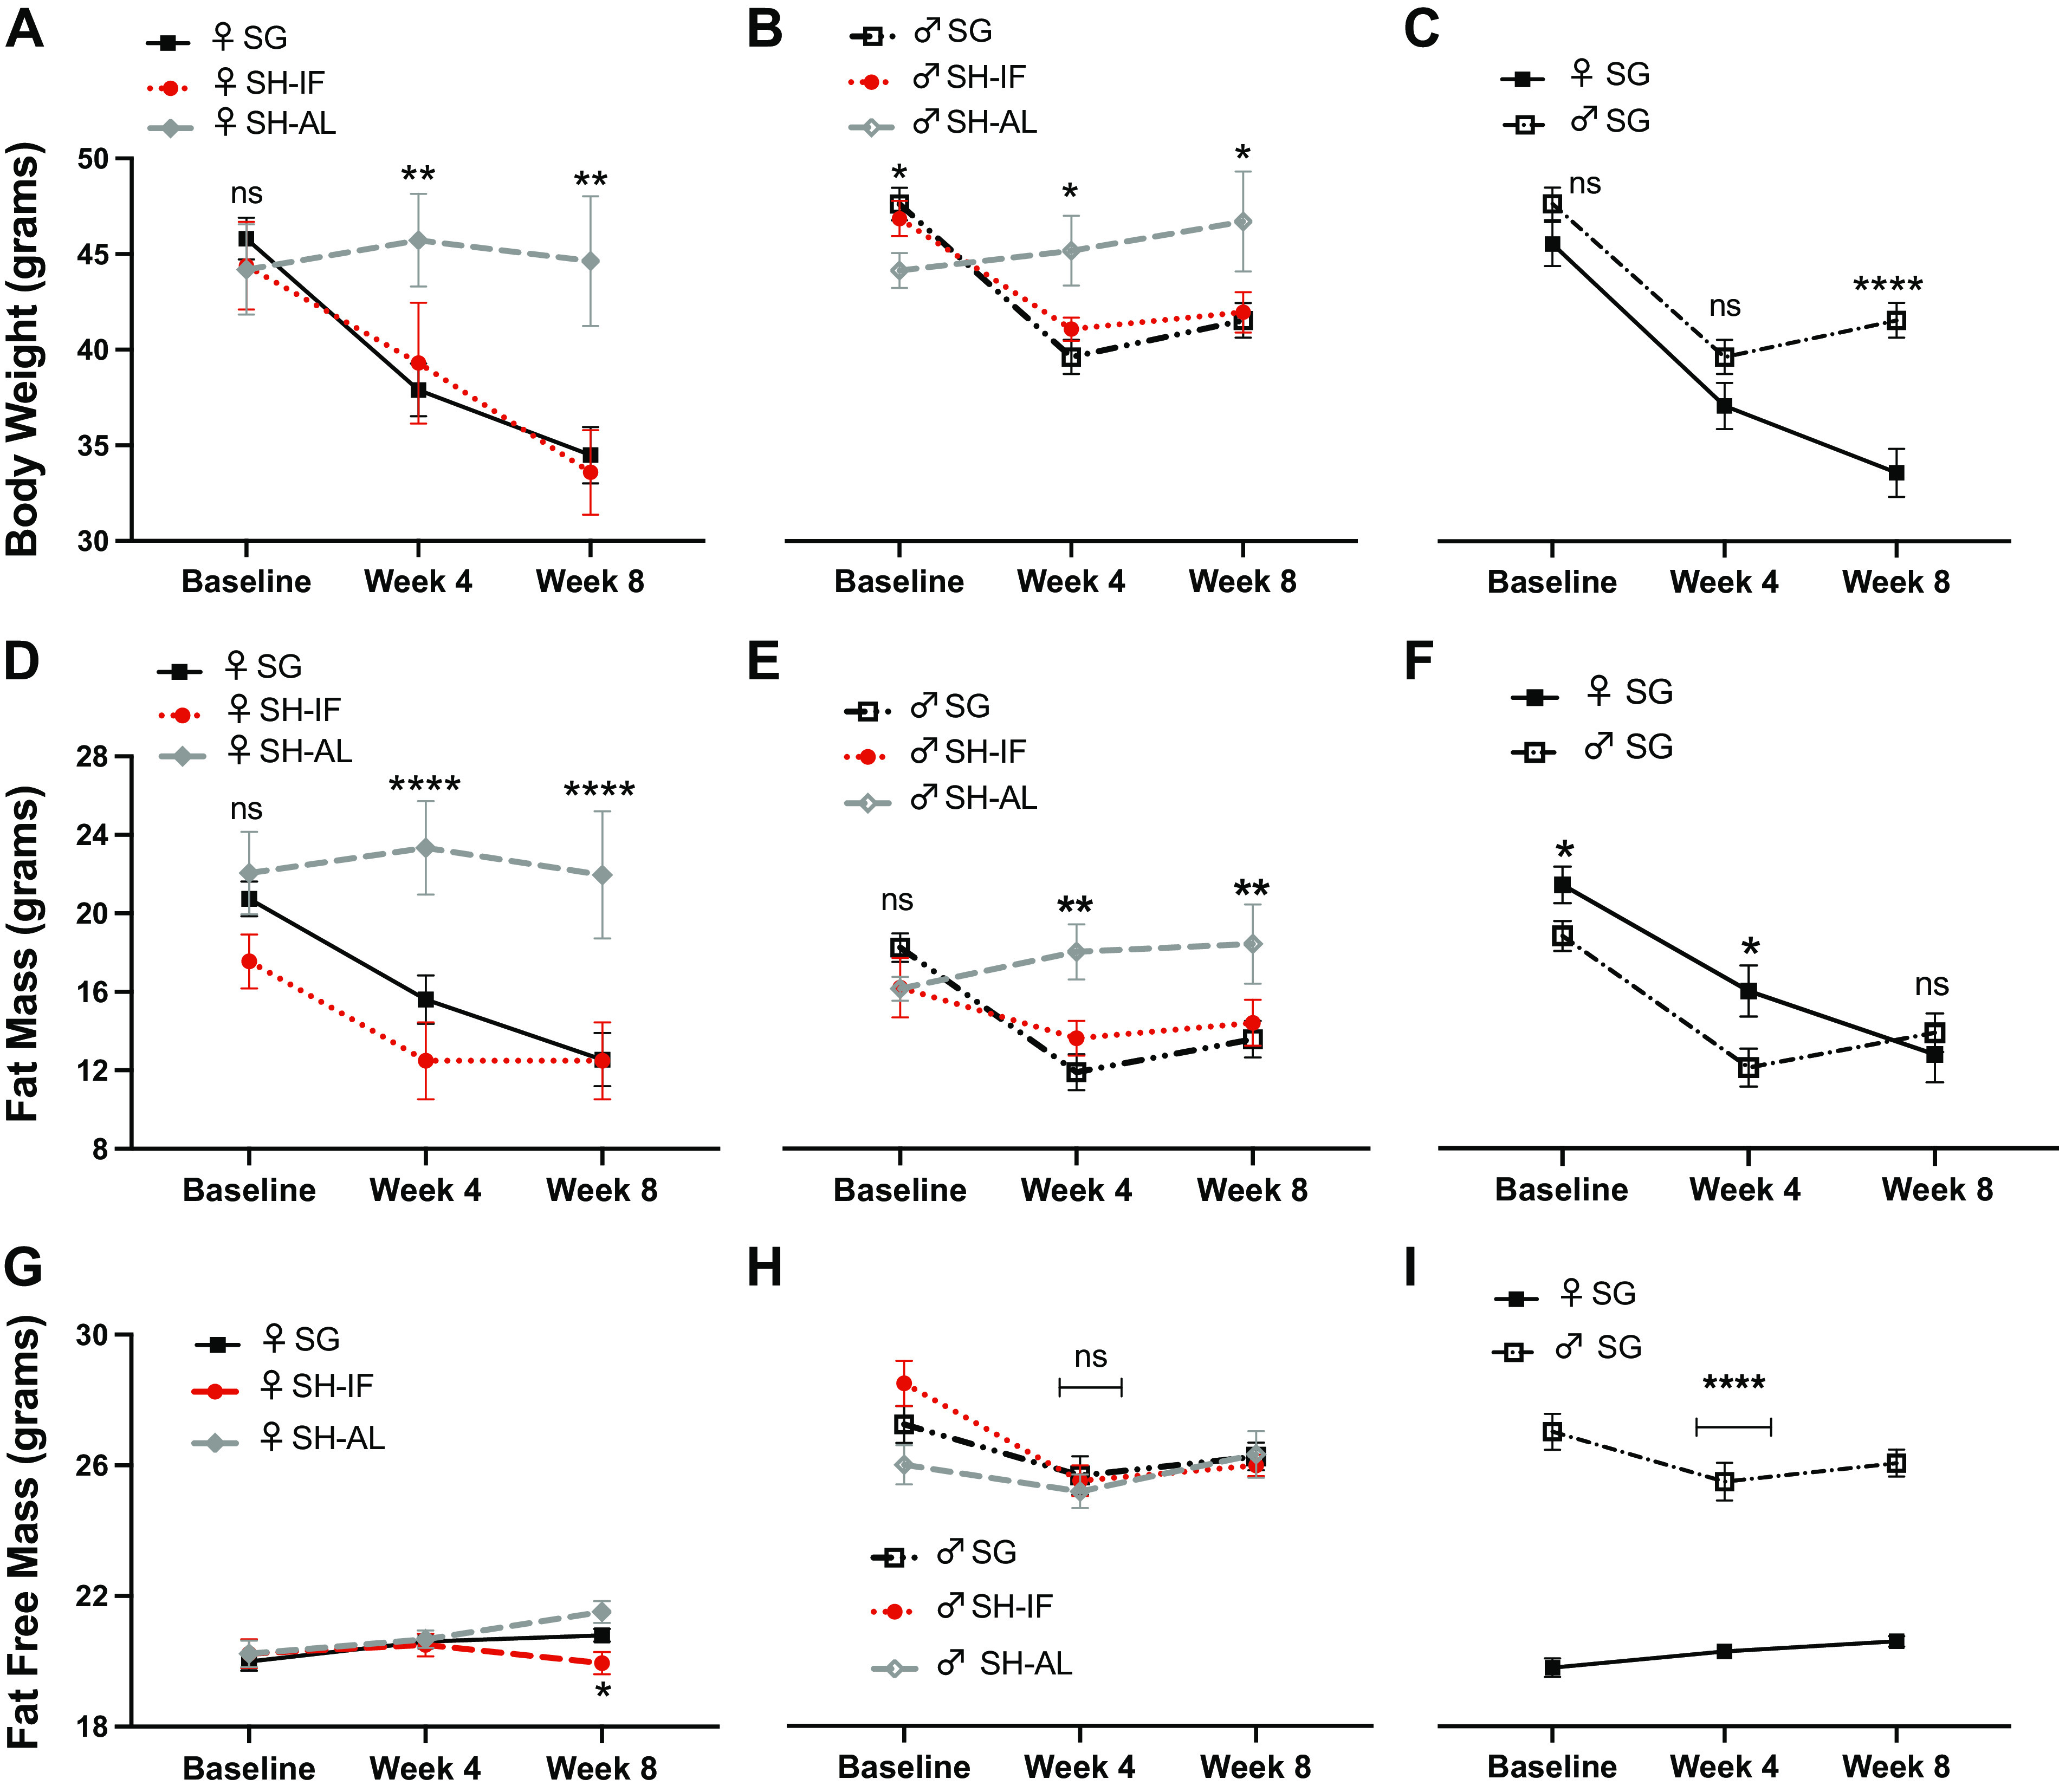
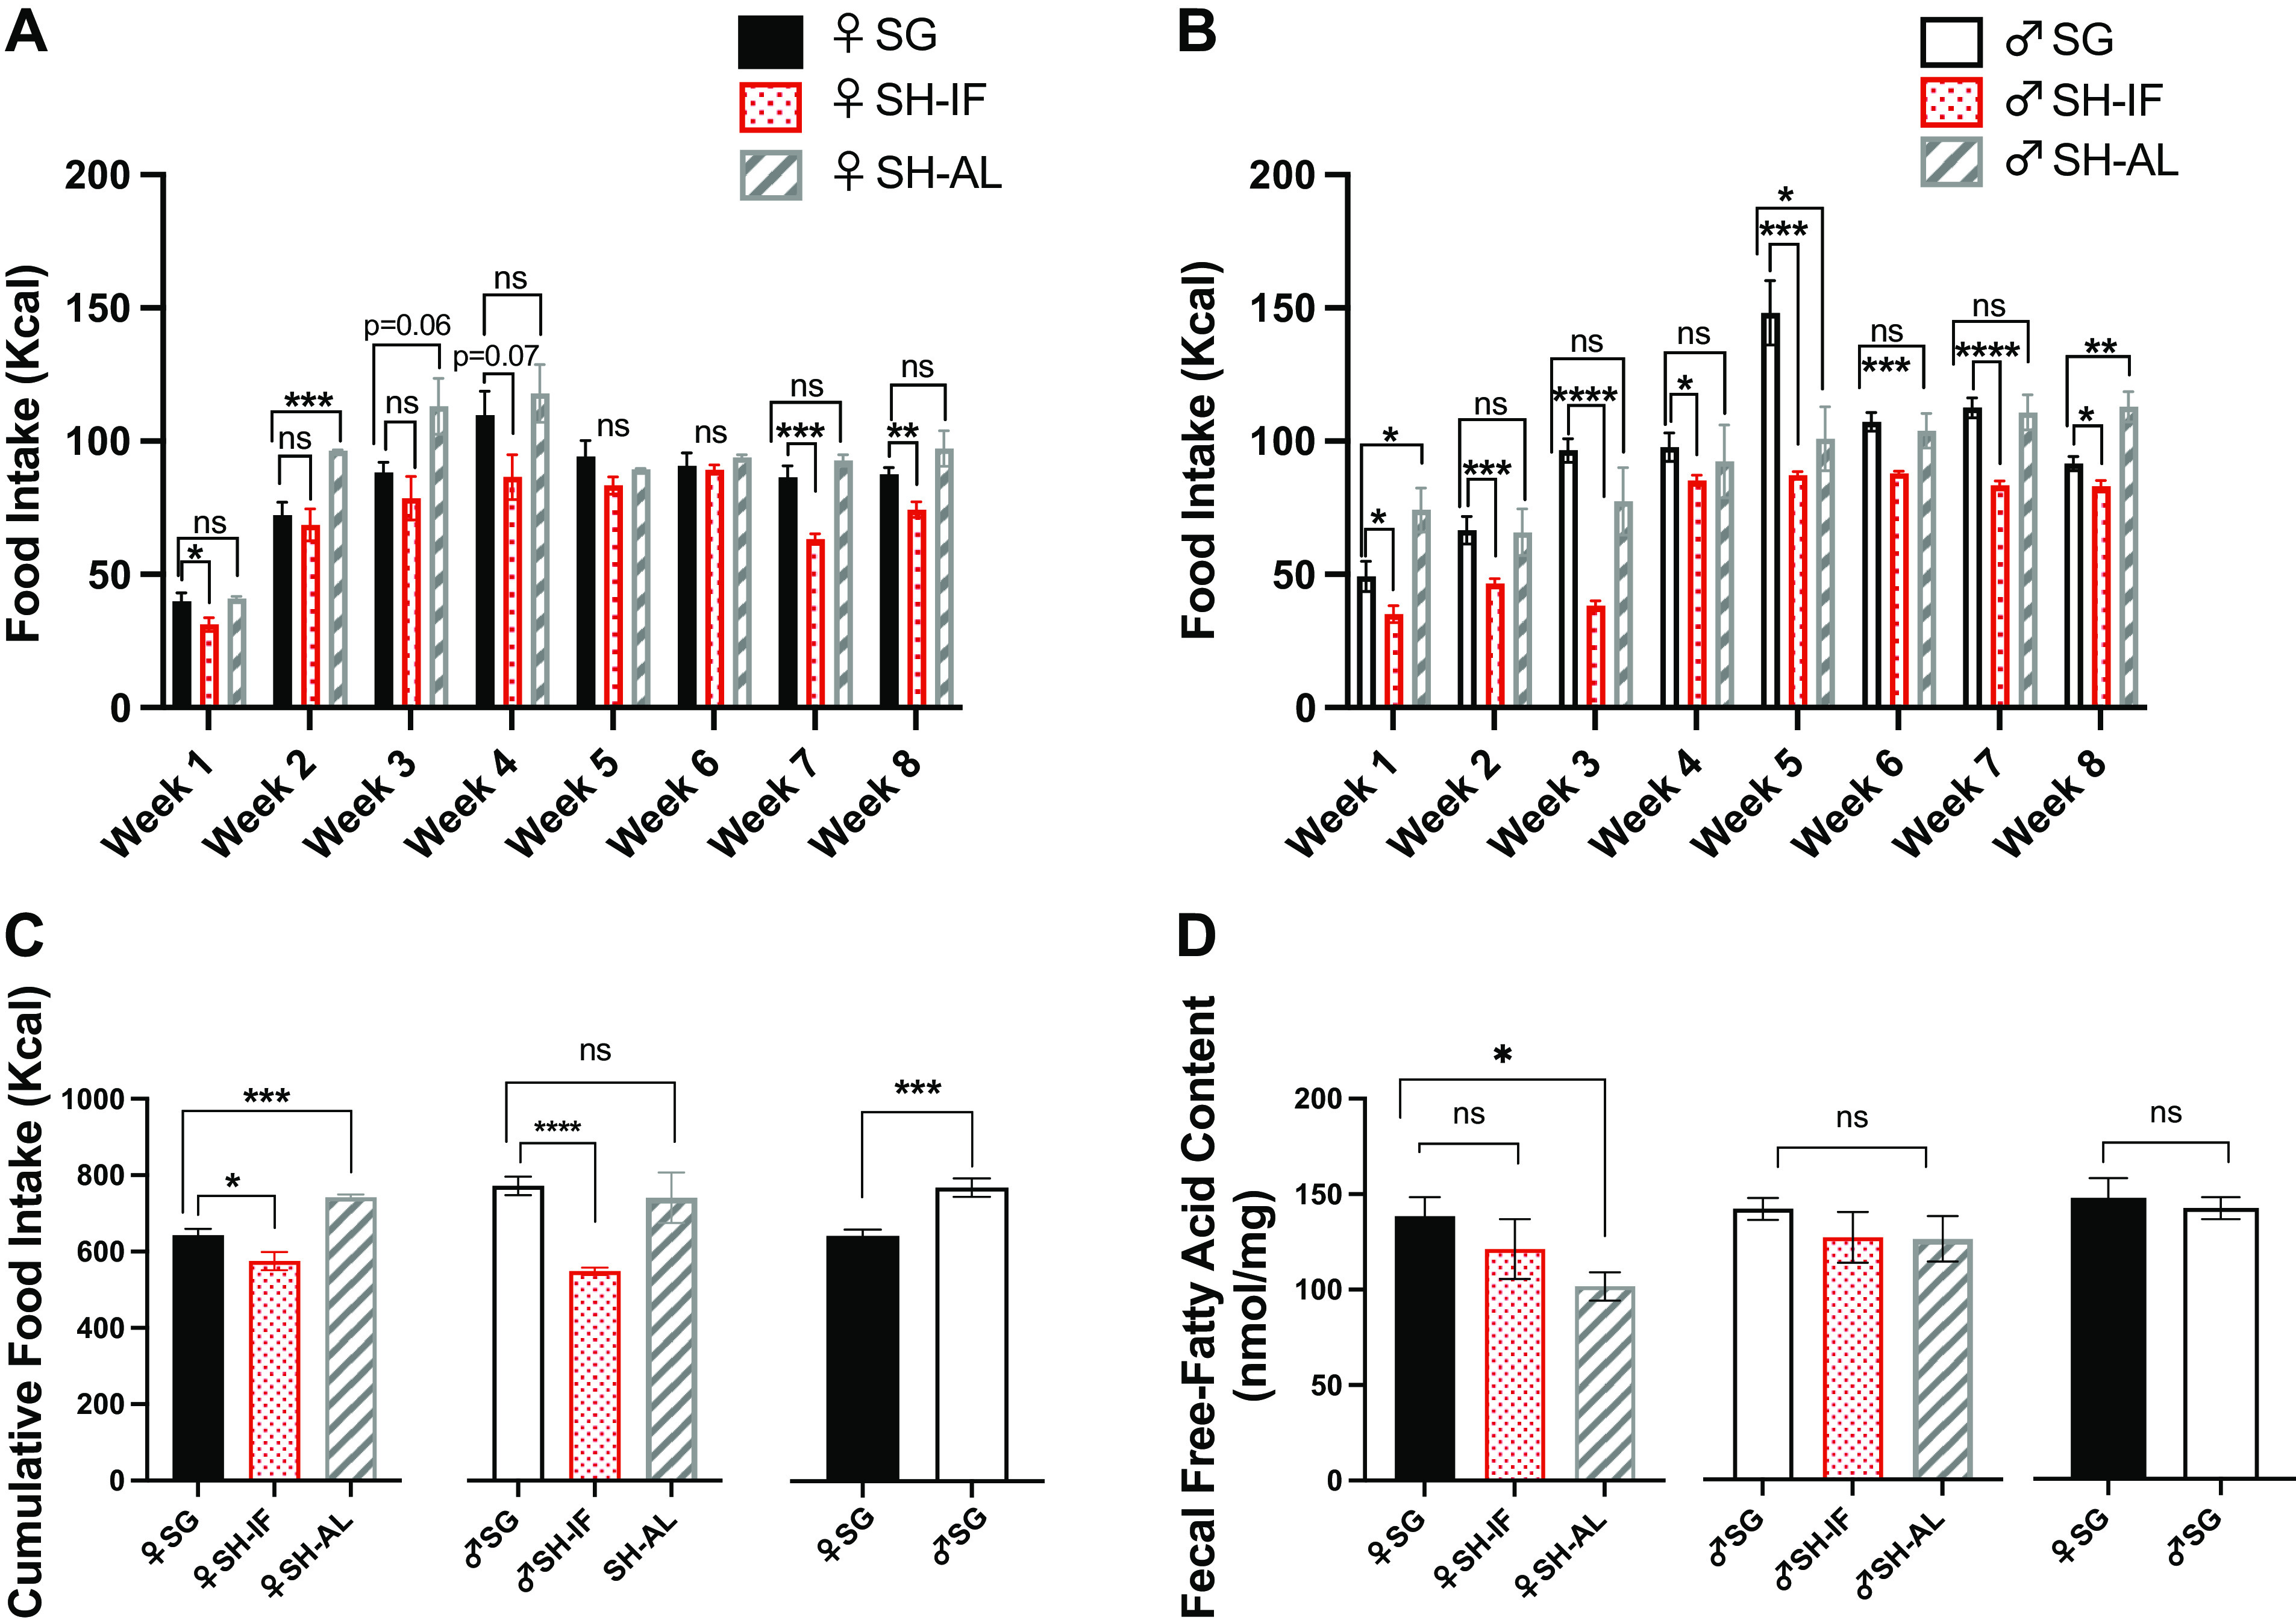
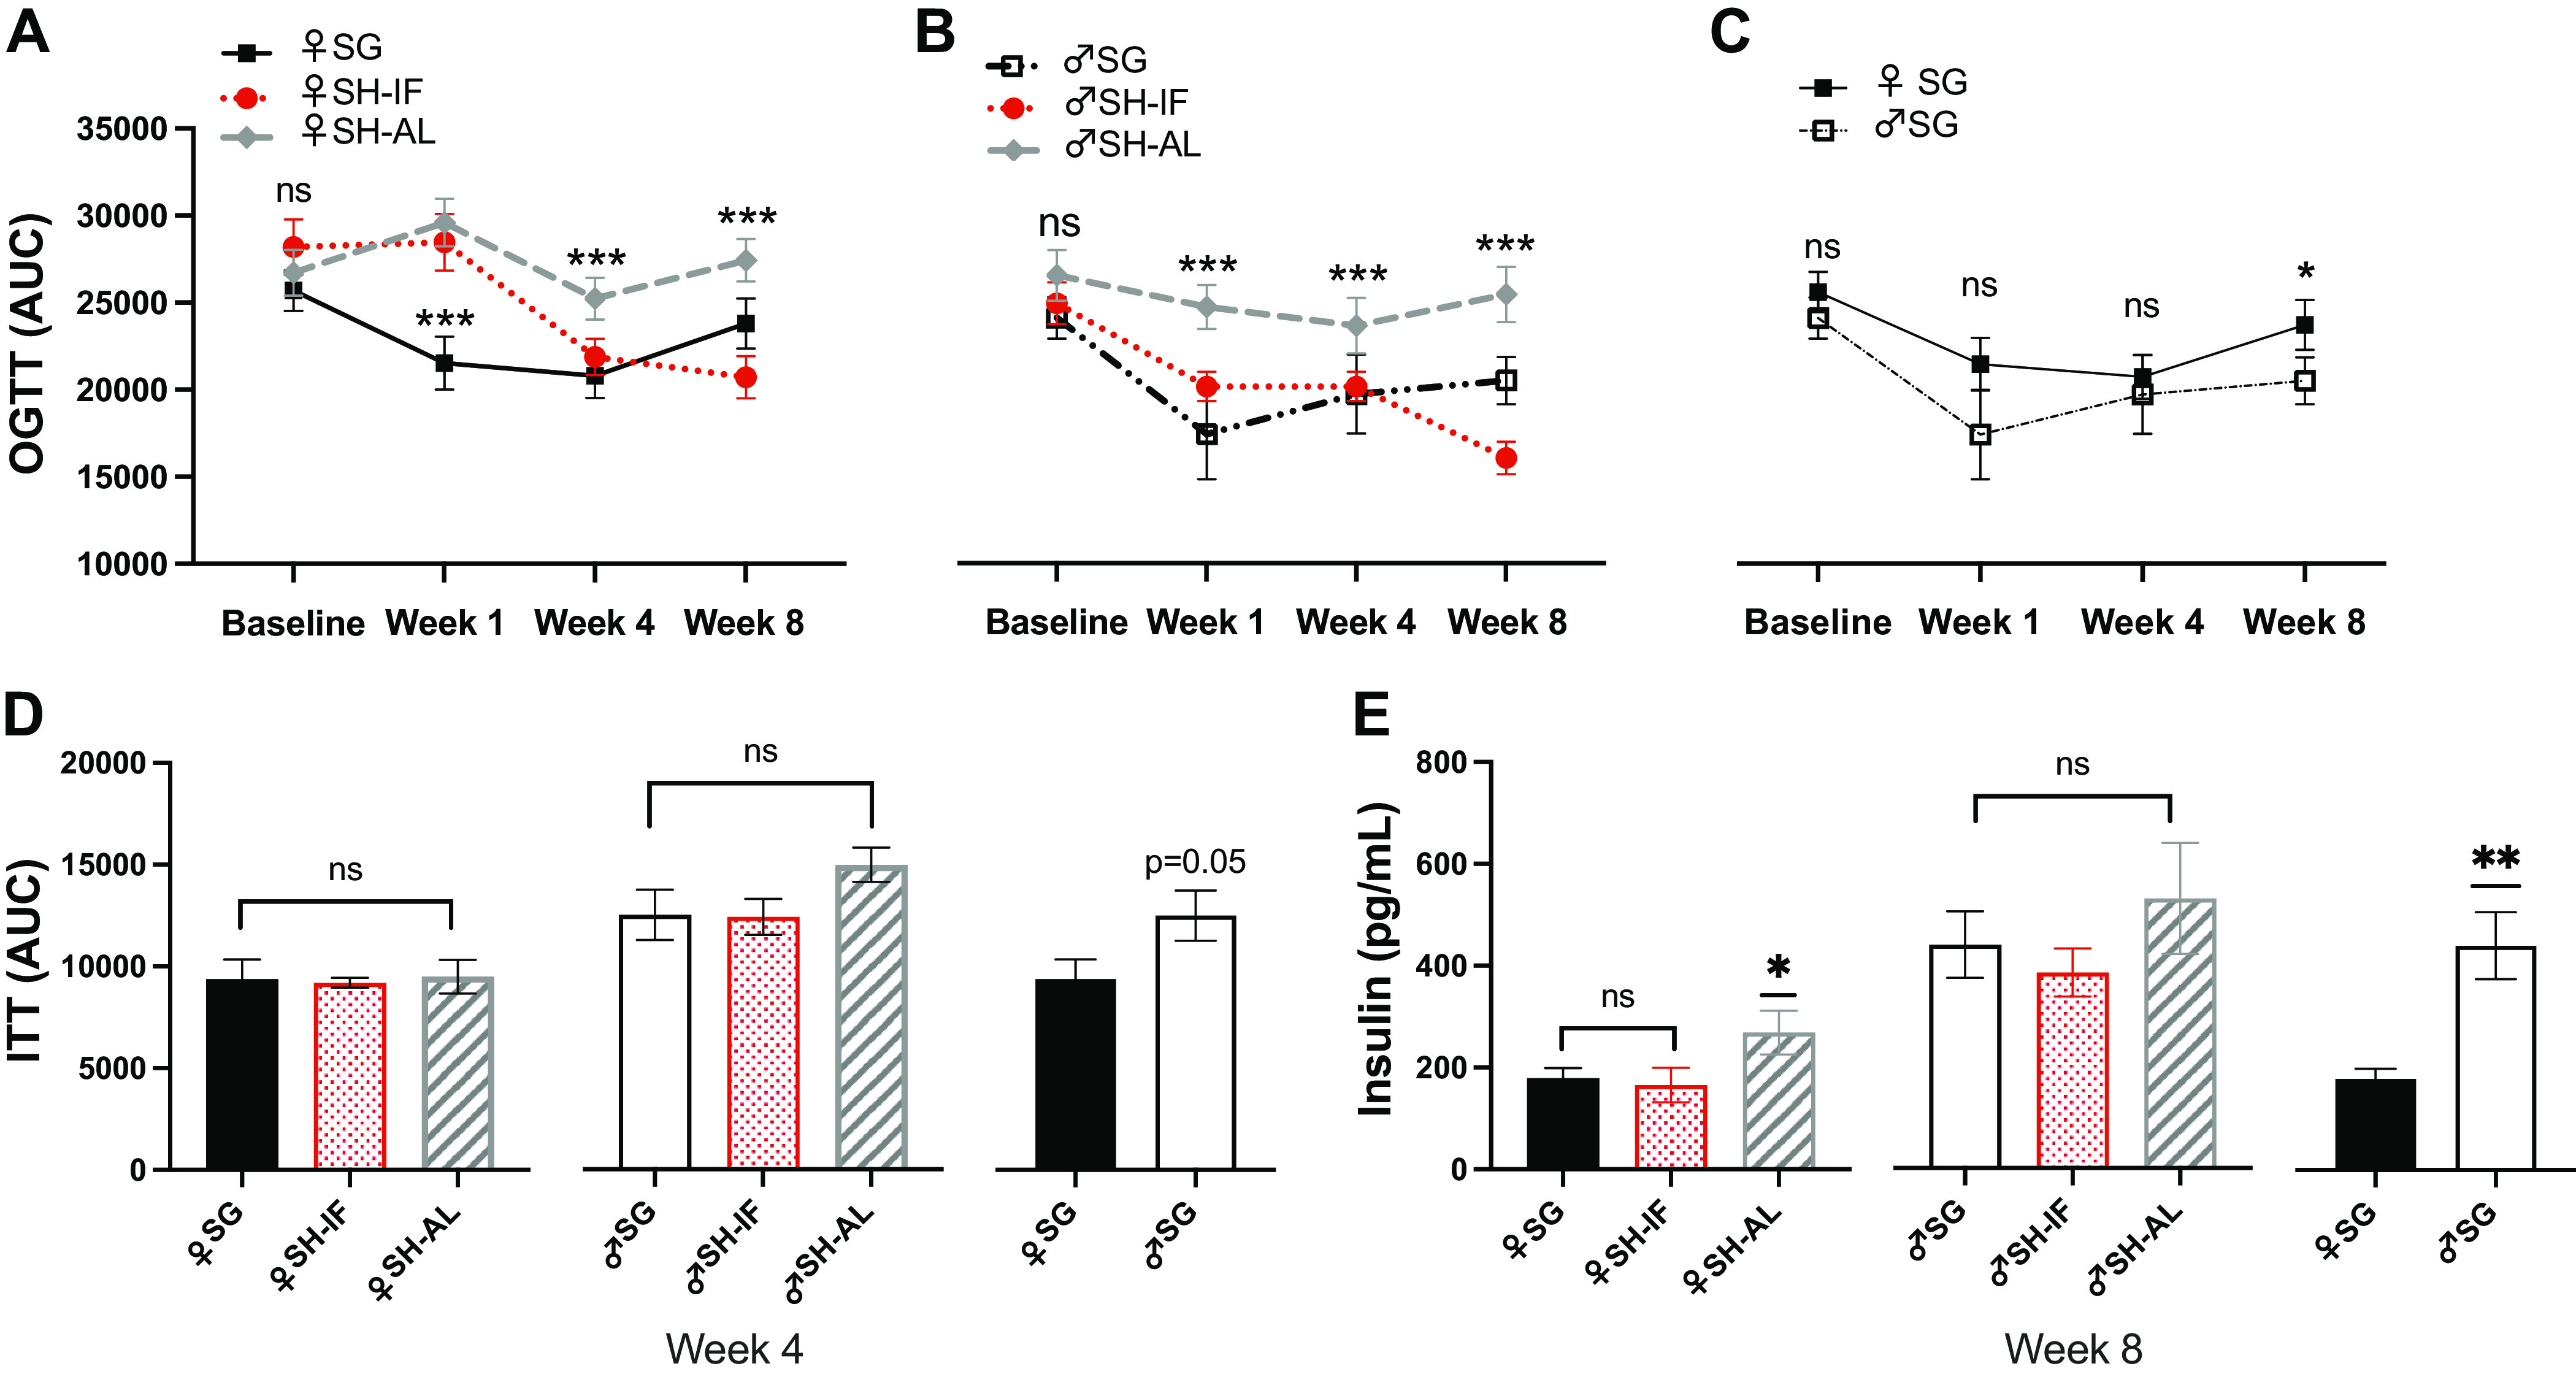
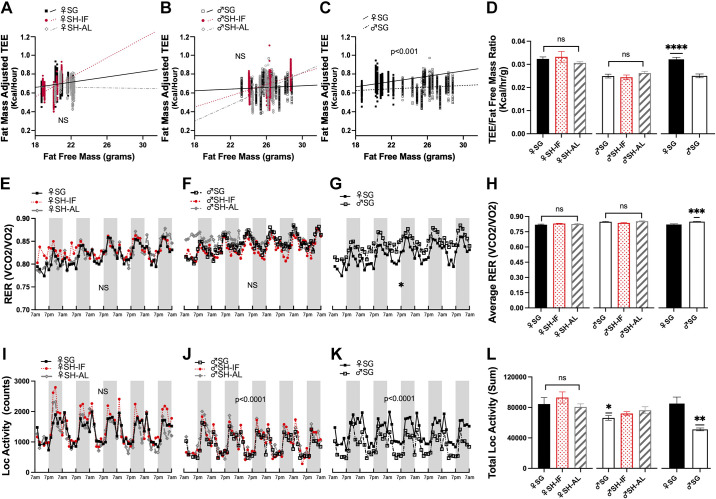
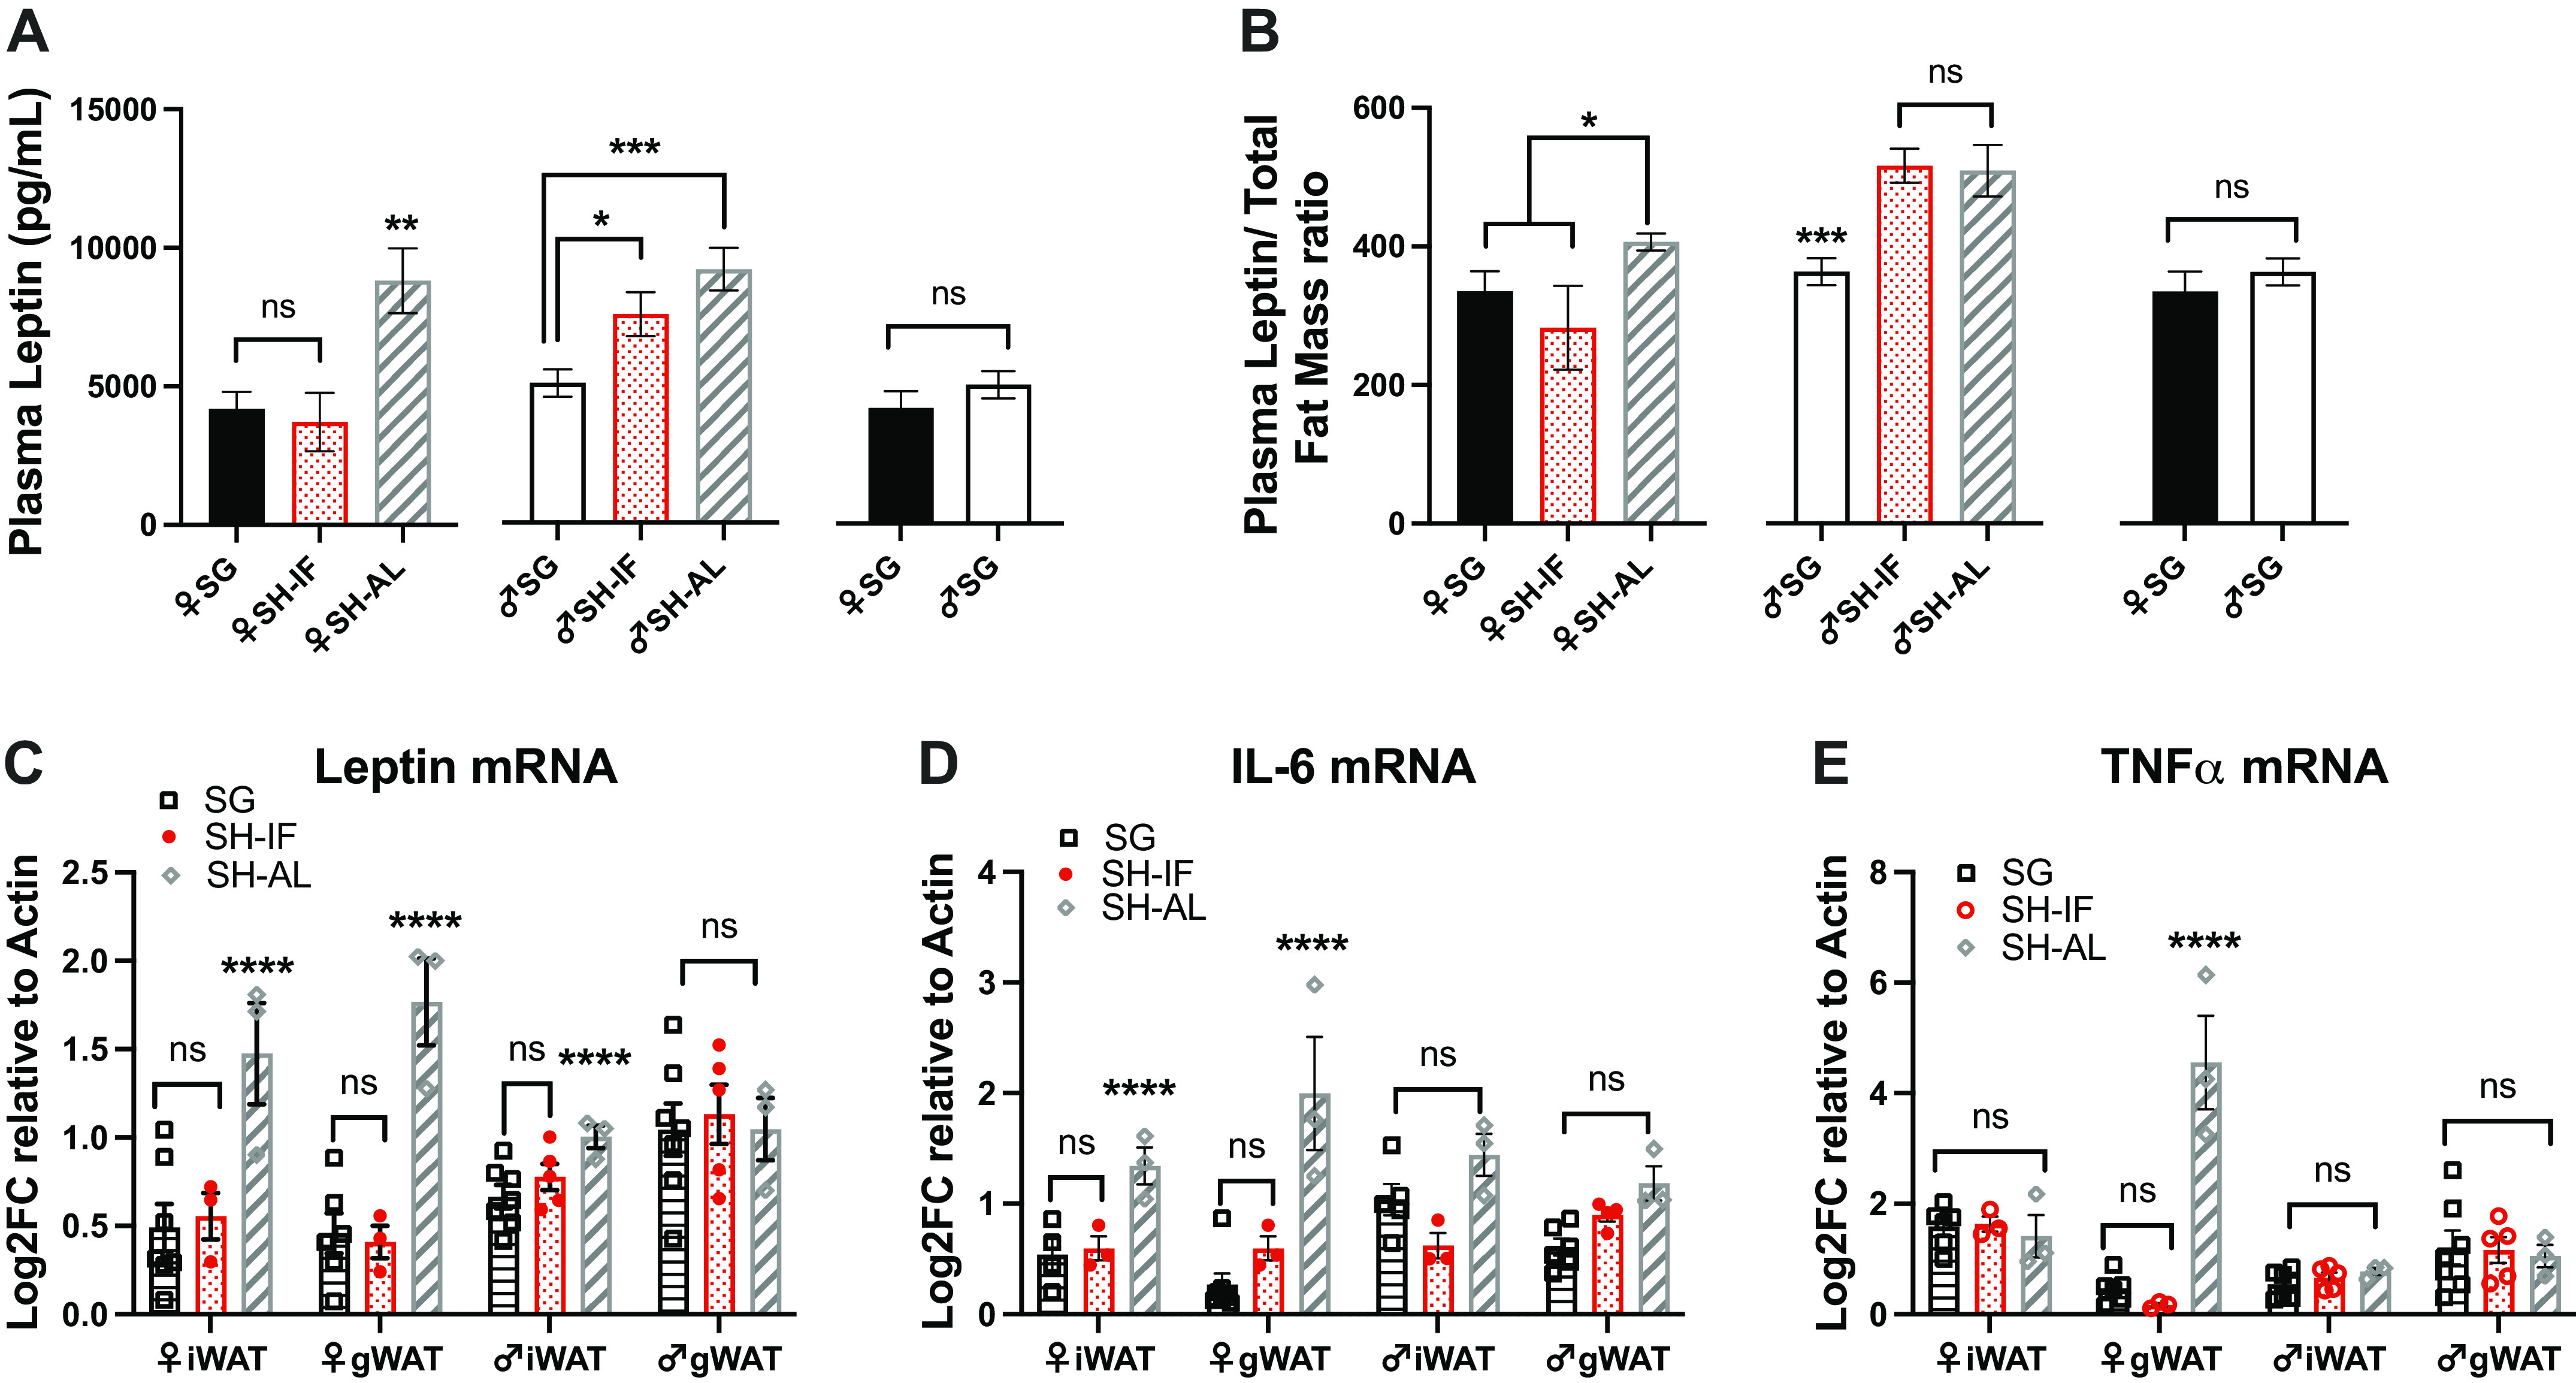
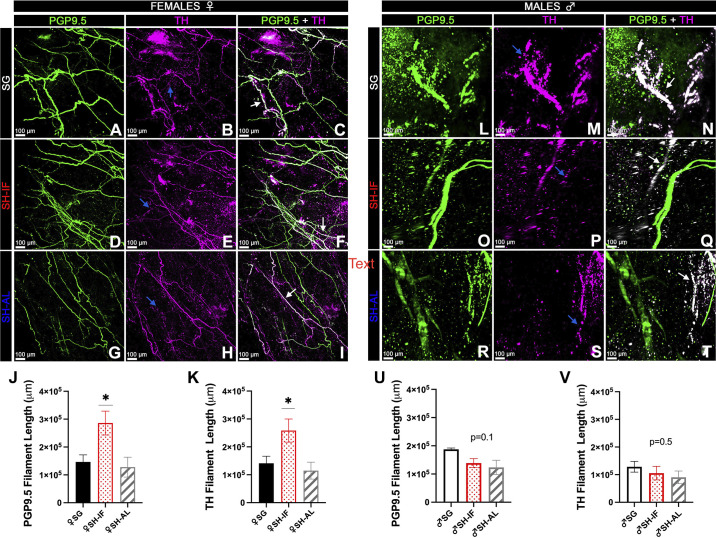
Despite the high prevalence of obesity among middle-aged subjects, it is unclear if sex differences in middle age affect the metabolic outcomes of obesity therapies. Accordingly, in this study, middle-aged obese female and male mice were randomized to one of three groups: sleeve gastrectomy (SG), sham surgery ad libitum (SH-AL), or sham surgery with weight matching to SG through intermittent fasting with calorie restriction (SH-IF). Comprehensive measures of energy and glucose homeostasis, including energy intake, body weight, energy expenditure, glucose and insulin tolerance, and interscapular brown adipose tissue (iBAT) sympathetic innervation density were obtained. At the end of 8 wk, SG and SH-IF females had better metabolic outcomes than their male counterparts. SG females had improved weight loss maintenance, preservation of fat-free mass (FFM), higher total energy expenditure (TEE), normal locomotor activity, and reduced plasma insulin and white adipose tissue (WAT) inflammatory markers. SH-IF females also had lower plasma insulin and WAT inflammatory markers, and higher TEE than SH-IF males, despite their lower FFM. In addition, SH-IF females had higher iBAT sympathetic nerve density than SG and SH-AL females, whereas there were no differences among males. Notably, SH-IF mice of both sexes had the most improved glucose tolerance, highlighting the benefits of fasting, irrespective of weight loss. Results from this study demonstrate that in middle-aged obese mice, female sex is associated with better metabolic outcomes after SG or IF with calorie restriction. Clinical studies are needed to determine if sex differences should guide the choice of obesity therapies.NEW & NOTEWORTHY SG or IF with calorie restriction produces better metabolic outcomes in females than in males. IF with calorie restriction prevents metabolic adaptation, even in the face of fat-free mass loss. IF with calorie restriction in females only, is associated with increased iBAT sympathetic innervation, which possibly mitigates reductions in energy expenditure secondary to fat-free mass loss. Lastly, IF leads to better glucose homeostasis than SG, irrespective of sex.
Keywords: brown adipose tissue; energy expenditure; glucose homeostasis; leptin; metabolic adaptation.
Conflict of interest statement
No conflicts of interest, financial or otherwise, are declared by the authors.
Figures
Similar articles
-
Effects of sleeve gastrectomy in high fat diet-induced obese mice: respective role of reduced caloric intake, white adipose tissue inflammation and changes in adipose tissue and ectopic fat depots.Surg Endosc. 2014 Feb;28(2):592-602. doi: 10.1007/s00464-013-3211-1. Epub 2013 Oct 3. Surg Endosc. 2014. PMID: 24196540
-
Comparison of the effect by which gastric plication and sleeve gastrectomy procedures alter metabolic and physical parameters in an obese type 2 diabetes rodent model.Surg Obes Relat Dis. 2017 Nov;13(11):1819-1828. doi: 10.1016/j.soard.2017.05.010. Epub 2017 May 11. Surg Obes Relat Dis. 2017. PMID: 28645541
-
Mechanisms underlying the efficacy of a rodent model of vertical sleeve gastrectomy - A focus on energy expenditure.Mol Metab. 2023 Jul;73:101739. doi: 10.1016/j.molmet.2023.101739. Epub 2023 May 13. Mol Metab. 2023. PMID: 37187239 Free PMC article.
-
From fasting to fat reshaping: exploring the molecular pathways of intermittent fasting-induced adipose tissue remodeling.J Pharm Pharm Sci. 2024 Jul 22;27:13062. doi: 10.3389/jpps.2024.13062. eCollection 2024. J Pharm Pharm Sci. 2024. PMID: 39104461 Free PMC article. Review.
-
Intermittent Fasting Regulates Metabolic Homeostasis and Improves Cardiovascular Health.Cell Biochem Biophys. 2024 Sep;82(3):1583-1597. doi: 10.1007/s12013-024-01314-9. Epub 2024 Jun 7. Cell Biochem Biophys. 2024. PMID: 38847940 Free PMC article. Review.
Cited by
-
Bone marrow neutrophil density regulates myelopoiesis during obesity and weight loss.J Exp Med. 2025 Sep 1;222(9):e20242174. doi: 10.1084/jem.20242174. Epub 2025 Jul 11. J Exp Med. 2025. PMID: 40644598
-
The metabolic advantage of being young and male in obesity treatment outcomes in mice.NPJ Metab Health Dis. 2025 Aug 1;3(1):32. doi: 10.1038/s44324-025-00065-2. NPJ Metab Health Dis. 2025. PMID: 40751023 Free PMC article.
References
-
- Hales CM, Carroll MD, Fryar CD, Ogden CL. Prevalence of obesity and severe obesity among adults: United States, 2017–2018. NCHS Data Brief (360): 1–8, 2020. - PubMed
-
- Arterburn D, Wellman R, Emiliano A, Smith SR, Odegaard AO, Murali S, Williams N, Coleman KJ, Courcoulas A, Coley RY, Anau J, Pardee R, Toh S, Janning C, Cook A, Sturtevant J, Horgan C, McTigue KM; PCORnet Bariatric Study Collaborative. Comparative effectiveness and safety of bariatric procedures for weight loss: a PCORnet cohort study. Ann Intern Med 169: 741–750, 2018. doi:10.7326/M17-2786. - DOI - PMC - PubMed
Publication types
MeSH terms
Substances
Associated data
Grants and funding
LinkOut - more resources
Full Text Sources
Medical
Miscellaneous