. 2022 Jul 13;30(7):1003-1019.e10.
doi: 10.1016/j.chom.2022.05.006. Epub 2022 Jun 2.

Tet2 deficiency drives liver microbiome dysbiosis triggering Tc1 cell autoimmune hepatitis

Affiliations

Tet2 deficiency drives liver microbiome dysbiosis triggering Tc1 cell autoimmune hepatitis

Surya P Pandey et al. Cell Host Microbe. .

Abstract

The triggers that drive interferon-γ (IFNγ)-producing CD8 T cell (Tc1 cell)-mediated autoimmune hepatitis (AIH) remain obscure. Here, we show that lack of hematopoietic Tet methylcytosine dioxygenase 2 (Tet2), an epigenetic regulator associated with autoimmunity, results in the development of microbiota-dependent AIH-like pathology, accompanied by hepatic enrichment of aryl hydrocarbon receptor (AhR) ligand-producing pathobionts and rampant Tc1 cell immunity. We report that AIH-like disease development is dependent on both IFNγ and AhR signaling, as blocking either reverts ongoing AIH-like pathology. Illustrating the critical role of AhR-ligand-producing pathobionts in this condition, hepatic translocation of the AhR ligand indole-3-aldehyde (I3A)-releasing Lactobacillus reuteri is sufficient to trigger AIH-like pathology. Finally, we demonstrate that I3A is required for L. reuteri-induced Tc1 cell differentiation in vitro and AIH-like pathology in vivo, both of which are restrained by Tet2 within CD8 T cells. This AIH-disease model may contribute to the development of therapeutics to alleviate AIH.

Keywords: Lactobacillus reuteri; Tc1 cells; Tet2; aryl hydrocarbon receptor agonist; autoimmune hepatitis; liver microbiome.


Conflict of interest statement

Declaration of interests The authors declare no competing interests.

Figures

Figure 1.
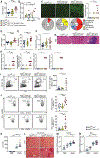
Figure 1.. Tet2ΔVAV mice develop spontaneous hepatic pathology with age
>20-week-old Tet2ΔVAV mice and Tet2 cre littermates were used. (A) Correlation between CD11b+Gr1+ cell frequency and ALT activity. Pearson correlation test of Tet2ΔVAV mice, p value shown. (B and C) RNA-seq of whole liver. (B) Venn diagram. (C) Heatmap of selected DEGs, average is shown. (D) Liver weight. (E) Representative trichrome staining of livers (left) and quantification of area of fibrosis (right). Scale bars, 100 μm. (F) Hepatic gene expression. (G) Number of CD45+ lymphocytes/g liver tissue quantified by flow cytometry. (H) ALT activity. (I) Representative images (left) and quantification (right) of TUNEL+ cells in livers; FOV, field of view. Scale bars, 20 μm. (B and C) n = 4/5 mice/group. (D–I) Mean ± SEM, one-way ANOVA, Sidak’s post hoc test. Data represent three independent experiments. *p < 0.05, **p < 0.01, ***p < 0.001, ****p < 0.0001.
Figure 2.
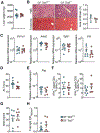
Figure 2.. Tet2ΔVAV mice develop AIH-like pathology
(A–J) Mice from Figure 1 cohort were used. (A) ANA levels. (B) Correlation between CD11b+Gr1+ cell frequency and ANA levels. Pearson correlation test of Tet2ΔVAV mice, p value shown. (C) Representative images (top, left), scores (top, right), and pie charts of plasma ANA reactivity by Hep2 cells. (D–F) Plasma levels of (D) LKM1, (E) SLA, and (F) total IgG. (G) Representative H&E staining of livers. Scale bars, 100 μm. (H) AIH-histology score. Each dot represents an independent mouse. (I and J) Representative flow cytometry plots (left) and quantification (right) of hepatic (I) CD138+ PCs and (J) IFNγ-producing CD8 T cells (top) and CD4 T cells (bottom). (K–N) 6-week-old Tet2ΔVAV and Tet2 cre mice treated with ConA or PBS. (K) ALT activity. (L) Representative trichrome staining of livers. Scale bars, 100 μm. (M and N) Hepatic gene expression. (A, D–F, I–K, M, and N) Mean ± SEM, one-way ANOVA, Sidak’s post hoc test. (C and H) Kruskal-Wallis test, Dunn’s multiple comparisons test. Data represent at least two independent experiments. *p < 0.05, **p < 0.01, ***p < 0.001, ****p < 0.0001.
Figure 3.
Figure 3.. AIH-like pathology development in Tet2ΔVAV mice requires IFNγ
>20-week-old Tet2ΔVAV mice with AIH-like disease and Tet2 cre littermates treated with anti-IFNγ (see Figures S3A and S3B). (A) Representative H&E (top) and trichrome (bottom) liver stain (left) and quantification of fibrosis area (right). Scale bars, 100 μm. (B) Hepatic gene expression. (C) ALT activity. (D) Hepatic gene expression. (E) Representative flow cytometry plots and quantification of hepatic IFNγ-producing CD4 T cells (left) and CD8 T cells (right). (F) ANA levels. (G) Representative image (left) and quantification of TUNEL+ cells in livers (right); FOV, field of view. Scale bars, 20 μm.(A-G) Mean ± SEM is shown. One-way ANOVA, Sidak’s post hoc test. Data represent two independent experiments. *p < 0.05, **p < 0.01, ***p < 0.001, ****p < 0.0001.
Figure 4.
Figure 4.. Deficiency of Tet2 in T cells, but neither in myeloid cells nor hepatocytes, is sufficient to drive the development of AIH-like pathology
>20-week-old (A–E) Tet2fl/fl LysM cre+, (F–J) Tet2fl/fl Alb cre+, or (K–Q) Tet2fl/fl CD2 cre+ mice and corresponding WT littermates were used. (A, F, and K) Representative H&E (top) and trichrome (bottom) liver stain (left) and quantification of fibrosis area (right). Scale bars, 100 μm. (B, G, and Q) Quantification of IFNγ-producing CD4 T cells (left) and CD8 T cells (right). (C, H, and L) ALT activity. (D, I, and M) ANA levels. (E, J, and P) Total IgG levels. (N) Representative images (top, left), scores (top, right), and pie charts of plasma ANA reactivity by Hep2 cells. (O) SLA levels. (A–M and O–Q) Mean ± SEM is shown. (K–M and O–Q) Two-tailed unpaired t test. (N) Mann-Whitney test. (A-Q) Data represent at least two independent experiments. *p < 0.05, **p < 0.01, ***p < 0.001, ****p < 0.0001.
Figure 5.
Figure 5.. The microbiota is required for the development of AIH-like pathology in Tet2-deficient mice
25-week-old germ-free (GF) Tet2−/− and Tet2+/+ littermates were used. (A) Liver weight. (B) Representative H&E (top) and trichrome (bottom) liver stain (left) and quantification of fibrosis area (right). Scale bars, 100 μm. (C) Hepatic gene expression. (D) ALT activity. (E) Hepatic gene expression. (F) Quantification of hepatic IFNγ-producing CD4 T cells (left) and CD8 T cells (right). (G) ANA levels. (H) Total IgG levels. (A–H) Mean ± SEM is shown. Data represent two independent experiments.
Figure 6.
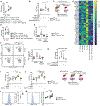
Figure 6.. AIH-like pathology development in Tet2ΔVAV mice is linked to liver microbiome dysbiosis and is triggered upon L. reuteri treatment
>20-week-old (A–G and N) and 6-week-old (H–M) Tet2ΔVAV mice and WT littermates were used. (A) Live commensal bacteria identified in livers. (B) Shannon diversity index of hepatic microbial DNA of species. p value compares AIH-like Tet2ΔVAV mice with WT littermates. (C) Hierarchical clustering heatmap of hepatic genera identified from cohort defined in Figure S5A. (D and E) Correlation of Shannon diversity indices (of B) with (D) ANA levels and (E) frequency of hepatic IFNγ-producing T cells. Pearson correlation test of Tet2ΔVAV mice, p value shown. (F) Hepatic bacterial 16S rRNA gene expression. (G) AhR activity of liver homogenate. (H–M) Young Tet2ΔVAV mice and WT littermates were orally treated with 109 CFU L. reuteri consecutively (see STAR Methods for details). (H) ANA levels. (I) Representative flow cytometry plots (left) and quantification (right) of hepatic IFNγ-producing CD8 T cells. (J) ALT activity. (K) Presence of viable L. reuteri detected in livers of PBS (top) or L. reuteri-treated (bottom) mice. (L and M) AhR activity of (L) recultured hepatic bacteria and (M) liver homogenate. (N) I3A levels in liver homogenate. (A) Data represent two independent experiments, n = 8 mice/group. (B) One-way ANOVA, Sidak’s post hoc test. Median, first and third quartiles are shown. (C) n = 4 mice/group, average is shown. (G, H–J, and N) Data represent two independent experiments. (F and H–J) Mean ± SEM, one-way ANOVA, Sidak’s post hoc test. (G and N) Kruskal-Wallis test, Dunn’s multiple comparisons test. Median, first, and third quartiles are shown. (L and M) Mean ± SEM, two-tailed unpaired t test. *p < 0.05, **p < 0.01, ***p < 0.001.
Figure 7.
Figure 7.. I3A is required for, and the absence of Tet2 in CD8 T cells is sufficient to succumb to, L. reuteri-mediated AIH-like pathology
(A–C) 6-week-old Tet2ΔVAV mice and WT littermates treated with L. reuteri or PBS ± AhR antagonist (CH223191; intraperitoneal [i.p.] injection) or vehicle control. (A) ANA levels. (B) ALT activity. (C) Presence of viable L. reuteri in the livers of L. reuteri-treated mice. (D–F) >20-week-old Tet2ΔVAV AIH-like diseased mice and WT littermates treated with AhR antagonist (CH223191; i.p.) or vehicle control. (D) ANA levels; D, day. (E) ALT activity. (F) Representative flow cytometry plots (left) and quantification (right) of hepatic IFNγ-producing CD8 T cells. (G) IFNγ production by naive CD8 T cells following stimulation with anti-CD3 and anti-CD28 ± L. reuteri supernatant ± ΔArAT L. reuteri supernatant ± AhR antagonist. (H) RNA-seq heatmap of naive CD8 T cells following stimulation with anti-CD3 and anti-CD28 ± I3A ± AhR antagonist; WT, Tet2 cre mice; KO, Tet2ΔVAV mice. (I–K) 6-week-old Tet2ΔCD8 mice and WT littermates treated with L. reuteri or ΔArAT L. reuteri. (I) ANA levels. (J) ALT activity. (K) Presence of viable L. reuteri in livers of L. reuteri or ΔArAT L. reuteri-treated mice. (L and M) 6-week-old Tet2ΔVAV mice and WT littermates were used. (L) Representative histogram plot of mean fluorescent intensity (MFI) (left) and quantification (right) of IFNγR1 expression on hepatic naive CD8 T cells. (M) Representative histogram plot of mean fluorescent intensity (MFI) (left) and quantification (right) of pSTAT1 activation in naive CD8 T cells following stimulation with anti-CD3 and anti-CD28 ± recombinant IFNγ; dashed lines, PBS treated; solid lines, recombinant IFNγ treated. (A–C) Data represent 3–7 mice/group. (A and B) Mean ± SEM. (A) d0 to d35 comparison, paired t test, treatment comparison at D35, two-way ANOVA, Sidak’s multiple comparisons test. (B) One-way ANOVA, Sidak’s post hoc test. (D–F) Data represent two independent experiments, mean ± SEM n = 4–6 mice/group. (D) D0 to D35 comparison, paired t test, treatment comparison at D35, two-way ANOVA, Sidak’s multiple comparisons test. (E and F) One-way ANOVA, Sidak’s post hoc test. (G) Data represent 5 mice/group, mean ± SEM, two-way ANOVA, Sidak’s multiple comparisons test. (H) Data represent n = 3–4 mice/group, average is shown. (I and J) Mean ± SEM, two-way ANOVA, Sidak’s multiple comparisons test. (L) Mean ± SEM, two-tailed unpaired t test. (M) Data represent two independent experiments, mean ± S.E.M., paired t test, two-way ANOVA, Sidak’s multiple comparisons test. *p < 0.05, **p < 0.01, ***p < 0.001, ****p < 0.0001.

References

    1. Abdel-Wahab O, and Levine RL (2013). Mutations in epigenetic modifiers in the pathogenesis and therapy of acute myeloid leukemia. Blood 121, 3563–3572. 10.1182/blood-2013-01-451781. - DOI - PMC - PubMed
    1. Anderson MJ (2006). Distance-based tests for homogeneity of multivariate dispersions. Biometrics 62, 245–253. 10.1111/j.1541-0420.2005.00440.x. - DOI - PubMed
    1. Assis DN (2020). Immunopathogenesis of Autoimmune Hepatitis. Clin. Liver Dis. (Hoboken) 15, 129–132. 10.1002/cld.873. - DOI - PMC - PubMed
    1. Backes C, Keller A, Kuentzer J, Kneissl B, Comtesse N, Elnakady YA, Müller R, Meese E, and Lenhof HP (2007). GeneTrail-advanced gene set enrichment analysis. Nucleic Acids Res. 35, W186–W192. 10.1093/nar/gkm323. - DOI - PMC - PubMed
    1. Barraco D, Mudireddy M, Shah S, Hanson CA, Ketterling RP, Gangat N, Pardanani A, and Tefferi A (2017). Liver function test abnormalities and their clinical relevance in primary myelofibrosis. Blood Cancer J. 7, e557. 10.1038/bcj.2017.34. - DOI - PMC - PubMed