. 2022 Jun 3;15(1):76.
doi: 10.1186/s13045-022-01291-7.

Integrated proteogenomic characterization of urothelial carcinoma of the bladder

Affiliations

Integrated proteogenomic characterization of urothelial carcinoma of the bladder

Ning Xu et al. J Hematol Oncol. .

Abstract

Background: Urothelial carcinoma (UC) is the most common pathological type of bladder cancer, a malignant tumor. However, an integrated multi-omics analysis of the Chinese UC patient cohort is lacking.

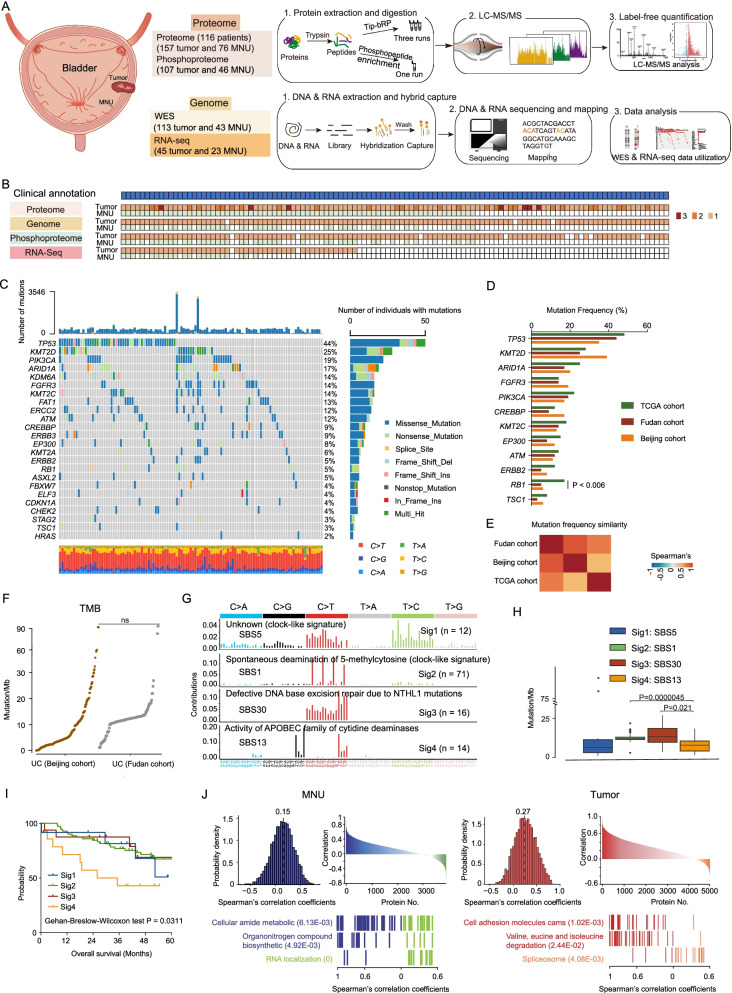
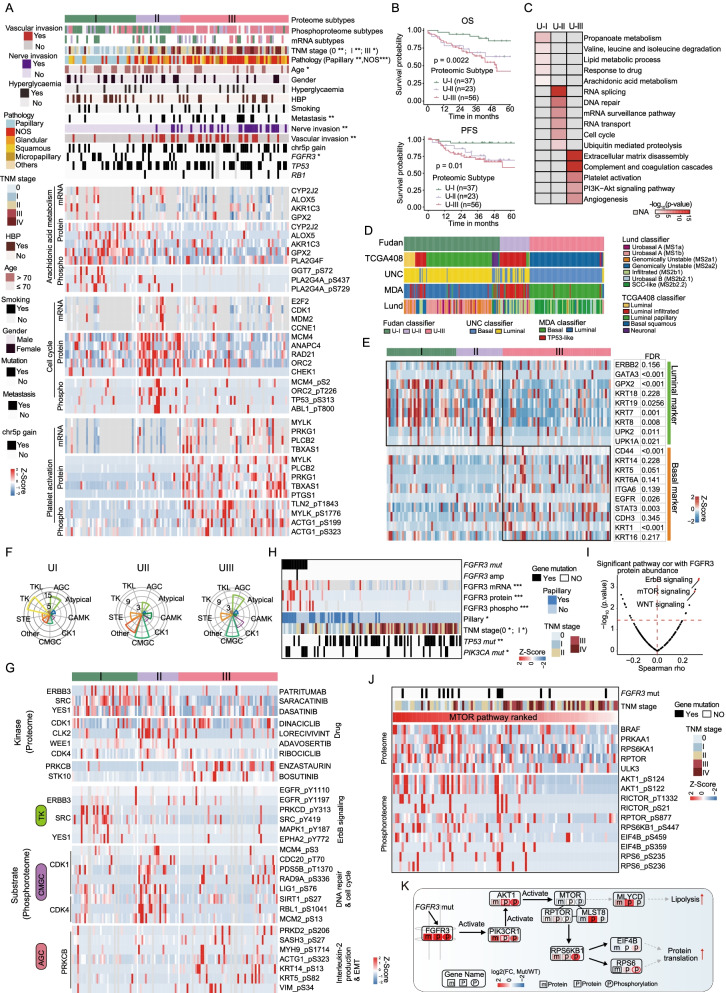
Methods: We performed an integrated multi-omics analysis, including whole-exome sequencing, RNA-seq, proteomic, and phosphoproteomic analysis of 116 Chinese UC patients, comprising 45 non-muscle-invasive bladder cancer patients (NMIBCs) and 71 muscle-invasive bladder cancer patients (MIBCs).

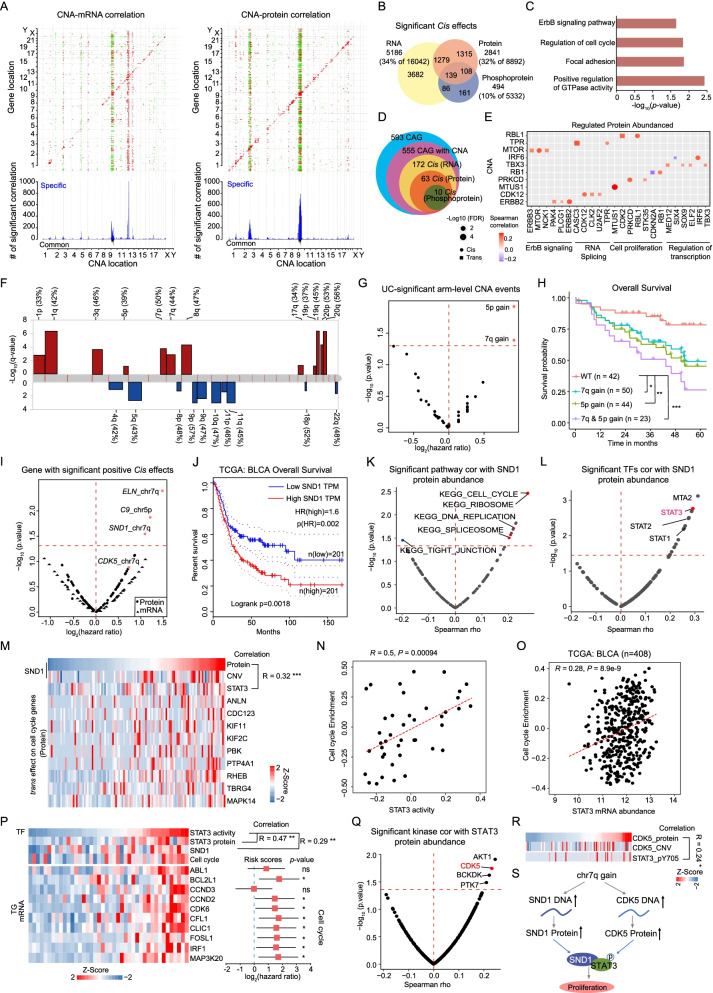
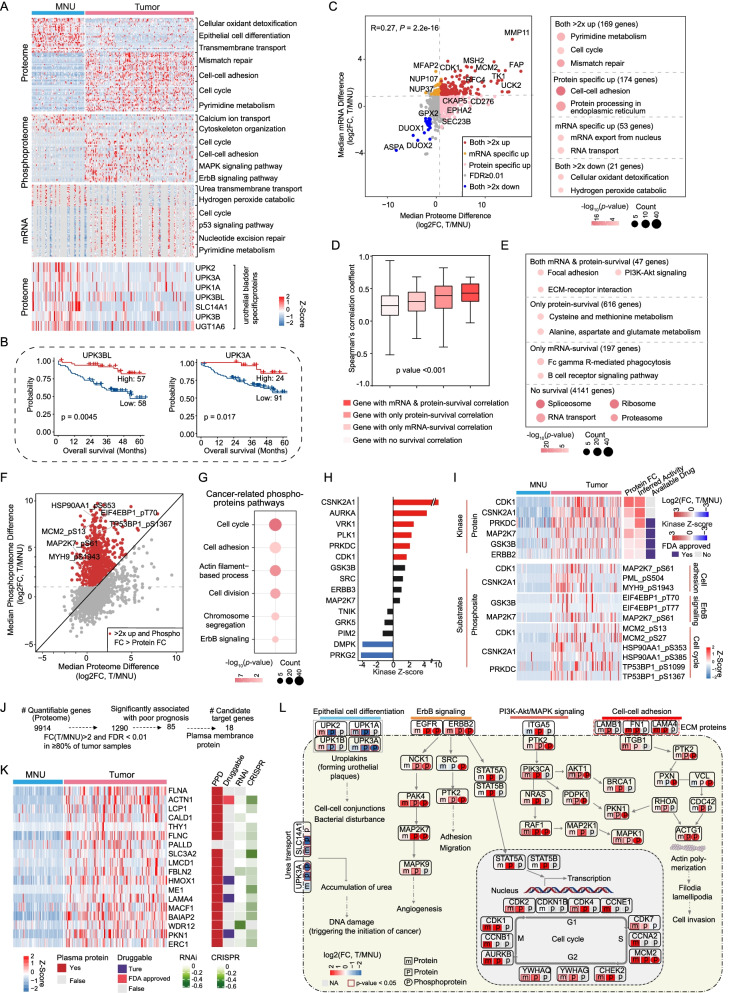
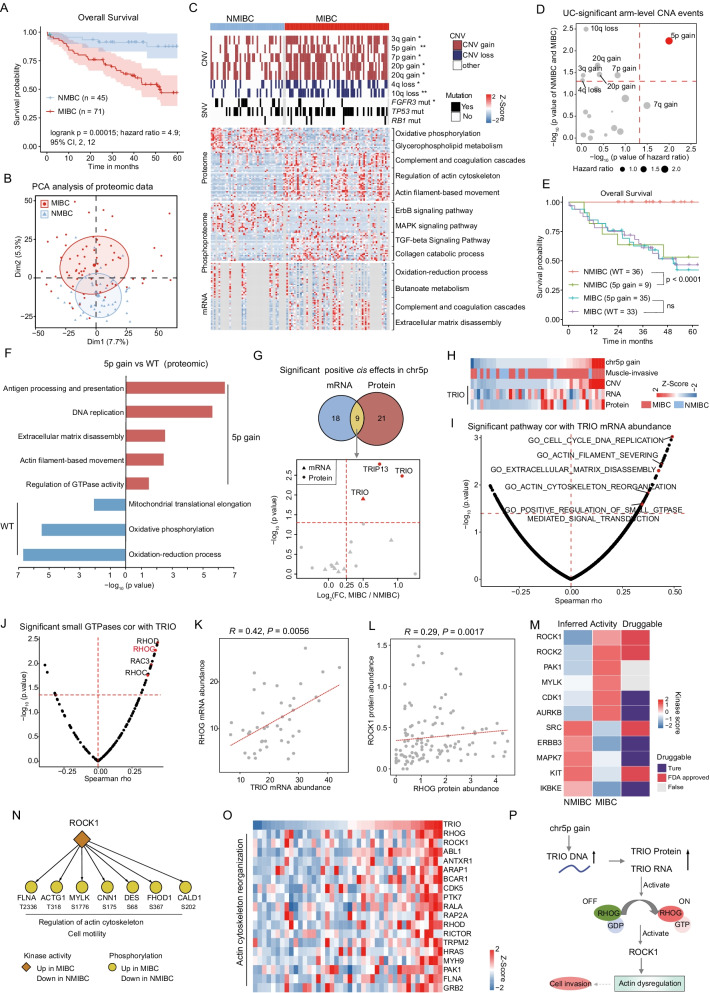
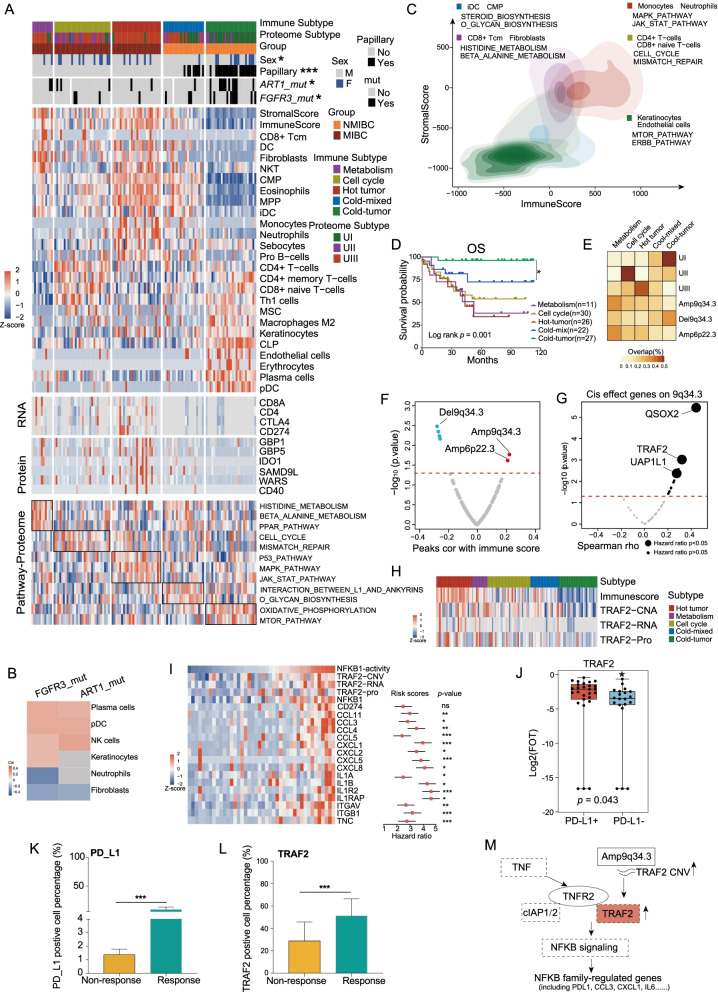
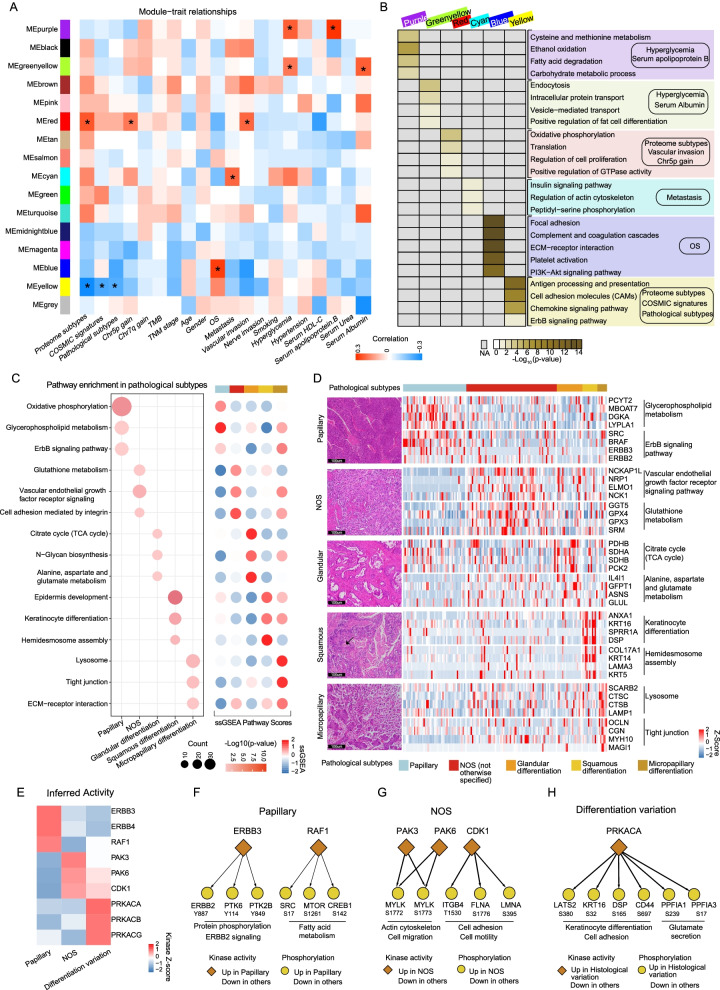
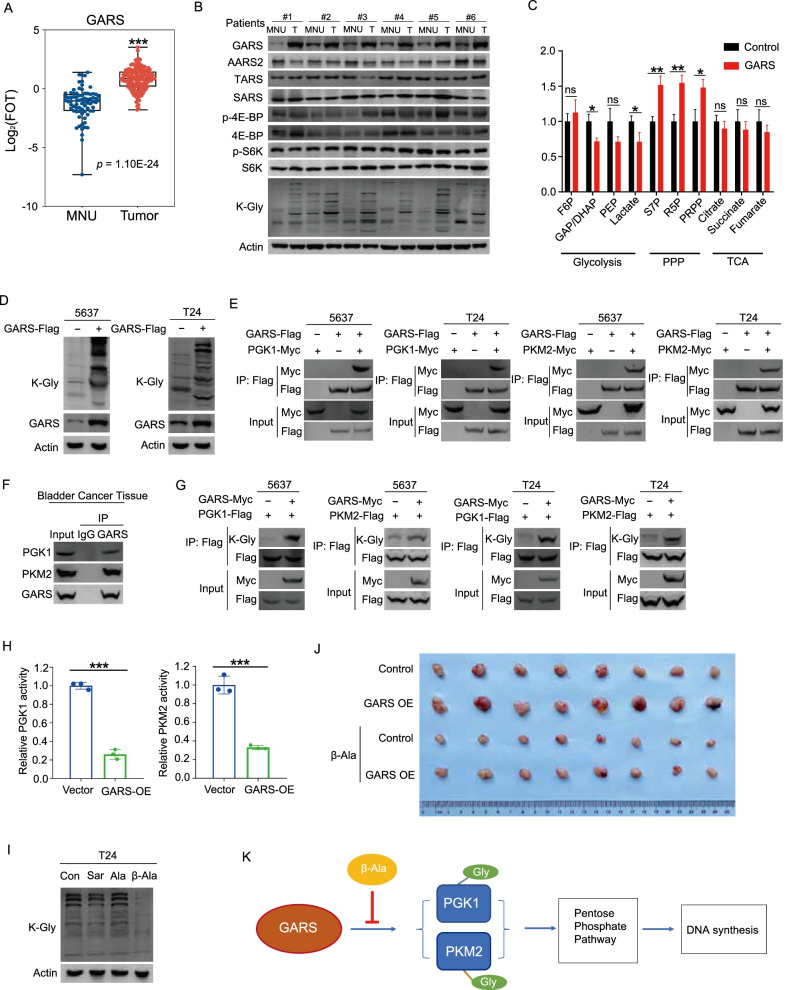
Result: Proteogenomic integration analysis indicated that SND1 and CDK5 amplifications on chromosome 7q were associated with the activation of STAT3, which was relevant to tumor proliferation. Chromosome 5p gain in NMIBC patients was a high-risk factor, through modulating actin cytoskeleton implicating in tumor cells invasion. Phosphoproteomic analysis of tumors and morphologically normal human urothelium produced UC-associated activated kinases, including CDK1 and PRKDC. Proteomic analysis identified three groups, U-I, U-II, and U-III, reflecting distinct clinical prognosis and molecular signatures. Immune subtypes of UC tumors revealed a complex immune landscape and suggested the amplification of TRAF2 related to the increased expression of PD-L1. Additionally, increased GARS, related to subtype U-II, was validated to promote pentose phosphate pathway by inhibiting activities of PGK1 and PKM2.

Conclusions: This study provides a valuable resource for researchers and clinicians to further identify molecular pathogenesis and therapeutic opportunities in urothelial carcinoma of the bladder.

Keywords: GARS; Genome; Immune clusters; Phosphoproteomics; Proteomic subtype; Proteomics; RNA-seq; Urothelial carcinoma of the bladder.


Conflict of interest statement

The authors declare that they have no competing interests.

Figures

Fig. 1
Fig. 1
Multi-omics landscape of UC samples. A The workflow of the experiment. B The number of samples for proteomics, phosphoproteomics, WES, and RNA-seq analysis. C The genomic profiles. Top to bottom: synonymous and non-synonymous somatic mutation rates; somatic mutations for significantly mutated genes (SMGs); and potential SMG. Mutation types and their frequencies are depicted by a bar plot in the right panel. D Gene mutation frequency in our cohort compared with other cohorts. E Correlation plot of the mutation frequencies observed in Fudan cohort compared to TCGA cohort and Beijing cohort. F Comparison of TMB in the tumors of our cohort and the Beijing cohort. G Mutational spectrum of the four mutational signatures extracted by Sigminer analysis. Corresponding COSMIC signatures are labeled in parentheses. H Comparison of TMB in the tumors with different mutational signatures. I Kaplan–Meier curves (Gehan–Breslow–Wilcoxon test) for overall survival based on different mutational signatures. J Left panel: mRNA–protein correlation in MNUs. Blue: pathways in which positively correlated genes were involved; green: pathways in which negatively correlated genes were involved. Right panel: mRNA–protein correlation in tumors. Red: pathways in which positively correlated genes were involved; orange: pathways in which negatively correlated genes were involved
Fig. 2
Fig. 2
Effects of copy number alterations on mRNA and protein abundance. A Functional effects of CNAs on mRNA and proteins. Top panels: correlation of CNA to mRNA and protein abundance. Positive and negative correlations are indicated in red and blue, respectively. Genes were ordered by chromosomal location on the x and y axes. Diagonal lines indicate cis-effects of CNA on mRNA or proteins. Bottom panels: number of mRNAs or proteins that were significantly associated with a specific CNA. Gray bars indicate correlations specific to mRNA or proteins, and black bars indicate correlations with both mRNA and proteins. B Venn diagrams depicting the cascading effects of CNAs. It shows the overlap between significant cis events across the transcriptome, proteome, and phosphoproteome. C Pathways enriched for 139 significant cis-effect genes. D Venn diagram shows the significant cis events restricted to cancer-associated genes (CAGs) across multiple data types. E Cis- and trans-effects of 10 significant cis-effect CAGs. Affected proteins are grouped by pathway. F Arm-level CNAs. Red denotes amplification and blue denotes deletion. G Chromosomal alterations associated with prognosis (overall survival). Volcano plot showing log2-based hazard ratio for each alterative chromosome. H Overall survival analysis of patients with 5p or 7q gain versus WT (p value from log-rank test). I Volcano plot showing log2-based hazard ratio (overall survival) for significant positive cis-effect genes on chromosomes 5p and 7q, respectively. The dots represent proteins, and the triangles represent mRNA. J Overall survival analyses of BLCA TCGA patients with high or low levels of SND1 mRNA abundance (p value from log-rank test). K Volcano plot showing the correlation between enriched KEGG pathways scores (sample-specific gene set enrichment analysis (ssGSEA)) and SND1 protein abundance. L Volcano plot showing the correlation of transcription factors (TFs) with SND1 based on protein level. TF, highlighted in red, reportedly interacts with SND1. M Heatmap of SND1 protein abundance and trans-effect cell-cycle-related proteins. N Correlation of STAT3 activity with the cell cycle enrichment score by ssGSEA. O Correlation of STAT3 with the cell cycle enrichment score by ssGSEA in TCGA cohort. P Heatmap of STAT3 activity change and the target genes of STAT3 that participated in cell cycle. Confidence intervals (95%) of hazard ratio coefficients (overall survival) for each gene mRNA expression level were based on multivariate Cox regression models (tumor samples, n = 42). Q Volcano plot showing the correlation of kinase with STAT3 based on protein level. The kinase highlighted in red has been reported to be a STAT3 kinase. R Correlation and heatmap of CDK5 protein abundance with STAT3 phosphorylation change. S A model depicting the gain of chromosome 7q. The p values in KR were calculated by Spearman's correlation test
Fig. 3
Fig. 3
Integrated multi-omics analyses of tumor tissues compared with MNUs. A Differentially expressed genes, proteins and phosphoproteins in tumors and MNUs and their associated biological pathways (top panel). A list of urothelial bladder signature proteins that were differentially expressed in tumors and MNUs (p value from Wilcoxon rank-sum test) (bottom panel). B Two proteins (UPK3BL and UPK3A) were significantly associated with prognosis (overall survival) (p value from log-rank test). C Fold changes of genes and proteins in tumors and MNUs (Spearman's r = 0.26, p = 2.2E−16) (left) and pathways enriched for respective specific changed molecules (right). D Boxplot showing the mRNA–protein correlations for the genes associated with significant and nonsignificant differences in patient survival at the protein or mRNA level (p value from Kruskal–Wallis test). E Pathways enriched for genes with survival differences at protein or mRNA level. F Fold changes of proteins and phosphosites, and their correlations in tumors and MNUs. Red dots: phosphosites are greater than twofold changes in tumors compared to MNUs, and changes of phosphosites abundance are greater than changes of their corresponding protein abundance. G Pathways enriched with cancer-related phosphosites. H KSEA analyses of kinase activities in tumors and MNUs. I Heatmap of activated kinases in tumors and substrates corresponding to associated biological pathways (left). Inferred activity was calculated via KSEA analyses, and purple boxes indicate the existence of an FDA-approved drug. (J and K) Strategy for candidate target genes (J) and heatmap showing the proteins that meet the screening criteria (K). Cancer dependency map-supported (https://depmap.org) panels on the right show log2-transformed relative survival averaged across all available urinary tract cell lines after depletion of the indicated gene (rows) by RNAi or CRISPR. Their presence in serum was annotated from Plasma Proteome Database (PPD), and drug targets were based on the Drug Gene Interaction Database (http://www.dgidb.org/). L Overview of significantly enriched pathways in tumors and MNUs
Fig. 4
Fig. 4
Proteogenomic profiles distinguished NMIBC from MIBC. A Overall survival analysis of NMIBC versus MIBC patients (p value from log-rank test). 95% confidence interval was also presented. B PCA analysis of proteomic data (5683 proteins) between MIBC and NMIBC. Red dots: MIBC; blue dots: NMIBC. C Differentially variational genomic events (top panel) and differentially expressed genes, proteins and phosphoproteins in MIBC and NMIBC and their associated biological pathways (bottom panel). Fisher’s exact test was used for arm-level can events and the status of genes mutation. The Wilcoxon rank-sum test was used for differential expression analysis. D Significantly different arm-level CNA events in MIBC and NMIBC and their association with prognosis. E Survival analysis of NMIBC and MIBC patients with chromosome 5p gain versus WT (p value from log-rank test). F Pathways enriched in differentially expressed proteins between 5p gain and WT. G Overlap of genes with significant positive cis-effect genes on 5p based on RNA-Seq or proteomic data (top panel) and log2-fold change between NMIBC and MIBC were shown for the nine overlapping genes (bottom panel). The dots represent proteins; the triangles represent mRNA. H Heatmap of copy number gain of 5p and the mRNA/protein abundance of TRIO. I Volcano plot showing the correlation between enriched Gene Ontology biological processes and TRIO mRNA abundance. J Volcano plot showing the correlation between small GTPases and TRIO based on mRNA level. The one highlighted in red is reportedly activated by TRIO. K Correlation of TRIO mRNA abundance with RHOG mRNA abundance. L Correlation of RHOG protein abundance with ROCK1 protein abundance. M Evaluation of kinase activities in tumors of NMIBC and MIBC via KSEA. Drug targets were based on the Drug Gene Interaction Database (http://www.dgidb.org/). N Diagram illustrating differences between NMIBC and MIBC tumors in terms of phosphorylation abundance and kinase activity for ROCK1. O Heatmap of the mRNA abundance of actin cytoskeleton reorganization related genes. P A brief model depicting the functional impact of chromosome 5p gain. The p values in IL were calculated by Spearman's correlation test
Fig. 5
Fig. 5
Proteomic subtypes of UC and signature proteins. A Heatmap of differentially regulated proteins among the proteomic subtypes (Kruskal–Wallis test, p < 0.05), annotated with clinical features. Fisher’s exact test was used for categorical variables: age, gender, hyperglycosemia, HBP, smoking status, metastasis status, status of FGFR3/TP53/RB1 mutation, pathological subtypes, differentiation, and TNM stage. B Kaplan–Meier curves for overall survival and progression-free survival of different proteomic subgroups (p value from log-rank test). C Pathways significantly enriched in the proteomic subtypes. D Comparisons between our classifier and other classifiers. E Luminal markers were enriched in the UI and UII subtypes, while basal markers were enriched in the UIII subtype (Wilcoxon rank-sum test, p < 0.05). F The kinase family was enriched in different proteomic subtypes (Kruskal–Wallis test, p < 0.05). G Representative kinase and its phosphorylation sites enriched in different proteomic subtypes (Kruskal–Wallis test, p < 0.05). H The expression of FGFR3 in patients with or without FGFR3 mutation. I The pathways correlated with FGFR3 protein abundance. J Ranked co-phosphorylation signature of the mTOR pathway aligned with clinical features. K Summary of key FGFR3 mutation associated
Fig. 6
Fig. 6
Immune cell infiltration in UC tumors. A Heatmap illustrating cell-type compositions and activities of selected individual gene/proteins and pathways across the five immune clusters. The heatmap in the first section illustrates the immune/stromal signatures from xCell. The mRNA and protein abundance of key immune-related markers and ssGSEA scores based on global proteomics data for biological pathways upregulated in different immune groups are illustrated in the remaining sections. B xCell immune/stromal signatures in FGFR3 or ART1 mutations compared with WT. C Contour plot of two-dimensional density based on immunes core (y-axis) and stromal scores (x-axis) for different immune clusters. For each immune cluster, key upregulated pathways are enriched based on global proteomics (Kruskal–Wallis test, p < 0.05). D Kaplan–Meier curves for overall survival of different immune clusters (p value from log-rank test). E Heatmap of the comparison between immune clusters (columns) with proteomic subtypes and different peak events. Each row sums to one, with different blocks showing the proportion of tumors belonging to different immune clusters. F Volcano plot showing the correlation between different peak events and immune score. G Volcano plot showing the cis-effect genes on 9q34.3 (Spearman’s correlation coefficients, p < 0.05). Bigger bubbles showing genes with significant hazard ratio. H Heatmap showing the copy number alter, mRNA abundance, protein abundance of TRAF2. I Heatmap showing the estimated NFKB1 activity and the mRNA abundance of the targets, the middle red points indicate hazard ratios for each protein, and the endpoints represent lower or upper 95% confidence intervals. J TRAF2 was differentially expressed in PD-L1+ group and PD-L1-group. KL Boxplots show the quantification of the IHC results. M A model depicting the multi-level regulation of TRAF2 copy number alterations
Fig. 7
Fig. 7
Clinical outcomes associated with proteomics and phosphoproteomic profiles. A Heatmap showing the correlation between modules obtained from WGCNA analysis and clinical outcomes. B Enrichment pathway of different modules (Wilcoxon rank-sum test, p < 0.05). The dot plot on the left summarizes ssGSEA pathway scores based on proteomics data among samples with different histological variation statuses. C The ssGSEA pathway analysis of different histological variations (Wilcoxon rank-sum test, p < 0.05). D Signature proteins of pathways associated with different histological variations (Wilcoxon rank-sum test, p < 0.05). E Evaluation of kinase activities in tumors across different histological variation via KSEA. FH Diagram showing kinase–substrate associations among papillary, NOS, and differentiation variation tumors
Fig. 8
Fig. 8
GARS promotes bladder cancer cell proliferation through non-canonical function. A GARS was differentially expressed in tumors and MNUs (p value from Wilcoxon rank-sum test). B The expression levels of indicated proteins and global K-Gly in tumor tissues compared with those of adjacent normal tissues. C The pentose phosphate pathway was activated, while glycolysis was downregulated in GARS-overexpressing cells. D Global K-Gly levels in T24 and 5637 GARS-overexpressing cell lines. E Interaction between GARS and PGK1, and interaction between GARS and PKM2, in both 5637 and T24 cell lines detected by co-immunoprecipitation assays. F Interaction of GARS with PGK1 and PKM2 in the bladder cancer tumor tissues, detected by co-immunoprecipitation assays. G K-Gly levels of PGK1 and PKM2 in both 5637 and T24 GARS-overexpressing cells. H Enzymatic activities of PGK1 and PKM2 in T24 GARS-overexpressing cells. I Beta-alanine inhibits K-Gly formation. J The effect of beta-alanine and GARS on T24 cells xenografts in nude mice. K A model depicting the regulation of GARS

References

    1. Sung H, Ferlay J, Siegel RL, Laversanne M, Soerjomataram I, Jemal A, Bray F. Global Cancer Statistics 2020: GLOBOCAN estimates of incidence and mortality worldwide for 36 cancers in 185 countries. CA Cancer J Clin. 2021;71(3):209–249. doi: 10.3322/caac.21660. - DOI - PubMed
    1. Flaig TW, Spiess PE, Agarwal N, Bangs R, Boorjian SA, Buyyounouski MK, Chang S, Downs TM, Efstathiou JA, Friedlander T, et al. Bladder cancer, Version 3.2020, NCCN Clinical Practice Guidelines in Oncology. J Natl Compr Canc Netw. 2020;18(3):329–354. doi: 10.6004/jnccn.2020.0011. - DOI - PubMed
    1. Kamat AM, Hahn NM, Efstathiou JA, Lerner SP, Malmström PU, Choi W, Guo CC, Lotan Y, Kassouf W. Bladder cancer. Lancet. 2016;388(10061):2796–2810. doi: 10.1016/S0140-6736(16)30512-8. - DOI - PubMed
    1. Santoni G, Morelli MB, Amantini C, Battelli N. Urinary markers in bladder cancer: an update. Front Oncol. 2018;8:362. doi: 10.3389/fonc.2018.00362. - DOI - PMC - PubMed
    1. Ghandour R, Singla N, Lotan Y. Treatment options and outcomes in nonmetastatic muscle invasive bladder cancer. Trends Cancer. 2019;5(7):426–439. doi: 10.1016/j.trecan.2019.05.011. - DOI - PubMed

Publication types

MeSH terms