Meta-Analysis
. 2022 Jun 4;15(1):124.
doi: 10.1186/s12920-022-01281-1.

Genetics of early-life head circumference and genetic correlations with neurological, psychiatric and cognitive outcomes

Collaborators, Affiliations
Meta-Analysis

Genetics of early-life head circumference and genetic correlations with neurological, psychiatric and cognitive outcomes

Suzanne Vogelezang et al. BMC Med Genomics. .

Abstract

Background: Head circumference is associated with intelligence and tracks from childhood into adulthood.

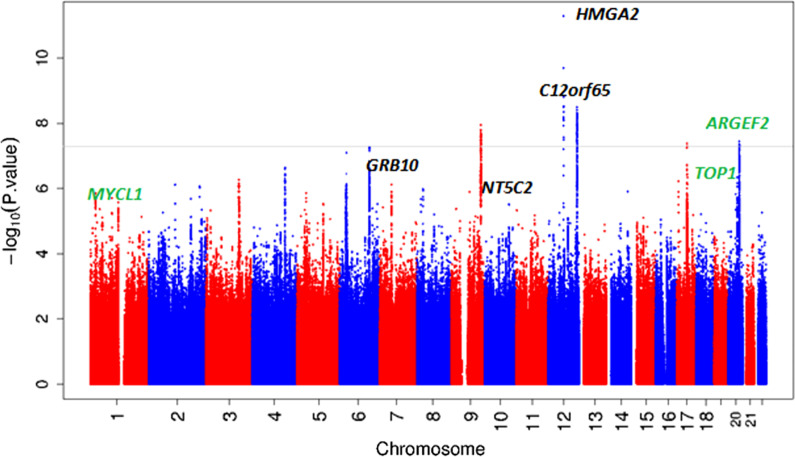
Methods: We performed a genome-wide association study meta-analysis and follow-up of head circumference in a total of 29,192 participants between 6 and 30 months of age.

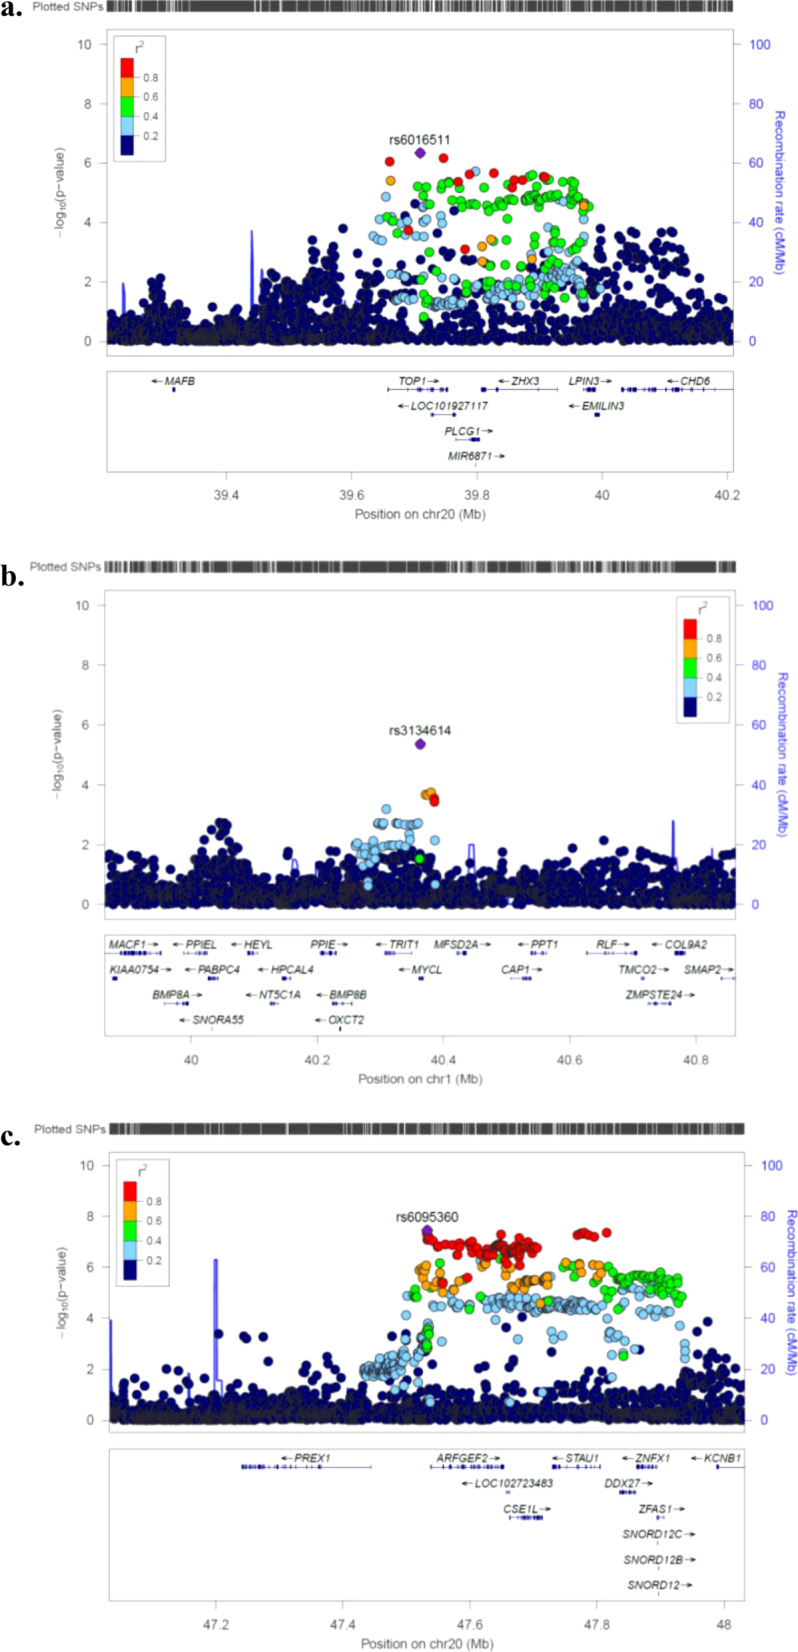
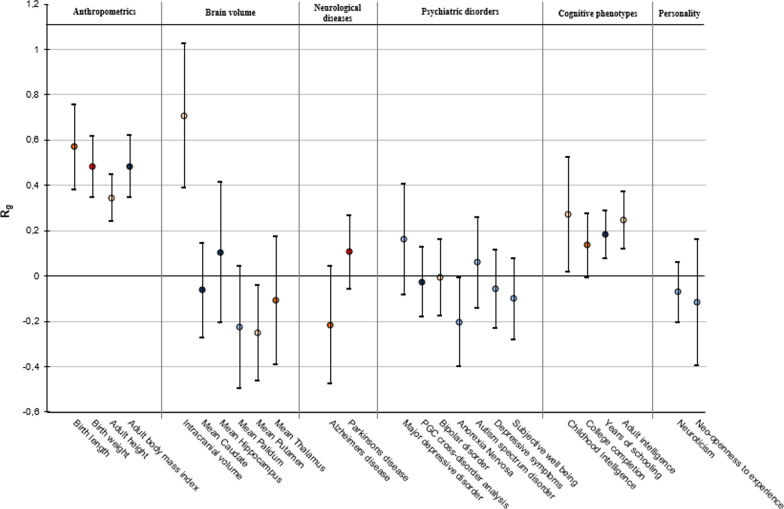
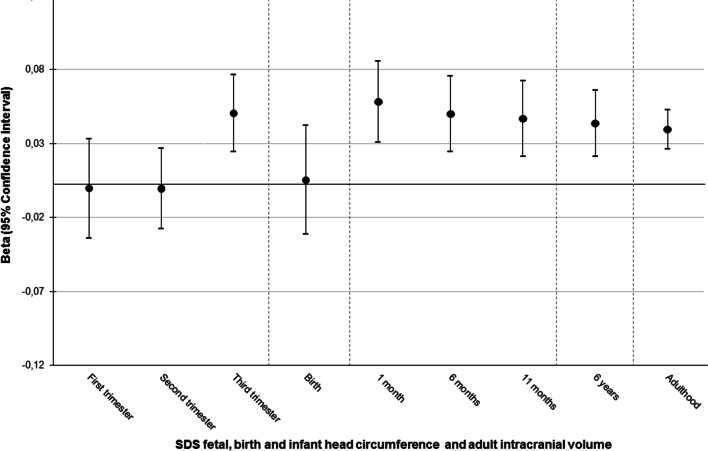
Results: Seven loci reached genome-wide significance in the combined discovery and replication analysis of which three loci near ARFGEF2, MYCL1, and TOP1, were novel. We observed positive genetic correlations for early-life head circumference with adult intracranial volume, years of schooling, childhood and adult intelligence, but not with adult psychiatric, neurological, or personality-related phenotypes.

Conclusions: The results of this study indicate that the biological processes underlying early-life head circumference overlap largely with those of adult head circumference. The associations of early-life head circumference with cognitive outcomes across the life course are partly explained by genetics.

Keywords: Genetic correlations; Genome-wide association study; Head circumference; Infancy.


Conflict of interest statement

MMcC: The views expressed in this article are those of the author(s) and not necessarily those of the NHS, the NIHR, or the Department of Health. He serves on advisory panels for Pfizer, NovoNordisk, Zoe Global; has received honoraria from Merck, Pfizer, NovoNordisk and Eli Lilly; has stock options in Zoe Global; has received research funding from Abbvie, Astra Zeneca, Boehringer Ingelheim, Eli Lilly, Janssen, Merck, NovoNordisk, Pfizer, Roche, Sanofi Aventis, Servier & Takeda. Ms Receives funding from Pfizer Inc. for a project not related to this research. The other authors declare that they have no competing interests.

Figures

Fig. 1
Fig. 1
Manhattan plot of results of the discovery meta-analysis of 21 GWAS. On the x-axis the chromosomes are shown. On the y-axis the − log 10 of the P value is shown. Novel SNPs are shown in green. Known SNPs are shown in black. The genome wide significance cutoff of 5 × 10–8 is represented by the grey dotted line
Fig. 2
Fig. 2
ac Locus zoom plots of the 3 novel loci. Shown are the results of the meta-analysis. Regional association plot of the 3 novel loci. SNPs are plotted with their P values from the discovery stage (as − log10; left y-axis) as a function of genomic position (x-axis). Estimated recombination rates (right y-axis) taken from 1000 Genomes, March 2012 release are plotted to reflect the local LD-structure around the top associated SNP (indicated with purple color) and the correlated proxies (indicated in colors)
Fig. 3
Fig. 3
Genome-wide genetic correlations between early-life head circumference and adult traits and diseases. On the x axis the traits and diseases are shown. The y-axis shows the genetic correlations (Rg) and corresponding standard errors, indicated by error bars, between early-life head circumference and each trait, estimated by LD score regression. The genetic correlation estimates (Rg) are colored according to their intensity and direction. Red indicates a positive correlation, blue indicates a negative correlation. References can be found in Additional file 1: Table S7
Fig. 4
Fig. 4
Associations of early-life head circumference genetic risk score with head circumference at different time points in the Generation R Study and from UK Biobank data. On the x axis the different ages are shown at which the genetic risk score of the seven early-life head circumference SNPs is tested. On the y axis the beta’s and 95% confidence intervals from linear regression analyses are shown. Detailed data can be found in Additional file 1: Table S15

References

    1. Tisserand DJ, Bosma H, Van Boxtel MP, Jolles J. Head size and cognitive ability in nondemented older adults are related. Neurology. 2001;56(7):969–971. doi: 10.1212/WNL.56.7.969. - DOI - PubMed
    1. Gale CR, O’Callaghan FJ, Bredow M, Martyn CN, Avon Longitudinal Study of P, Children Study T The influence of head growth in fetal life, infancy, and childhood on intelligence at the ages of 4 and 8 years. Pediatrics. 2006;118(4):1486–1492. doi: 10.1542/peds.2005-2629. - DOI - PubMed
    1. Bartholomeusz HH, Courchesne E, Karns CM. Relationship between head circumference and brain volume in healthy normal toddlers, children, and adults. Neuropediatrics. 2002;33(5):239–241. doi: 10.1055/s-2002-36735. - DOI - PubMed
    1. Kiserud T, Piaggio G, Carroli G, Widmer M, Carvalho J, Jensen LN, et al. Correction: The World Health Organization fetal growth charts: a multinational longitudinal study of ultrasound biometric measurements and estimated fetal weight. PLoS Med. 2021;18(1):e1003526. doi: 10.1371/journal.pmed.1003526. - DOI - PMC - PubMed
    1. Rollins JD, Collins JS, Holden KR. United States head circumference growth reference charts: birth to 21 years. J Pediatr. 2010;156(6):907–13.e2. doi: 10.1016/j.jpeds.2010.01.009. - DOI - PubMed

Publication types