. 2022 Jun 3;13(1):225.
doi: 10.1186/s13287-022-02888-y.

Sorafenib targets and inhibits the oncogenic properties of endometrial cancer stem cells via the RAF/ERK pathway

Affiliations

Sorafenib targets and inhibits the oncogenic properties of endometrial cancer stem cells via the RAF/ERK pathway

Tomoka Takao et al. Stem Cell Res Ther. .

Abstract

Background: Distinct subsets of cancer stem cells (CSCs) drive the initiation and progression of malignant tumors via enhanced self-renewal and development of treatment/apoptosis resistance. Endometrial CSC-selective drugs have not been successfully developed because most endometrial cell lines do not contain a sufficient proportion of stable CSCs. Here, we aimed to identify endometrial CSC-containing cell lines and to search for endometrial CSC-selective drugs.

Methods: We first assessed the presence of CSCs by identifying side populations (SPs) in several endometrial cancer cell lines. We then characterized cell viability, colony-formation, transwell invasion and xenotransplantion capability using the isolated SP cells. We also conducted real-time RT-PCR, immunoblot and immunofluorescence analyses of the cells' expression of CSC-associated markers. Focusing on 14 putative CSC-selective drugs, we characterized their effects on the proliferation and apoptosis of endometrial cancer cell lines, examining cell viability and annexin V staining. We further examined the inhibitory effects of the selected drugs, focusing on proliferation, invasion, expression of CSC-associated markers and tumor formation.

Results: We focused on HHUA cells, an endometrial cancer cell line derived from a well-differentiated endometrial adenocarcinoma. HHUA cells contained a sufficient proportion of stable CSCs with an SP phenotype (HHUA-SP). HHUA-SP showed greater proliferation, colony-formation, and invasive capabilities compared with the main population of HHUA cells (HHUA-MP). HHUA-SP generated larger tumors with higher expression of proliferation-related markers, Ki67, c-MYC and phosphorylated ERK compared with HHUA-MP when transplanted into immunodeficient mice. Among the 14 candidate drugs, sorafenib, an inhibitor of RAF pathways and multiple kinase receptors, inhibited cell proliferation and invasion in both HHUA-SP and -MP, but more profoundly in HHUA-SP. In vivo treatment with sorafenib for 4 weeks reduced the weights of HHUA-SP-derived tumors and decreased the expression of Ki67, ZEB1, and RAF1.

Conclusions: Our results suggest that HHUA is a useful cell line for discovery and identification of endometrial CSC-selective drugs, and that sorafenib may be an effective anti-endometrial cancer drug targeting endometrial CSCs.

Keywords: Cancer stem cells; Endometrial cancer; HHUA; Side-population; Sorafenib.


Conflict of interest statement

The authors declare that they have no competing interests.

Figures

Fig. 1
Fig. 1
Isolation and characterization of CSC-like cells from the human endometrial cancer cell line HHUA. A Flow cytometric determination of the distributions of the side population (SP) and main population (MP) in living HHUA cells stained with Hoechst 33342 in the absence (left) or presence (right) of reserpine. Treatment with 50 μM reserpine resulted in the disappearance of the SP fraction. B Expression of ABCG2, MDR1 and ACTB mRNAs in HHUA-SP and -MP cells as determined by qRT-PCR. Expression of MDR1 and CTNNB1 mRNAs in HHUA-SP and -MP cells as determined by real-time RT-PCR. C Proliferation of HHUA-SP and -MP cells as determined by MTS assay. Each point indicates the mean ± SEM absorbance at 490 nm obtained from three independent experiments using three individual samples. *, P < 0.05, vs. DMSO control, based on Student’s t-test. D Colony formation ability of HHUA-SP and -MP cells. HHUA-SP and -MP cells were cultured in the cloning plates as indicated and then stained with Giemsa solution. The bar graph shows the mean ± SEM colony number obtained from three independent experiments. *, P < 0.05, based on Student’s t-test. E Cell invasion ability of HHUA-SP and -MP cells as determined by cell invasion assay. Each bar indicates the mean ± SEM number of invading cells obtained from three independent experiments using three individual samples, *, P < 0.05, based on Student’s t-test. F Weight and gross appearance of tumors derived from HHUA-SP and -MP cells at 6 weeks after inoculation into the subcutaneous tissue of nude mice. Each dot indicates the tumor weight of an individual mouse. *, P < 0.05, based on Student’s t-test. Scale bars, 1 mm. G Hematoxylin and eosin and immunofluorescence staining of HHUA-SP or -MP-derived tumors using antibodies against vimentin (VM) and MDR1 or CTNNB1. DAPI was used for nuclear staining. Scale bars, 1 mm (yellow) and 200 μm (white)
Fig. 2
Fig. 2
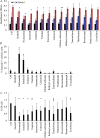
Effects of putative stem cell-selective candidate drugs on proliferation and apoptosis in HHUA cells. AC Effects of the candidate drugs on HHUA cell proliferation as determined by MTS assay (A), HHUA cell apoptosis was determined by annexin V-staining (B), and the percentage of HHUA-SP cells among all HHUA cells was determined by flow cytometric analysis. C Each bar indicates the mean ± SEM absorbance at 490 nm (A), the percentage of annexin V-positive cells (B), and the percentage of HHUA-SP cells among all HHUA cells C obtained from three independent experiments using three individual samples. *, P < 0.01, **, P < 0.02, and ***P < 0.05, versus DMSO control (Ctrl), based on Student’s t-test
Fig. 3
Fig. 3
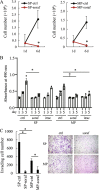
Sorafenib inhibition of HHUA cell properties and stem cell characteristics. A Reduction of HHUA-SP and -MP cell numbers by treatment with sorafenib (soraf), as determined using an automated cell counter. Each dot indicates the mean ± SEM obtained from three independent experiments using three individual samples. *, P < 0.05 vs. DMSO control (ctrl), based on Student’s t-test. B The effects of soraf and itraconazole (itrac) on HHUA-SP and -MP cell proliferation, as determined by the MTS assay. Each point indicates the mean ± SEM absorbance at 490 nm obtained from three independent experiments using three individual samples. *, P < 0.01, †, P < 0.02 versus each control, based on Student’s t-test. C Inhibition of HHUA-SP and -MP cell invasion by soraf. Each bar indicates the mean ± SEM number of invading cells obtained from three independent experiments using three individual samples. Images (insert) show representative Giemsa-stained membranes followed by treatment as indicated. *, P < 0.05 vs. DMSO control, based on Student’s t-test
Fig. 4
Fig. 4
Inhibition of in vivo tumor formation from HHUA-SP cells by long-term treatment with sorafenib. A Weight of tumors derived from HHUA-SP or -MP cells 2 weeks after oral treatment with or without sorafenib (soraf and ctrl, respectively). Before treatment, tumors formed 6 weeks after inoculation of HHUA-SP or -MP cells into the subcutaneous tissue of nude mice. Each dot indicates the tumor weight of an individual mouse. Images show representative tumors. *, P < 0.05, based on Student’s t-test. Scale bars, 1 mm. B Immunofluorescence staining of HHUA-SP-derived tumors treated as in A for 2 weeks using antibodies against VM and MDR1. DAPI was used for nuclear staining. Scale bars, 200 μm. C Immunofluorescence staining of HHUA-SP- and -MP-derived tumors treated as in A for 2 weeks using antibodies against VM and Ki67. DAPI was used for nuclear staining. Scale bars, 200 μm. D Weight or volume of tumors derived from HHUA-SP or -MP cells 4 weeks after treatment with or without sorafenib (soraf and ctrl, respectively). Tumor formation was assessed 6 weeks after inoculation of HHUA-SP or -MP cells into the subcutaneous tissue of nude mice. Each dot indicates the tumor weight of an individual mouse. Images show representative tumors. *, P < 0.05, based on Student’s t-test. Scale bars, 1 mm. E Immunofluorescence staining of HHUA-SP-derived tumors treated as in D for 4 weeks using antibodies against vimentin (VM) and MDR1. DAPI was used for nuclear staining. Scale bars, 200 μm. F Immunofluorescence staining of HHUA-SP- and -MP-derived tumors treated as in D for 4 weeks using antibodies against vimentin (VM) and Ki67. DAPI was used for nuclear staining. Scale bars, 200 μm
Fig. 5
Fig. 5
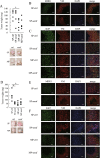
Effects of sorafenib on tumorigenesis-associated signaling pathways in vitro and in vivo. A Immunoblot analyses of RAF1, pERK, ERK, pAKT, AKT, c-MYC, cyclin D2, and α-tubulin in cultured HHUA-SP and -MP cells treated with or without sorafenib for 5 days. B Immunoblot analyses of RAF1, pERK, ERK, pAKT, AKT, c-MYC, cyclin D2, ZEB1, and α-tubulin in HHUA-SP- and -MP-derived tumors in mice treated orally with or without sorafenib for 4 weeks. C Each bar indicates the mean ± SEM relative density of each indicated protein obtained from three individual HHUA-SP- and -MP-derived tumor samples, as described in (B). The protein levels were normalized to that of α-tubulin. *, P < 0.01; †, P < 0.05, based on Student’s t-test
Fig. 6
Fig. 6
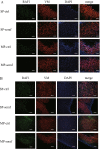
Effects of sorafenib on RAF1 expression in HHUA-SP- and -MP-derived tumors in mice. Immunofluorescence staining of RAF1 and VM in HHUA-SP- and -MP-derived tumors in mice treated orally with or without sorafenib for 2 weeks (A) or 4 weeks (B). DAPI was used for nuclear staining. Note that sorafenib decreased the expression of RAF1 in SP-derived tumors compared with the vehicle control after 4 weeks, which is consistent with the results shown in Fig. 5C. Scale bar, 200 μm.

References

    1. Lortet-Tieulent J, Ferlay J, Bray F, Jemal A. International patterns and trends in endometrial cancer incidence, 1978–2013. J Natl Cancer Inst. 2018;110(4):354–361. doi: 10.1093/jnci/djx214. - DOI - PubMed
    1. Siegel RL, Miller KD, Jemal A. Cancer statistics, 2020. CA Cancer J Clin. 2020;70(1):7–30. doi: 10.3322/caac.21590. - DOI - PubMed
    1. Brasseur K, Gevry N, Asselin E. Chemoresistance and targeted therapies in ovarian and endometrial cancers. Oncotarget. 2017;8(3):4008–4042. doi: 10.18632/oncotarget.14021. - DOI - PMC - PubMed
    1. Nassar D, Blanpain C. Cancer stem cells: basic concepts and therapeutic implications. Annu Rev Pathol. 2016;11:47–76. doi: 10.1146/annurev-pathol-012615-044438. - DOI - PubMed
    1. Ye X, Weinberg RA. Epithelial-mesenchymal plasticity: a central regulator of cancer progression. Trends Cell Biol. 2015;25(11):675–686. doi: 10.1016/j.tcb.2015.07.012. - DOI - PMC - PubMed

Publication types