. 2023 Mar:45:1-13.
doi: 10.1016/j.jare.2022.05.013. Epub 2022 May 31.

SCAP deficiency facilitates obesity and insulin resistance through shifting adipose tissue macrophage polarization

Affiliations

SCAP deficiency facilitates obesity and insulin resistance through shifting adipose tissue macrophage polarization

Jae-Ho Lee et al. J Adv Res. 2023 Mar.

Abstract

Introduction: Sterol regulatory element binding protein (SREBP) cleavage-associating protein (SCAP) is a sterol-regulated escort protein that translocates SREBPs from the endoplasmic reticulum to the Golgi apparatus, thereby activating lipid metabolism and cholesterol synthesis. Although SCAP regulates lipid metabolism in metabolic tissues, such as the liver and muscle, the effect of macrophage-specific SCAP deficiency in adipose tissue macrophages (ATMs) of patients with metabolic diseases is not completely understood.

Objectives: Here, we examined the function of SCAP in high-fat/high-sucrose diet (HFHS)-fed mice and investigated its role in the polarization of classical activated macrophages in adipose tissue.

Methods: Macrophage-specific SCAP knockout (mKO) mice were generated through crossbreeding lysozyme 2-cre mice with SCAP floxed mice which were then fed HFHS for 12 weeks. Primary macrophages were derived from bone marrow cells and analyzed further.

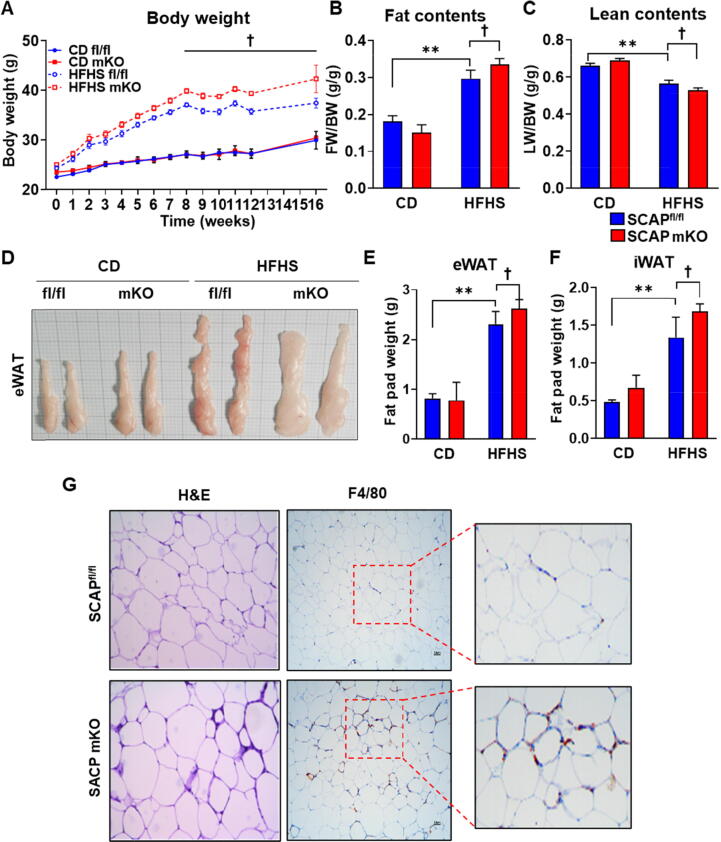
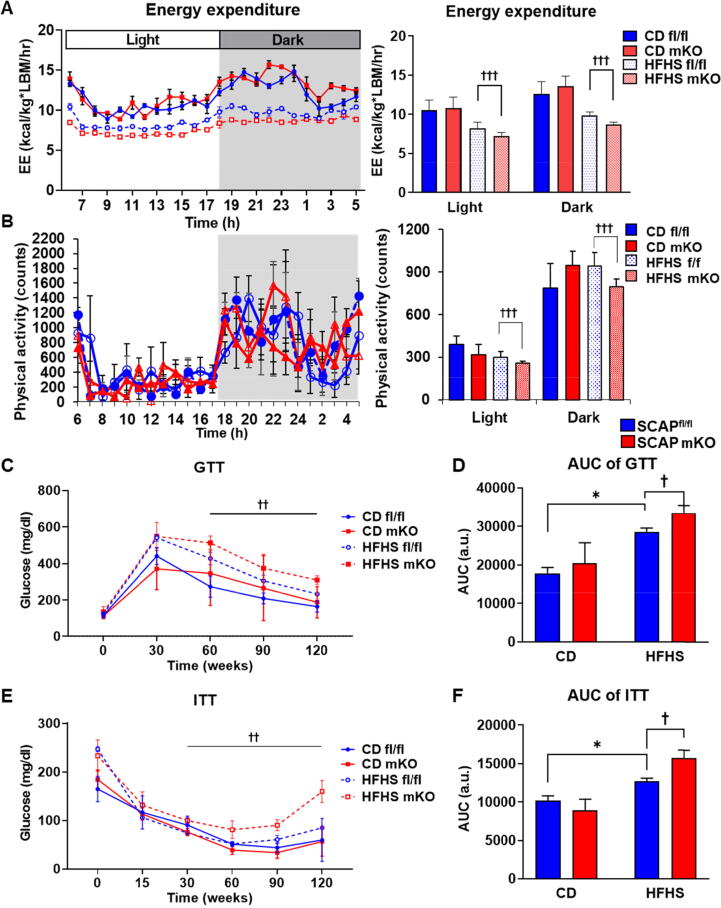
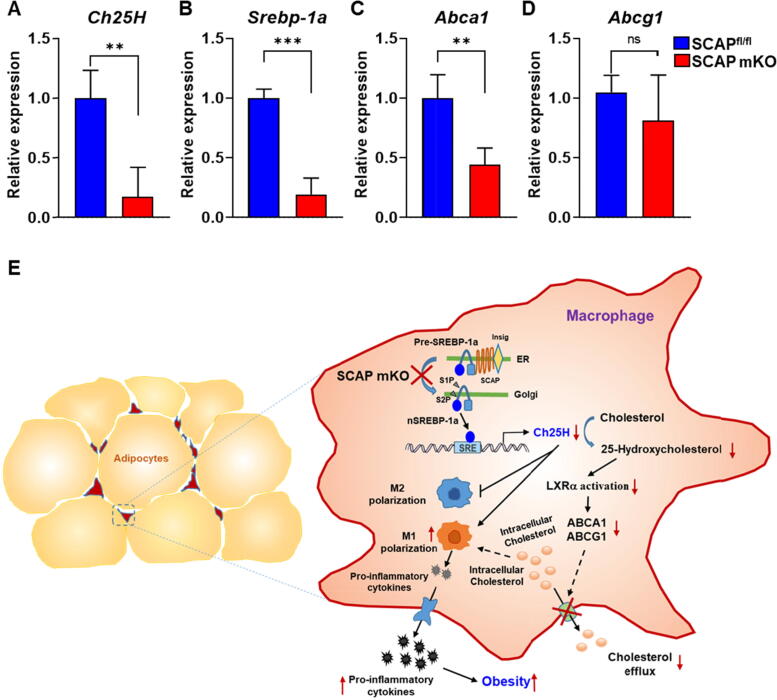
Results: We found that fat accumulation and the appearance of proinflammatory M1 macrophages were both higher in HFHS-fed SCAP mKO mice relative to floxed control mice. We traced the effect to a defect in the lipopolysaccharide-mediated increase in SREBP-1a that occurs in control but not SCAP mKO mice. Mechanistically, SREBP-1a increased expression of cholesterol 25-hydroxylase transcription, resulting in an increase in the production of 25-hydroxycholesterol (25-HC), an endogenous agonist of liver X receptor alpha (LXRα) which increased expression of cholesterol efflux to limit cholesterol accumulation and M1 polarization. In the absence of SCAP mediated activation of SREBP-1a, increased M1 macrophage polarization resulted in reduced cholesterol efflux downstream from 25-HC-dependent LXRα activation.

Conclusion: Overall, the activation of the SCAP-SREBP-1a pathway in macrophages may provide a novel therapeutic strategy that ameliorates obesity by controlling cholesterol homeostasis in ATMs.

Keywords: Cholesterol 25-hydroxylase; Cholesterol efflux; Macrophages; SCAP; White adipose tissue.


Conflict of interest statement

Declaration of Competing Interest The authors declare that they have no known competing financial interests or personal relationships that could have appeared to influence the work reported in this paper.

Figures

None
Graphical abstract
Fig. 1
Fig. 1
Macrophage SCAP ablation increased body weight and fat mass. (A) Body weight of SCAPfl/fl and SCAP mKO mice fed normal chow diet (CD) or high-fat high-sucrose (HFHS) diets for 16 weeks (n = 6 per each group). (B and C) Fat and lean body mass were normalized by body weight. (D) Representative images of epididymal white adipose tissue (eWAT) from CD or HFHS diet-fed SCAPfl/fl and SCAP mKO mice. SCAPfl/fl and SCAP mKO mice (n = 6 per group) were fed either CD or HFHS diets for 16 weeks. (E) The weight of eWAT. (F) The weight of inguinal white adipose tissue (iWAT). (G) Hematoxylin and eosin (H&E) staining or immunohistochemistry using anti-F4/80 on eWAT sections (5 μm) of SCAPfl/fl and SCAP mKO mice exposed to HFHS diets for 16 weeks. The regions within the squares are enlarged on the right. Values are expressed as mean ± SEM. **p < 0.01 compared to CD-fed SCAPfl/fl mice. p < 0.05 compared to HFHS-fed SCAPfl/fl mice.
Fig. 2
Fig. 2
Macrophage SCAP deletion promoted diet-induced insulin resistance. (A) Energy expenditure (EE) over 24 h period using metabolic cages. SCAPfl/fl and SCAP mKO mice fed CD or HFHS diet. Average EE over the light and dark phases (right panel). (B) Metabolic cage studies were performed in a CD or a HFHS diet fed SCAPfl/fl or SCAP mKO mice. The physical activity and average physical activity during indicated period (right panel). (C) Glucose tolerance test (GTT) of SCAPfl/fl and SCAP mKO mice after 16 weeks on CD or HFHS diet. (D) Quantification of GTT area under the curve (AUC). (E) Insulin tolerance test (ITT) of SCAPfl/fl and SCAP mKO mice after 16 weeks on CD or HFHS diets. (F) Quantification of ITT AUC. Values are expressed as mean ± SEM. *p < 0.05 compared to CD-fed SCAPfl/fl mice. p < 0.05, ††p < 0.01 and †††p < 0.001 compared to HFHS-fed SCAPfl/fl mice.
Fig. 3
Fig. 3
SCAP deficiency in macrophages increased M1 polarization in eWAT of HFHS diet-fed SCAP mKO mice. SCAPfl/fl and SCAP mKO mice (n = 6 per each group) were fed either CD or HFHS diet for 16 weeks. (A) mRNA levels of M1 macrophage markers, F4/80, Mcp1, and CD11c in eWAT. (B) Gene expression levels of M2 macrophage markers, such as IL-10, CD206, Clec10a, and Fizz1 in the eWAT were assessed using qPCR. The Ct values obtained were normalized to that of L32. (C) SCAPfl/fl and SCAP mKO mice were fed either CD or HFHS diet for 16 weeks. The macrophage composition of the SVFs prepared from eWAT was analyzed using FACS. Flow cytometric analysis of CD11c population in CD11b+ F4/80+ cells among SVF cells of eWAT. (D) Representative flow cytometry histograms showing CD11b and CD11c population in SVF cells of eWAT. (E) Quantitative analyses of M1 (CD11b+CD11c+) and M2 macrophages (CD11b+ CD11c). Values are expressed as mean ± SEM. *p < 0.05 and **p < 0.01 compared to CD-fed SCAPfl/fl mice. p < 0.05 and ††p < 0.01 compared to HFHS-fed SCAPfl/fl mice. SVF: stromal vascular fractions.
Fig. 4
Fig. 4
Abrogation of SCAP increased M1 but decreased M2 polarization of macrophages. (A) Relative mRNA expression levels of M1 macrophage marker genes. BMDMs from SCAPfl/fl and SCAP mKO mice (n = 3 per group) were treated with 100 ng/ml LPS for 24 h. qPCR was used for analyzing IL-12β, IL-6, and IL-1β mRNA expression. (B) IL-1β secretion level in BMDMs of SCAPfl/fl and SCAP mKO mice. BMDM were treated with LPS for 6 h, followed by incubation with 1 mM ATP for 30 min. IL-1β secretion levels were measured using ELISA. (C) Relative mRNA expression levels of M2 macrophage marker genes. BMDMs were treated with 20 ng/ml IL-4 for 24 h. qPCR was used for analyzing Fizz1, Arg1, CD206, IL-10, and Clec10a mRNA expression. (D) Flow cytometric analysis of BMDMs after incubation with LPS (100 ng/ml). SCAPfl/fl and SCAP KO BMDMs (n = 3 per group) were treated with 100 ng/ml LPS for 24 h. Flow cytometric analysis of F4/80 and CD86 population. (E) Flow cytometric analysis data for M2 polarization. BMDMs were treated with 20 ng/mL IL-4 for 24 h. Flow cytometric analysis of F4/80 and CD206 population. (F) The percentage of F4/80+CD86+ cells. (G) The percentage of F4/80+CD206+ cells. Values are expressed as mean ± SEM. Representative results from three repeated experiments are shown. *p < 0.05, **p < 0.01 and ***p < 0.001 compared to Mock SCAPfl/fl mice. p < 0.05 compared to LPS- or IL-4-treated SCAPfl/fl mice.
Fig. 5
Fig. 5
SCAP regulates the expression of cholesterol efflux-related genes via regulation of SREBP-1a. (A) qPCR analysis of Scap mRNA expression in SCAPfl/fl and SCAP KO BMDMs (n = 3 per group). Results were normalized to L32 mRNA and relative Scap mRNA levels are presented. (B) qPCR analysis of Srebp-1a, −1c, and −2 mRNA expression in BMDMs. (C) Precursor and mature forms of SREBP-1 in LPS-treated BMDMs. BMDMs were incubated with medium or LPS (100 ng/ml) for 24 h. Protein levels of nuclear SREBP-1 were analyzed using immunoblotting (left panel), quantified using ImageJ software, and normalized using GAPDH levels (right panel). (D) mRNA levels of SREBP target genes such as Fas, Acc1, Red, and Scd1 were measured using qPCR. (E) mRNA expression levels of Abca1 and Abcg1. mRNA levels of Abca1 and Abcg1 in SCAPfl/fl and SCAP KO BMDMs were determined using qPCR. (F) Immunoblot analysis for determining ABCA1 and ABCG1 protein levels. Protein samples were prepared from SCAPfl/fl and SCAP KO BMDMs. (G and H) mRNA expression in BMDMs of SCAPfl/fl and SCAP mKO mice (n = 6 each group) infected with adenoviruses for GFP (ad-GFP), SREBP-1a (ad-SR-1a), SREBP-1c (ad-SR-1c), and SREBP-2 (ad-SR-2). qPCR analysis for Abca1 A and Abcg1 B expression. (I and J) mRNA expression of Abca1 and Abcg1. BMDMs of WT and 1aDF mice were infected with ad-GFP or ad-SR-1a for 72 h. *p < 0.05 and **p < 0.01 compared to Mock SCAPfl/fl mice and ad-GFP group. ††p < 0.01 compared to LPS-treated SCAPfl/fl mice. (For interpretation of the references to colour in this figure legend, the reader is referred to the web version of this article.)
Fig. 6
Fig. 6
Ch25H is the putative target of SREBP in SCAP mKO. (A) Ch25H gene expression levels in BMDMs. BMDM were incubated with 100 ng/ml LPS for 24 h. (B) The expression levels of the Ch25H gene by overexpression of SREBP isoforms in BMDMs. Ch25H mRNA expression was assessed using qPCR in the BMDMs infected with adenoviruses harboring ad-GFP, ad-SR-1a, ad-SR-1c, and ad-SR-2. (C) mRNA level of Ch25H in LPS-treated BMDMs extracted from WT, 1aDF, and 1cKO mice. (D) Representative filipin staining of SCAPfl/fl and SCAP KO BMDMs (left). Quantification of the filipin staining intensity (right). (E) Filipin expression in BMDMs from WT and 1aDF mice (left). Quantification of filipin immunofluorescence intensity in BMDMs (right). BMDMs were incubated with 100 ng/ml LPS for 24 h. (F) The putative SREBP-1 response element (SRE) on mouse Ch25H gene promoter. The locations of the three highly conserved SREs from the transcription start site are indicated. (G) Ch25H promoter activity. Plasmid constructs of mouse Ch25H gene promoter was transiently transfected into HEK 293 T cells, and the luciferase assay was performed. (H and I) ChIP assay for SREBP-1 binding on chromatin from SCAPfl/fl and SCAP KO BMDMs. Chromatin from BMDMs was analyzed for recruitment of SREBP-1 to the SRE region of mouse Ch25H promoter using ChIP assay. Values are expressed as mean ± SEM. *p < 0.05, **p < 0.01, and ***p < 0.001 compared to Mock WT or SCAPfl/fl mice, ad-GFP group, or pcDNA group. p < 0.05, ††p < 0.01, and †††p < 0.001 compared to LPS-treated WT or SCAPfl/fl mice.
Fig. 7
Fig. 7
Deficiency of SCAP regulation in macrophages reduces intracellular cholesterol content via suppression of Ch25H gene expression in eWAT. SCAPfl/fl and SCAP mKO mice (n = 5 per group) were fed HFHS diets for 16 weeks. (A-D) Relative mRNA expression levels of Ch25H, Srebp-1a, Abca1, and Abcg1. The macrophage gene expression of the SVFs isolated from eWAT was analyzed using qPCR. (E) Proposed mechanism for SCAP in macrophage polarization of adipose tissue in metabolic diseases. Values are expressed as mean ± SEM. **p < 0.01 and ***p < 0.001 compared to SCAPfl/fl mice.

References

    1. Hill A.A., Reid Bolus W., Hasty A.H. A decade of progress in adipose tissue macrophage biology. Immunol Rev. 2014;262(1):134–152. doi: 10.1111/imr.12216. - DOI - PMC - PubMed
    1. Lumeng C.N., Saltiel A.R. Inflammatory links between obesity and metabolic disease. J Clin Invest. 2011;121(6):2111–2117. doi: 10.1172/JCI57132. - DOI - PMC - PubMed
    1. Murray P.J., Wynn T.A. Protective and pathogenic functions of macrophage subsets. Nat Rev Immunol. 2011;11(11):723–737. doi: 10.1038/nri3073. - DOI - PMC - PubMed
    1. Mantovani, A., Sica, A., Locati M. Macrophage polarization comes of age. Immunity. 2005;23(4):344–346. doi: 10.1016/j.immuni.2005.10.001. - DOI - PubMed
    1. Martinez F.O., Sica A., Mantovani A., Locati M. Macrophage activation and polarization. Front Biosci. 2008;13:453–461. doi: 10.2741/2692. - DOI - PubMed

Publication types

Substances

LinkOut - more resources