. 2022 Aug:62:101524.
doi: 10.1016/j.molmet.2022.101524. Epub 2022 Jun 2.

DNA damage to β cells in culture recapitulates features of senescent β cells that accumulate in type 1 diabetes

Affiliations

DNA damage to β cells in culture recapitulates features of senescent β cells that accumulate in type 1 diabetes

Gabriel Brawerman et al. Mol Metab. 2022 Aug.

Abstract

Objective: Type 1 Diabetes (T1D) is characterized by progressive loss of insulin-producing pancreatic β cells as a result of autoimmune destruction. In addition to β cell death, recent work has shown that subpopulations of β cells acquire dysfunction during T1D. We previously reported that β cells undergoing a DNA damage response (DDR) and senescence accumulate during the pathogenesis of T1D. However, the question of how senescence develops in β cells has not been investigated.

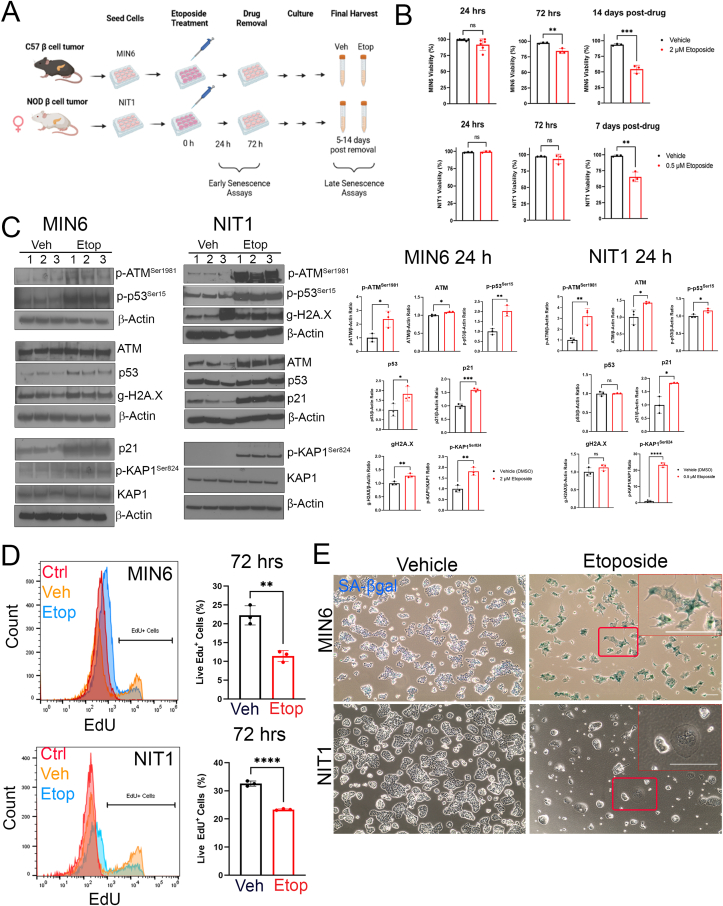
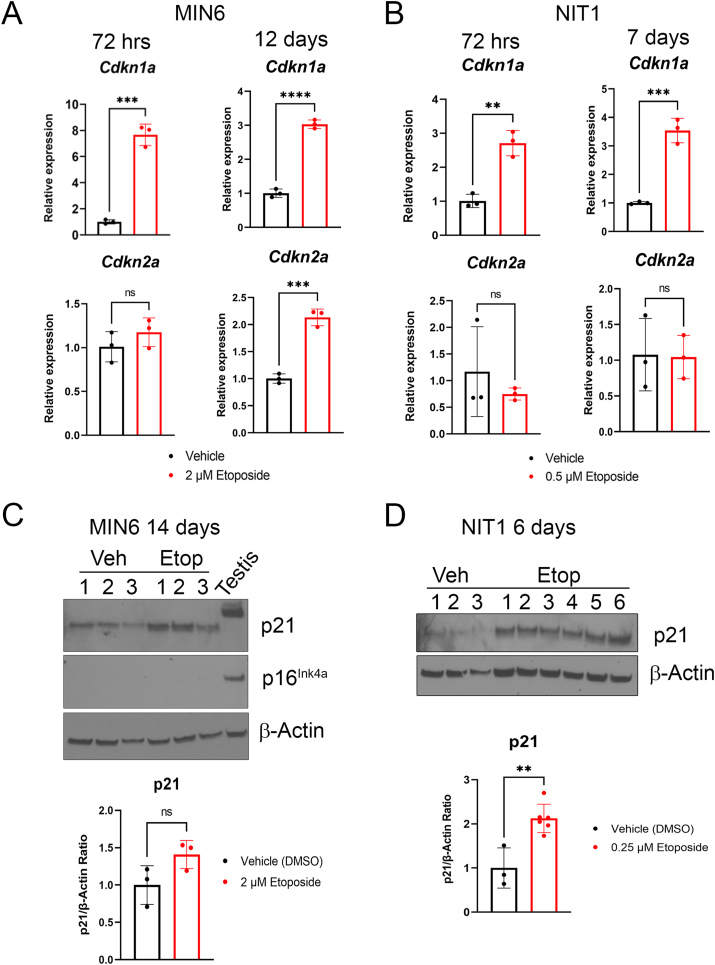
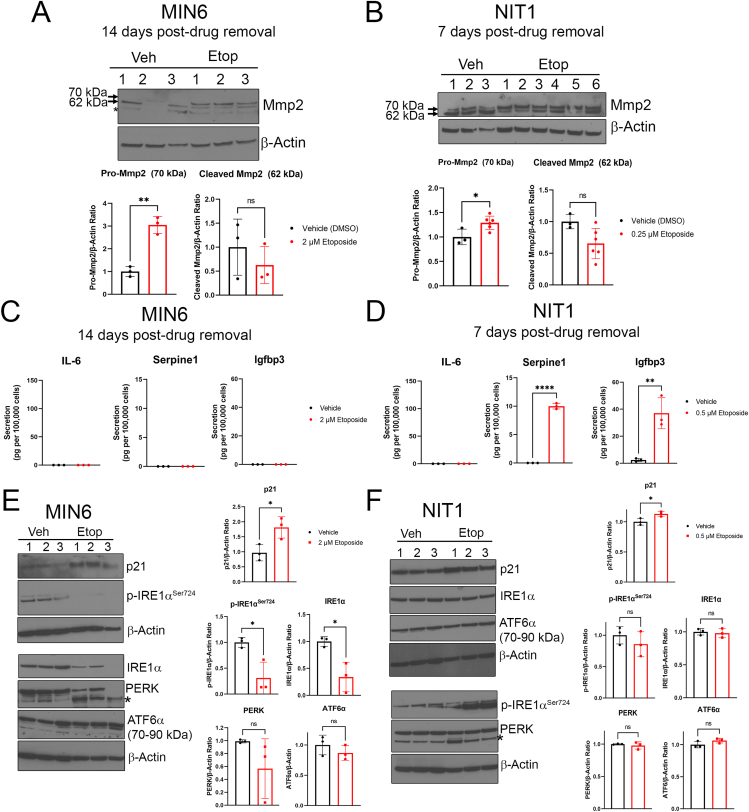
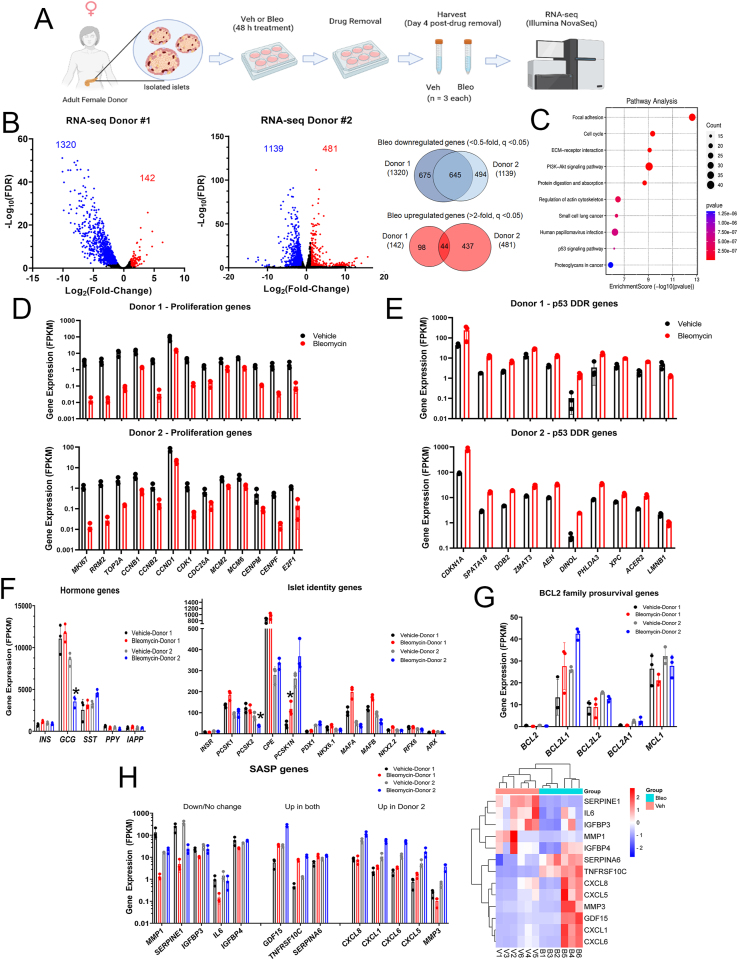
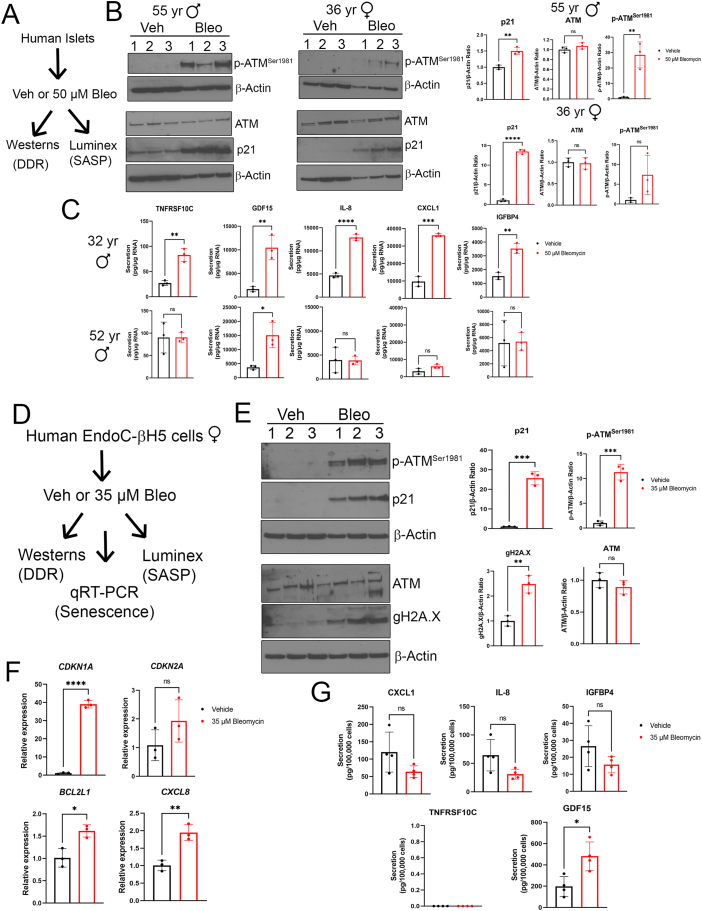
Methods: Here, we tested the hypothesis that unrepaired DNA damage in the context of genetic susceptibility triggers β cell senescence using culture models including the mouse NIT1 β cell line derived from the T1D-susceptible nonobese diabetic (NOD) strain, human donor islets and EndoC β cells. DNA damage was chemically induced using etoposide or bleomycin and cells or islets were analyzed by a combination of molecular assays for senescence phenotypes including Western blotting, qRT-PCR, Luminex assays, flow cytometry and histochemical staining. RNA-seq was carried out to profile global transcriptomic changes in human islets undergoing DDR and senescence. Insulin ELISAs were used to quantify glucose-stimulated insulin secretion from chemically-induced senescent human islets, EndoC β cells and mouse β cell lines in culture.

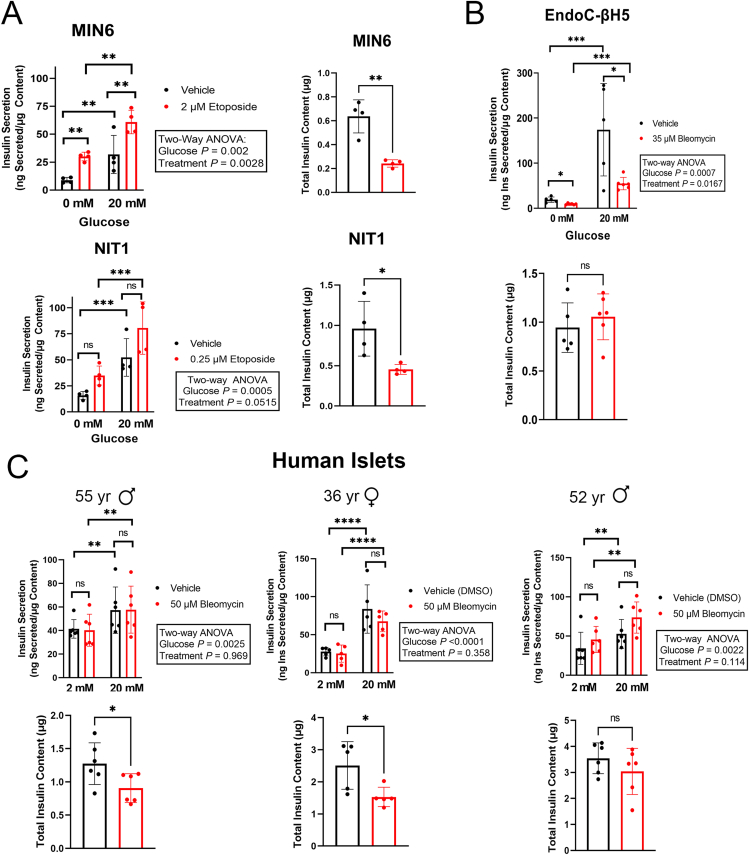
Results: Sub-lethal DNA damage in NIT1 cells led to several classical hallmarks of senescence including sustained DDR activation, growth arrest, enlarged flattened morphology and a senescence-associated secretory phenotype (SASP) resembling what occurs in primary β cells during T1D in NOD mice. These phenotypes differed between NIT1 cells and the MIN6 β cell line derived from a non-T1D susceptible mouse strain. RNA-seq analysis of DNA damage-induced senescence in human islets from two different donors revealed a p53 transcriptional program and upregulation of prosurvival and SASP genes, with inter-donor variability in this response. Inter-donor variability in human islets was also apparent in the extent of persistent DDR activation and SASP at the protein level. Notably, chemically induced DNA damage also led to DDR activation and senescent phenotypes in EndoC-βH5 human β cells, confirming that this response can occur directly in a human β cell line. Finally, DNA damage led to different effects on glucose-stimulated insulin secretion in mouse β cell lines as compared with human islets and EndoC β cells.

Conclusions: Taken together, these findings suggest that some of the phenotypes of senescent β cells that accumulate during the development of T1D in the NOD mouse and humans can be modeled by chemically induced DNA damage to mouse β cell lines, human islets and EndoC β cells in culture. The differences between β cells from different mouse strains and different human islet donors and EndoC β cells highlights species differences and the role for genetic background in modifying the β cell response to DNA damage and its effects on insulin secretion. These culture models will be useful tools to understand some of the mechanisms of β cell senescence in T1D.

Keywords: DNA damage response; Pancreatic β cells; Senescence; Type 1 diabetes.


Figures

Figure 1
Figure 1
Sub-lethal DNA damage with etoposide induces DDR, growth arrest and senescent morphology in MIN6 and NIT1 cells. (A) MIN6 or NIT1 cells were seeded and treated with etoposide (2 μM for MIN6, 0.5 μM for NIT1 throughout) or vehicle control (DMSO) for 72 h. Drug was removed by changing cells into fresh media, and cells were cultured an additional 5–14 days before final harvests. Early senescence phenotypes were monitored at 24–72 h post-etoposide treatment and late phenotypes were assayed at 5–14 days post drug removal. B) Cell viability was scored at 24 or 72 h after etoposide treatment and 7 or 14 days post-drug removal. Data are mean ± SD of n = 3–6 biological replicates. C) Western blot analysis and relative quantifications of DDR markers in MIN6 and NIT1 cells at 24 h post etoposide (2 μM or 0.5 μM, respectively) or vehicle treatment. Data are mean ± SD of n = 3 biological replicates. D) EdU labeling flow cytometry assay for DNA replication at 72 h post-etoposide or vehicle control treatment of MIN6 or NIT1 cells. ‘Ctrl’ indicates a no EdU negative control population of cells. Data are mean ± SD of n = 3 biological replicates. E) Representative images of Xgal staining for SA-βgal activity in MIN6 and NIT1 cells at day 5 post-drug removal. Scale bar = 30 μm. Insets show zoomed in regions, scale bars = 60 μm ∗p < 0.05, ∗∗p < 0.005, ∗∗∗p < 0.0005, ∗∗∗∗p < 0.00005, unpaired two-tailed T-tests.
Figure 2
Figure 2
Induction of Cdkn1a but not Cdkn2a at mRNA and protein level in etoposide treated MIN6 and NIT1 cells. A) qRT-PCR analysis of Cdkn1a and Cdkn2a expression normalized to Gapdh in MIN6 cells at 72 h post-etoposide (2 μM) or vehicle treatment or 14 days post-drug removal (as from Fig. 1). Data are mean ± SD of n = 3 biological replicates. B) qRT-PCR analysis as in B) except on NIT1 cells at 72 h and 7 days post-drug removal. Etoposide was used at 0.5 μM. C) Western blot of p21 and p16Ink4a on whole cell extracts from MIN6 cells treated with 2 μM etoposide or vehicle control 12 days post-drug removal, Actin was a loading control and whole cell extract from 3 month old C57BL6 mouse testes was a positive control for p21 and p16. Data are mean ± SD of n = 3 biological replicates. D) Western blot of p21 on whole cell extracts from NIT1 cells treated with 0.25 μM etoposide or vehicle at 6 days post-drug removal. Data are mean ± SD of n = 3 biological replicates. For all panels, ∗p < 0.05, ∗∗p < 0.005, ∗∗∗p < 0.0005, ns = not significant, two-tailed T-tests.
Figure 3
Figure 3
Differences in SASP and altered UPR in MIN6 and NIT1 cells following etoposide treatment. A) and B) Western blot analysis of Pro-Mmp2 (70 kDa) and cleaved/activated Mmp2 (62 kDa) on whole cell extracts from MIN6 or NIT1 cells treated with vehicle or etoposide as indicated (2 μM or 0.5 μM, respectively). Quantification shows relative Pro-Mmp2 or Cleaved Mmp2 to Actin, mean ± SD of n = 3 biological replicates. C) and D) Luminex assay of secreted SASP factors IL-6, Serpine1 and Igfbp3 in serum-free conditioned media from MIN6 or NIT1 cells treated as indicated at timepoints indicated. Data are mean ± SD from n = 3 biological replicates. E) and F) Western blot analysis of UPR mediators phosphorylated and total IRE1α, total PERK and total ATF6α in MIN6 and NIT1 cells at 72h post-treatment with etoposide (2 μM or 0.5 μM, respectively). p21 levels were used as a positive control and β-Actin was a loading control. Data are mean ± SD of n = 3 biological replicates. Asterisk on the blots indicates a non-specific band for the PERK blots. For all panels, ∗p < 0.05, ∗∗p < 0.005, ∗∗∗p < 0.0005, ns = not significant, two-tailed T-tests.
Figure 4
Figure 4
RNA-seq analysis reveals activation of the p53 transcriptional program during senescence in human islets. A) Overview of human islet DNA damage-induced senescence model. Islets isolated from a 44-year-old female donor (Donor 1) or from a 50-year-old female donor (Donor 2) were rested overnight and then divided into a total of 6 wells and cultured in the presence of vehicle (DMSO) or 50 μM bleomycin for 48 h (n = 3 biological replicates per group). The islets were then transferred to fresh drug-free media and cultured an additional 4 days prior to harvesting for RNA extraction and paired-end RNA-seq. B) Volcano plots of differentially expressed genes (fold-change cut-off and FDR <0.05) found indicating 1320 genes downregulated <0.5-fold and 142 genes upregulated >2-fold in bleomycin treated islets compared to controls from Donor 1 and 1139 genes downregulated and 480 genes upregulated from Donor 2. 645 genes were downregulated in common and 44 genes were upregulated in common in bleomycin-treated islets from both donors. C) Significant KEGG pathway terms of common differentially expressed genes from Donor 1 and Donor 2. D) Plot of normalized expression levels (FPKM) of selected significantly downregulated proliferation and cell cycle genes from Donor 1 and Donor 2. E) Plot of normalized expression levels of selected significantly upregulated p53 target genes and early senescence gene LMNB1 from Donor 1 and Donor 2. F) Plot of normalized expression levels of selected islet hormone genes, islet cell identity and hormone processing genes from Donor 1 (black and red bars) and Donor 2 (grey and blue bars). Only genes with an asterisk were found to be significantly different in expression. G) Plot of normalized expression levels of BCL-2 family anti-apoptotic genes from Donor 1 and Donor 2. H) Plot of normalized expression of selected significantly downregulated/unchanged SASP genes (Down/No change), SASP genes that were significantly upregulated in both Donors (Up in both), and SASP genes significantly upregulated only in Donor 2 but not Donor 1 (Up in Donor 2). Unsupervised hierarchal clustering heatmap of SASP gene normalized expression values (FPKM). Legend shows Row Z-score values. V1, V2, V3 and B1, B2, B3 were Vehicle-treated or Bleomycin-treated biological replicates from Donor 1. V4, V5, V6 and B4, B5, B6 are Vehicle-treated or Bleomcyin-treated biological replicates from Donor 2. For all barchart plots, data shown are mean ± SD of the n = 3 biological replicates in the RNA-seq datasets per sample group for each donor.
Figure 5
Figure 5
DDR and SASP activation in senescent human islets and the EndoC-βH5 human β cell line. A) Overview of experiment on human islets. Islets from four different adult donors (ages 55, 36, 32 and 52) were treated as indicated with vehicle (DMSO) or 50 μM bleomycin for 48 h and cultured in drug-free media for an additional 4 or 5 days and harvested for either Western blot (2 donors) or Luminex assays (2 donors). B) Western blot analysis of persistent DDR on vehicle (DMSO) and bleomycin-treated islets from a 55-year-old male and a 36-year-old female at day 4 post-drug removal. Data are means ± SD of n = 3 biological replicates. C) Luminex assays for indicated SASP factors in the conditioned media from islets treated as in (A) from a 32-year-old male donor and 52-year-old male donor at day 5 post-drug removal. Data are normalized to islet RNA content and are means ± SD of n = 3 biological replicates. D) Overview of experiment on human female fetal-derived EndoC-βH5 cells. Cells were treated as indicated with 35 μM bleomycin or vehicle (DMSO) for 48 h, and then harvested for assays or cultured for an additional 2-5 days in drug-free media. Western blotting was carried out on cells after the 48 h after treatment, qRT-PCR was carried out 2 days after drug removal and Luminex assays were carried out 5 days after drug removal. E) Western blot analysis of DDR and early senescence markers in EndoC cells treated as indicated after 48 h in drug-containing media or vehicle media. Data are means ± SD of n = 3 biological replicates. F) qRT-PCR analysis of senescence genes CDKN1A, CDKN2A, prosurvival gene BCL2L1 (encoding BCL-XL) and SASP gene CXCL8 (encoding IL-8) in EndoC cells treated as in (A) at day 2 post-drug removal. Data are means ± SD of n = 3 biological replicates. G) Luminex assays of indicated SASP factors in the conditioned media from EndoC cells treated as in (A) at day 5 post-drug removal. Data are normalized to viable cell counts and are means ± SD of n = 4 biological replicates. For all panels, ∗p < 0.05, ∗∗p < 0.005, ∗∗∗p < 0.0005, two-tailed T-tests.
Figure 6
Figure 6
Impact of DNA damage-induced senescence on GSIS and insulin content in mouse β cell lines, human EndoC-βH5 cells and human islets. A) GSIS assays and total insulin content of MIN6 or NIT1 cells treated with vehicle or etoposide (2 μM or 0.5 μM, respectively) at 72 h post-treatment. Data are means ± SD of n = 4 biological replicates. B) GSIS assays and total insulin content of EndoC-βH5 cells treated with vehicle or bleomycin (35 μM) for 72 h to induce senescence and cultured for 2 days in fresh drug free media before harvest at the day 2 post-drug removal time-point. Data are means ± SD of n = 5 biological replicates for vehicle samples or n = 6 biological replicates for bleomycin samples. C) GSIS assays and total insulin content of human islets from the three indicated donors treated with vehicle or 50 μM bleomycin for 48 h and then cultured in drug free media for 5 days and harvested at day 5 post-drug removal. Data are means ± SD of n = 5 or 6 biological replicates for each donor experiment. For GSIS panels, ∗p < 0.05, ∗∗p < 0.005, ∗∗∗p < 0.0005, Two-way ANOVAs. For Insulin content panels, ∗p < 0.05, ∗∗p < 0.005, two-tailed T-tests.

Similar articles

Cited by

References

    1. Katsarou A., Gudbjornsdottir S., Rawshani A., Dabelea D., Bonifacio E., Anderson B.J., et al. Type 1 diabetes mellitus. Nature Reviews Disease Primers. 2017;3 doi: 10.1038/nrdp.2017.16. - DOI - PubMed
    1. Eizirik D.L., Pasquali L., Cnop M. Pancreatic β-cells in type 1 and type 2 diabetes mellitus: different pathways to failure. Nature Reviews Endocrinology. 2020;16(7):349–362. doi: 10.1038/s41574-020-0355-7. - DOI - PubMed
    1. Roep B.O., Thomaidou S., Tienhoven R. van., Zaldumbide A. Type 1 diabetes mellitus as a disease of the β- cell (do not blame the immune system?) Nature Reviews Endocrinology. 2020;17(3):150–161. doi: 10.1038/s41574-020-00443-4. - DOI - PMC - PubMed
    1. Sahin G.S., Lee H., Engin F. An accomplice more than a mere victim: the impact of β-cell ER stress on type 1 diabetes pathogenesis. Molecular Metabolism. 2021:101365. doi: 10.1016/j.molmet.2021.101365. - DOI - PMC - PubMed
    1. Ovalle F., Grimes T., Xu G., Patel A.J., Grayson T.B., Thielen L.A., et al. Verapamil and beta cell function in adults with recent-onset type 1 diabetes. Nature Medicine. 2018;24(8):1108–1112. doi: 10.1038/s41591-018-0089-4. - DOI - PMC - PubMed

Publication types