. 2022 Jul 11;40(7):720-737.e5.
doi: 10.1016/j.ccell.2022.05.006. Epub 2022 Jun 2.

Exercise-induced engagement of the IL-15/IL-15Rα axis promotes anti-tumor immunity in pancreatic cancer

Affiliations

Exercise-induced engagement of the IL-15/IL-15Rα axis promotes anti-tumor immunity in pancreatic cancer

Emma Kurz et al. Cancer Cell. .

Abstract

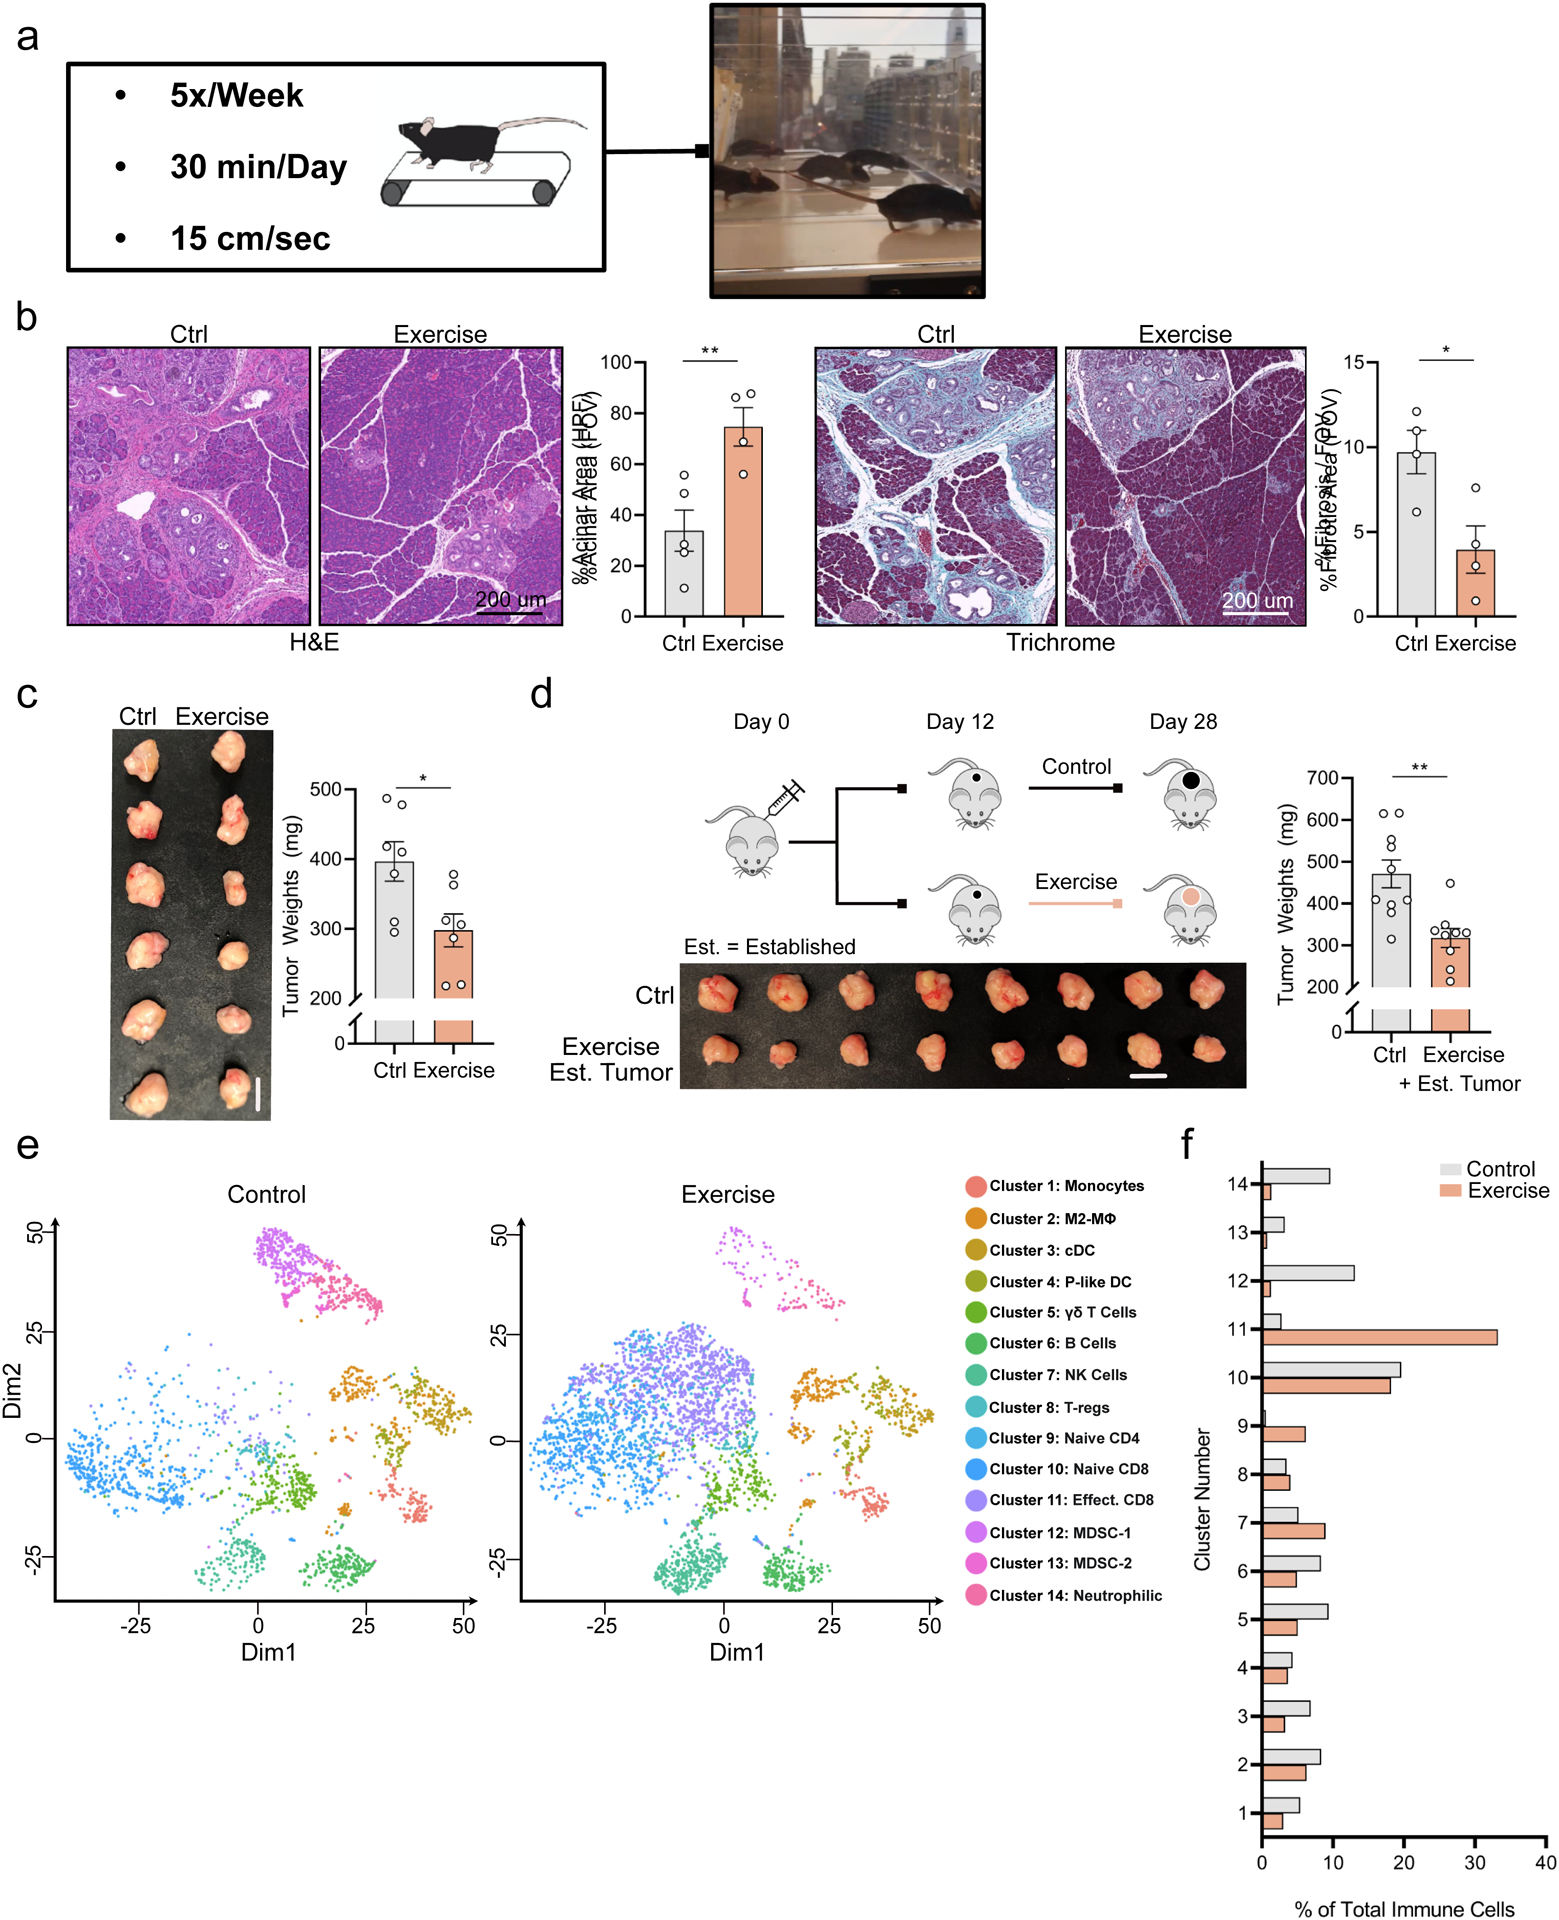
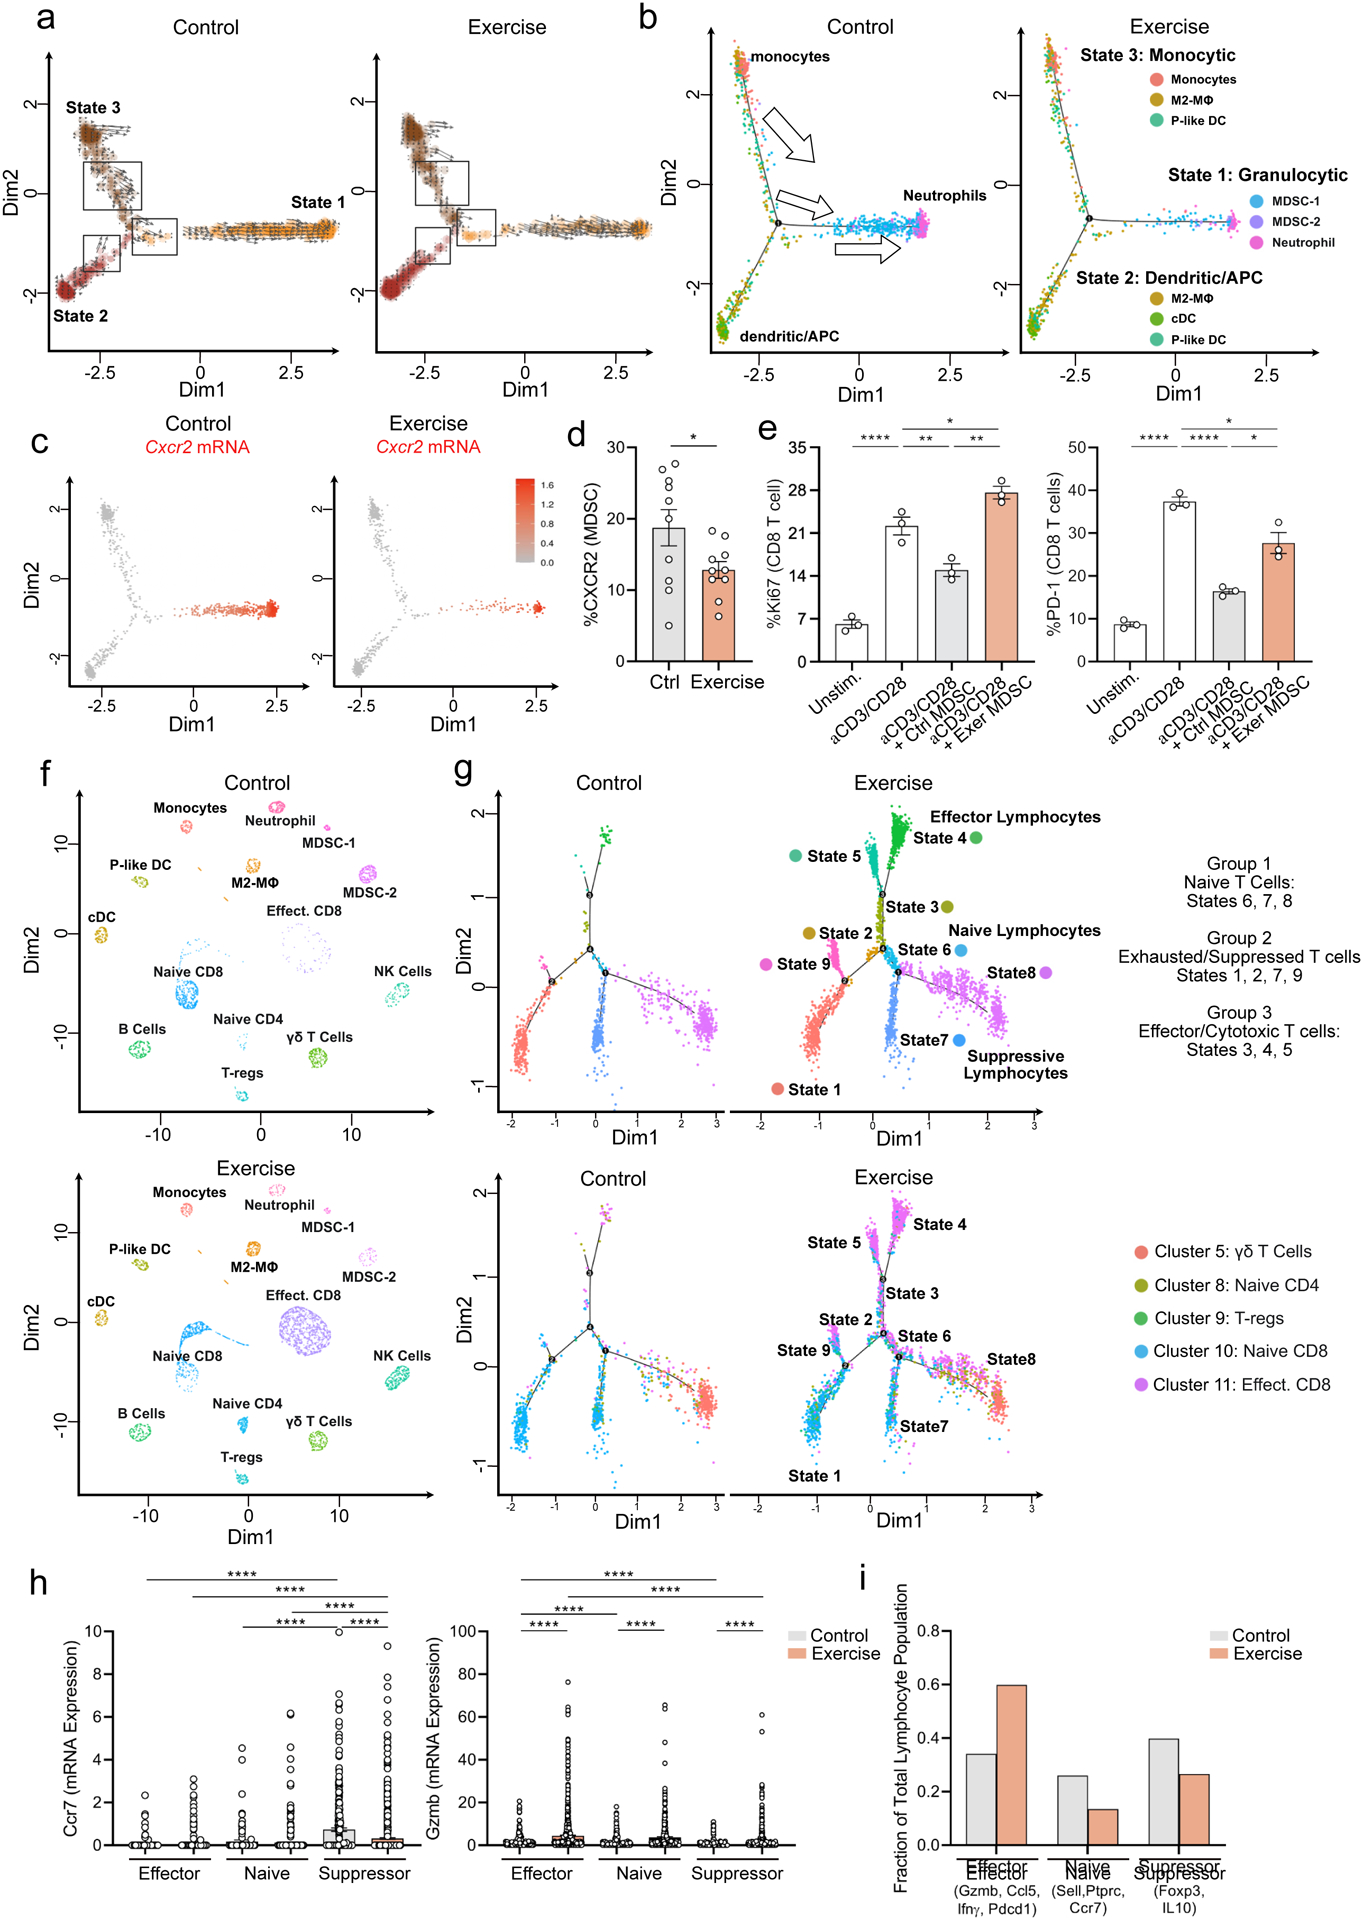
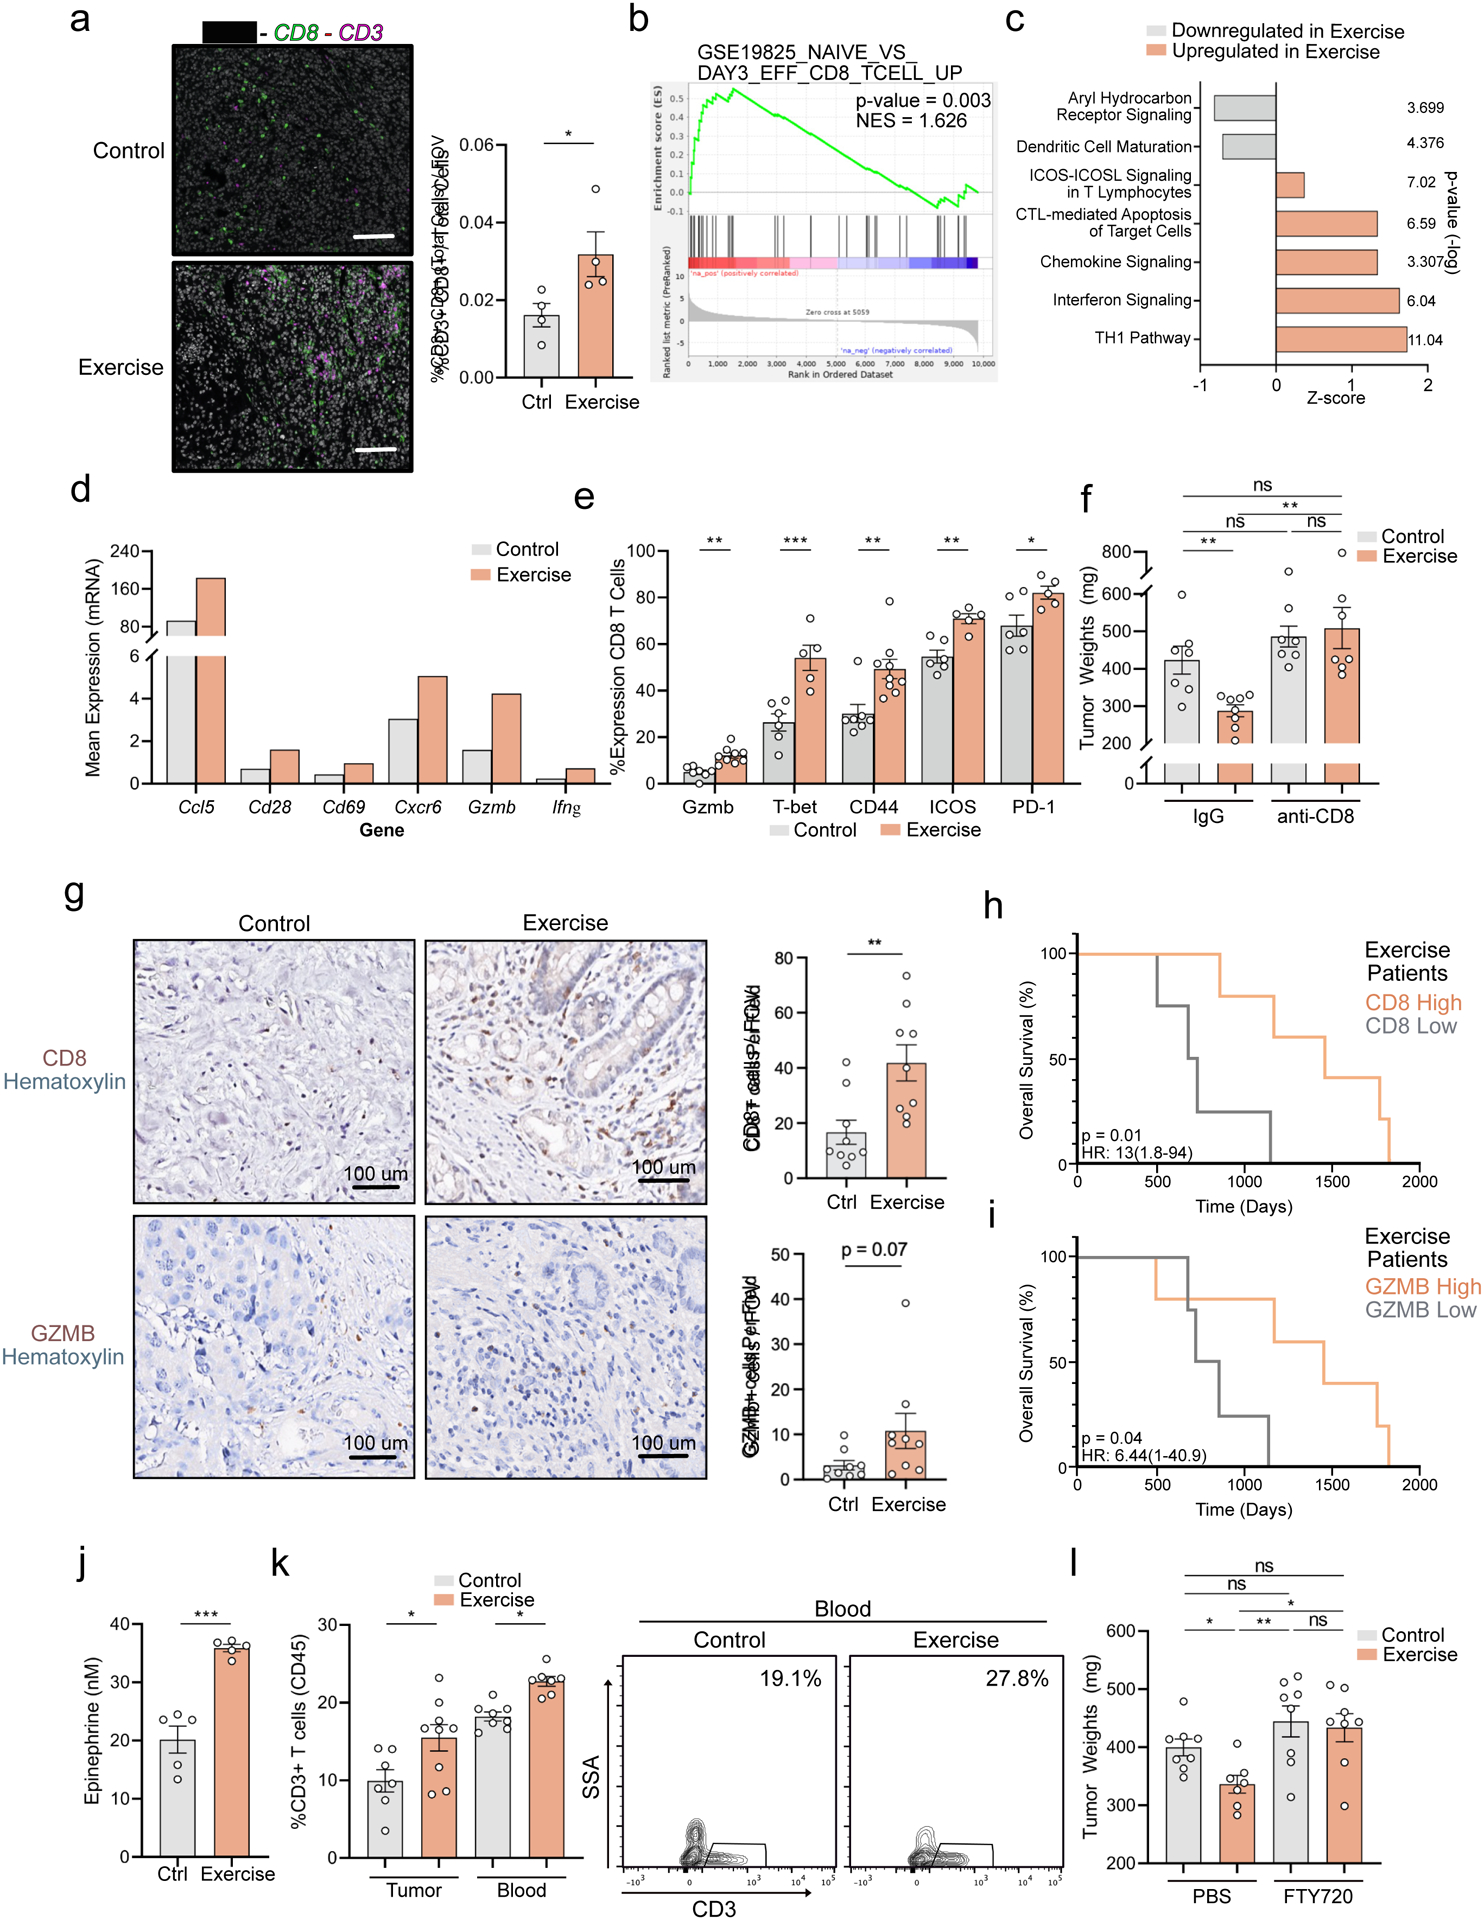
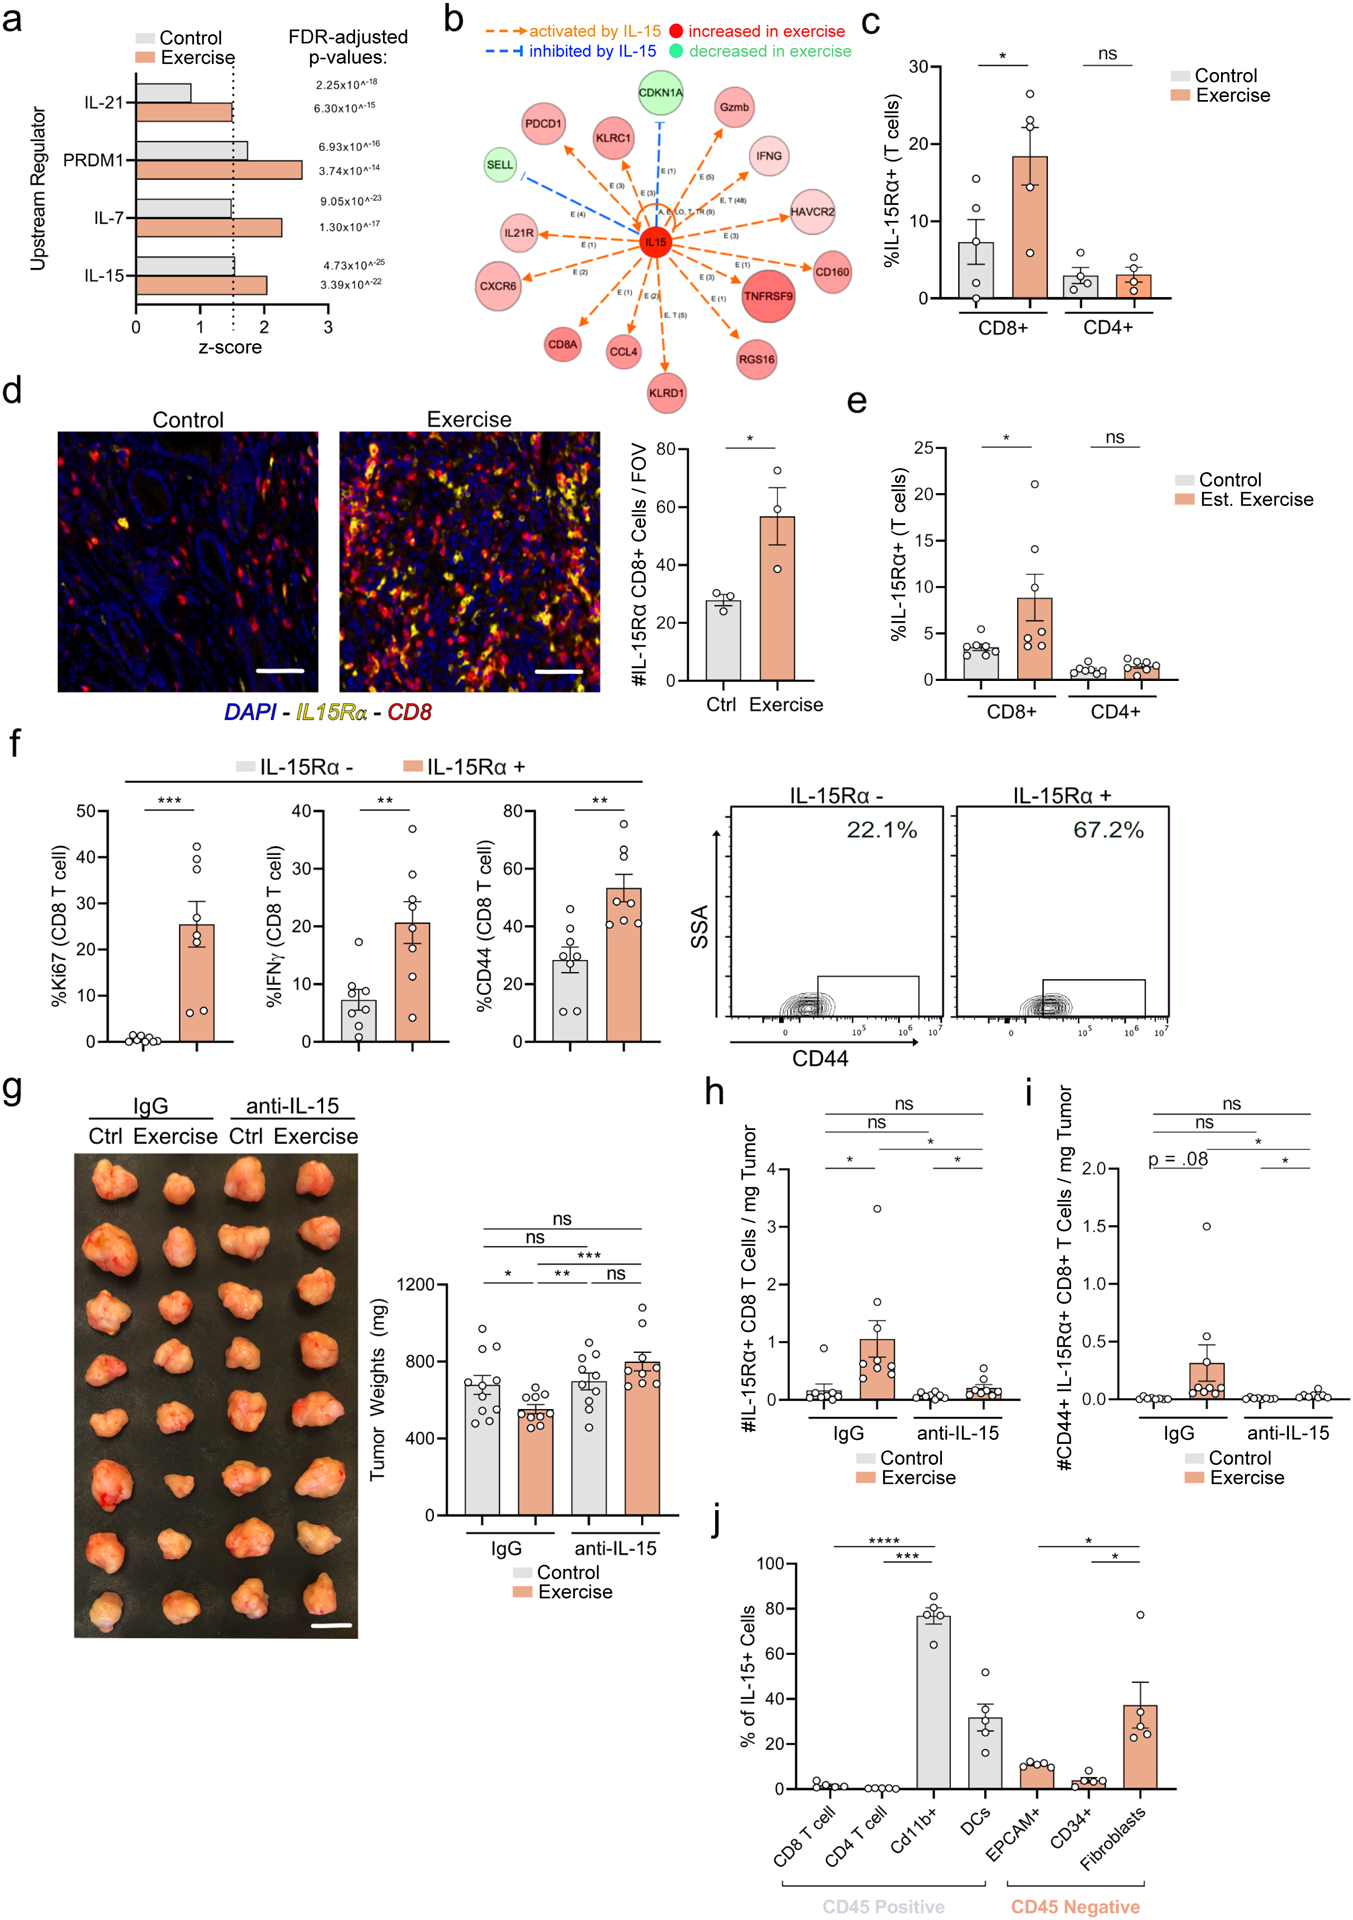
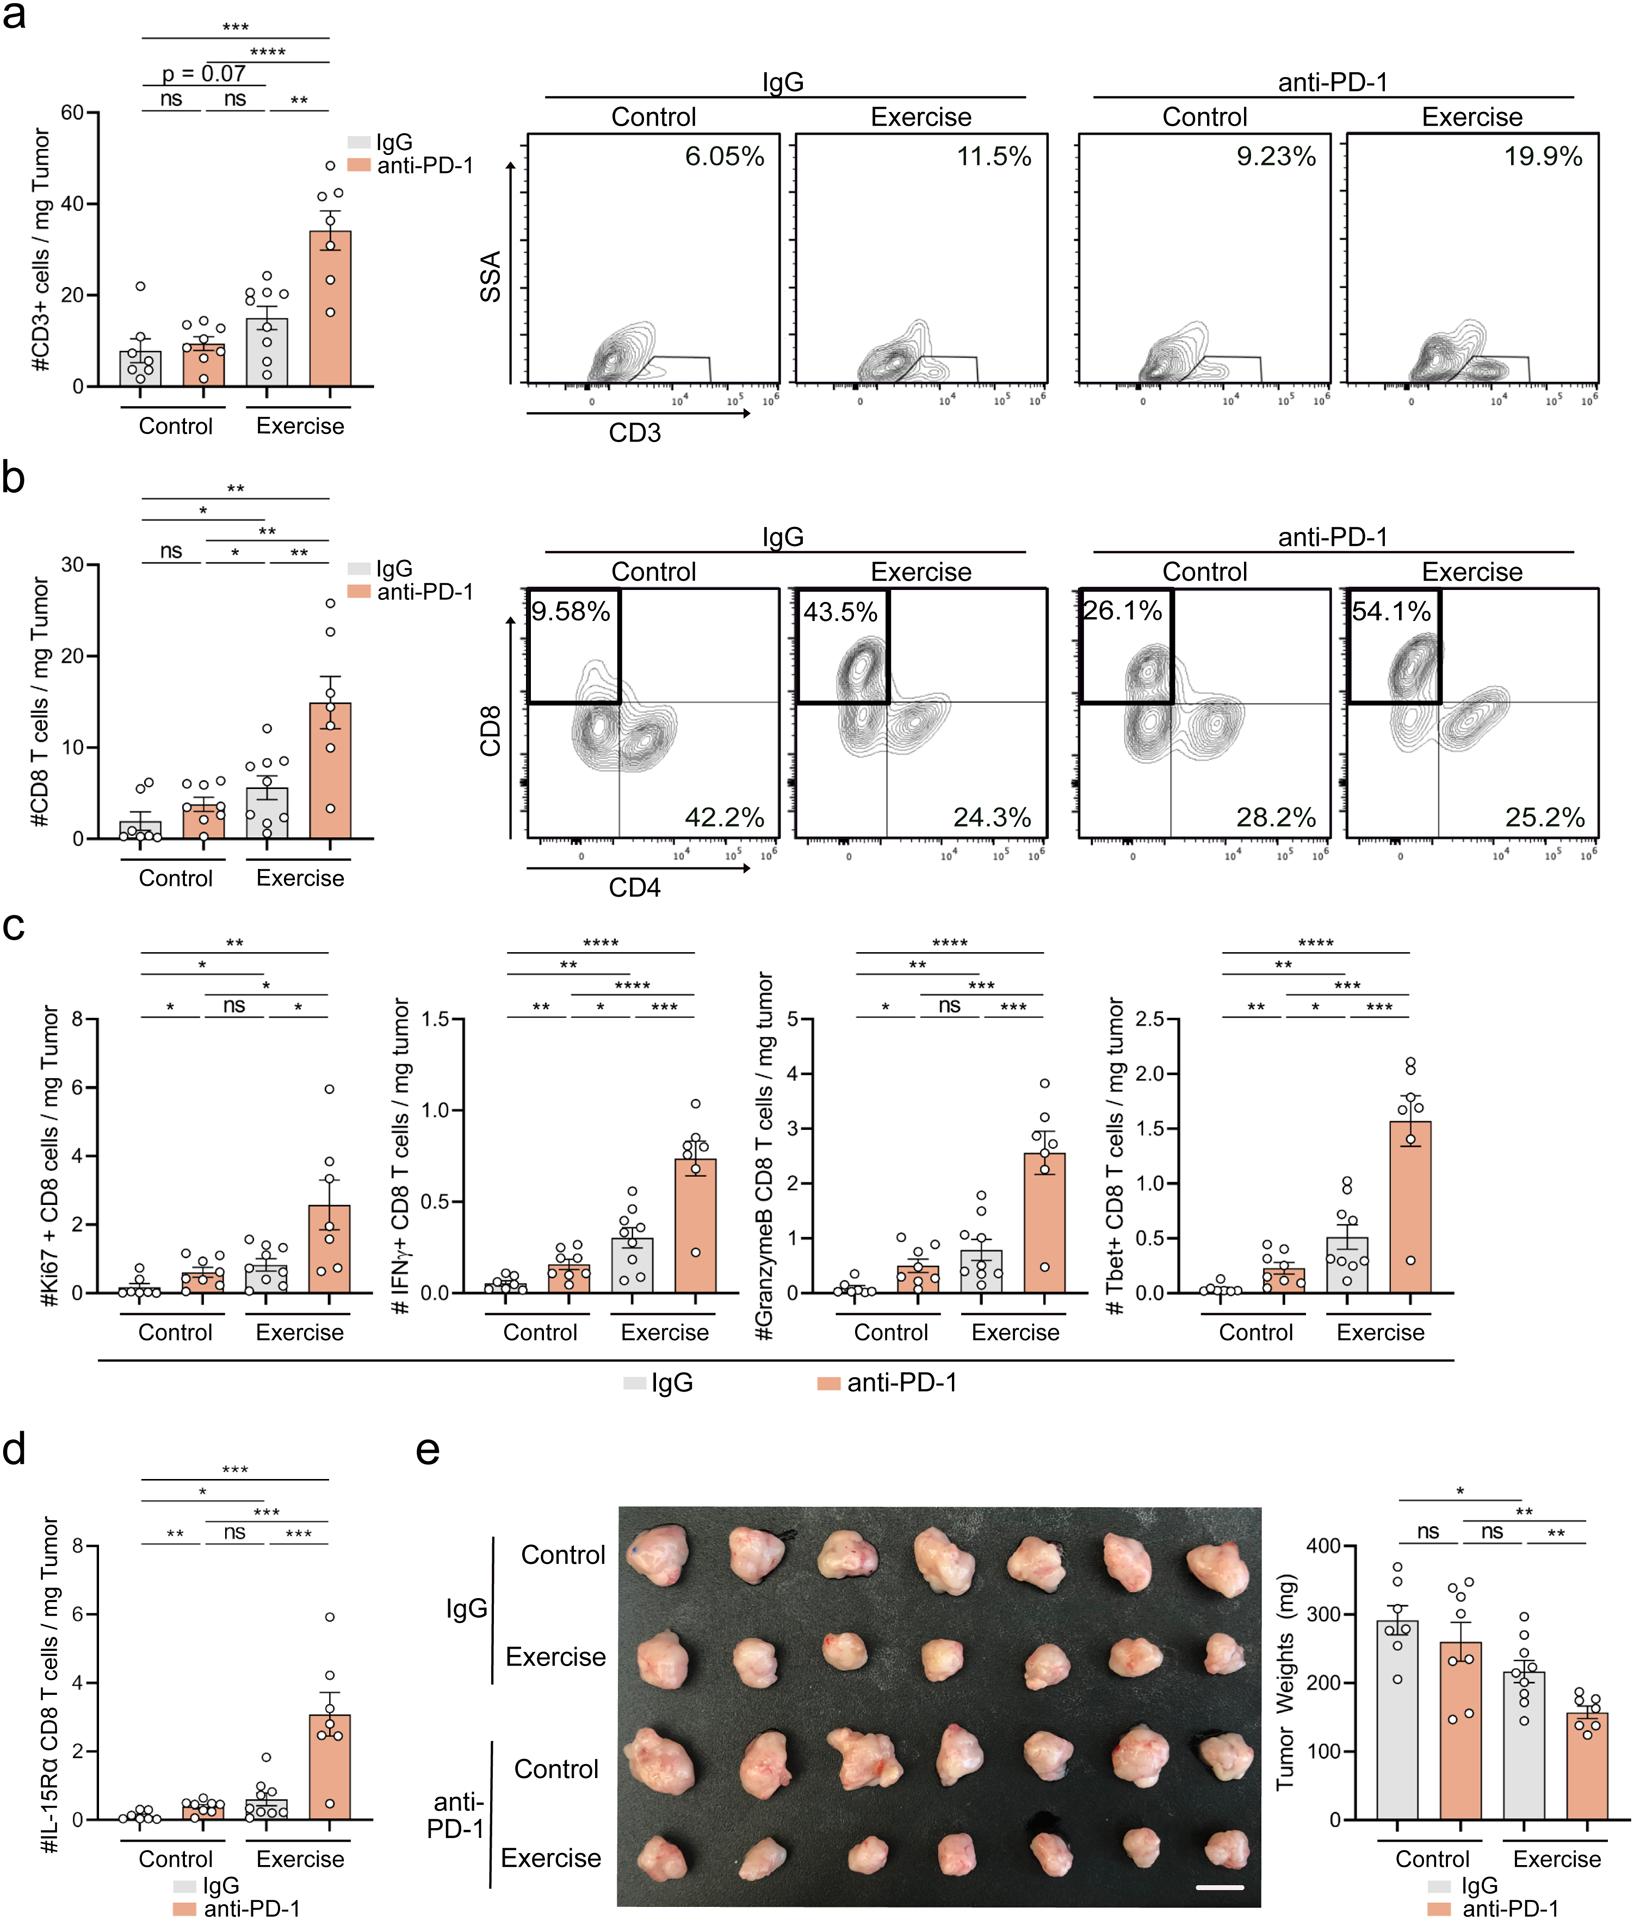
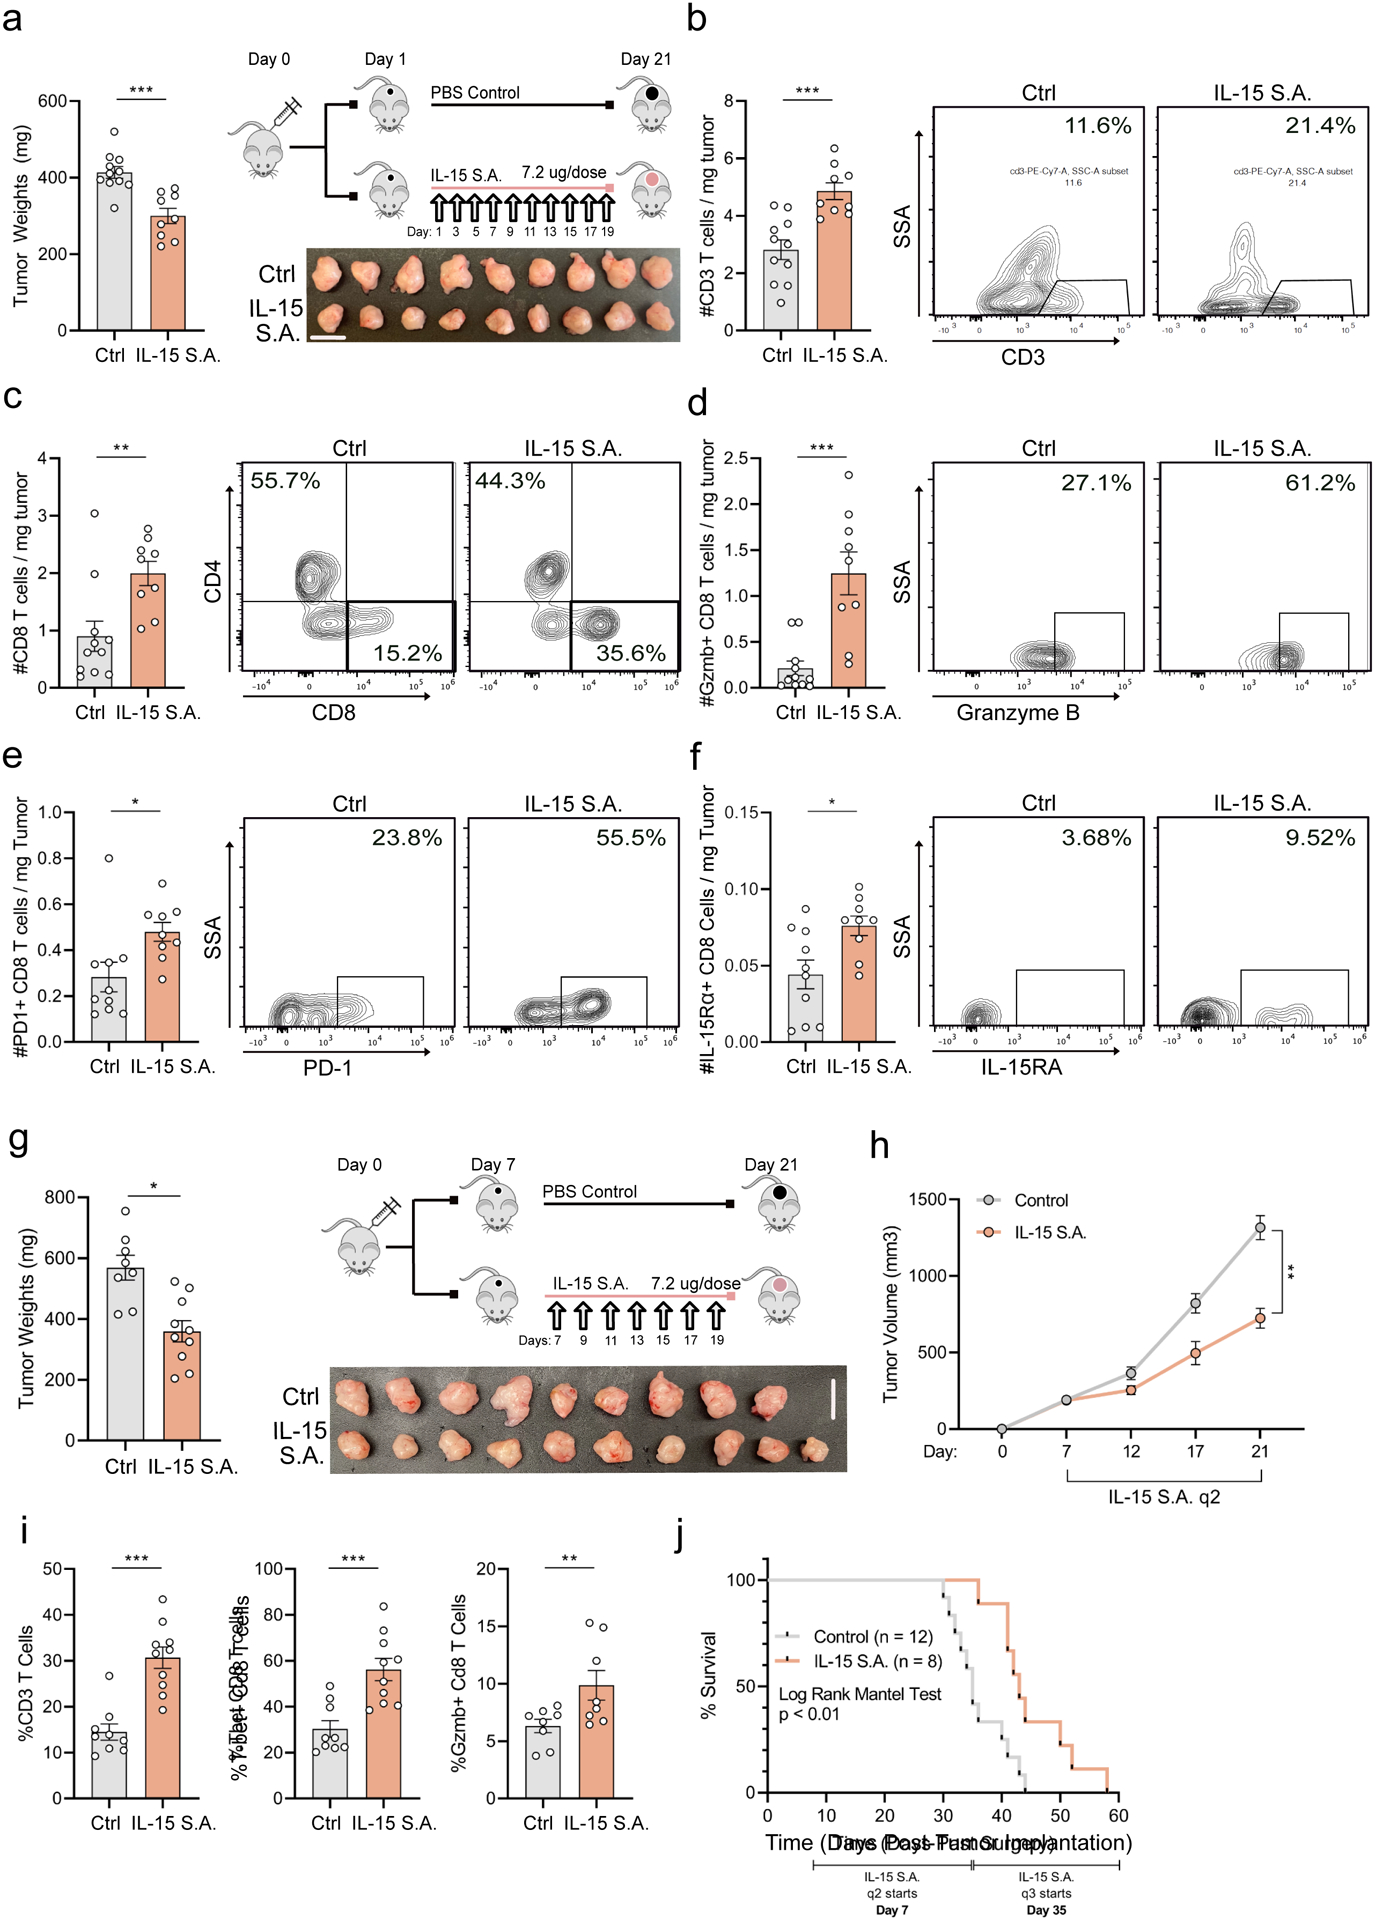
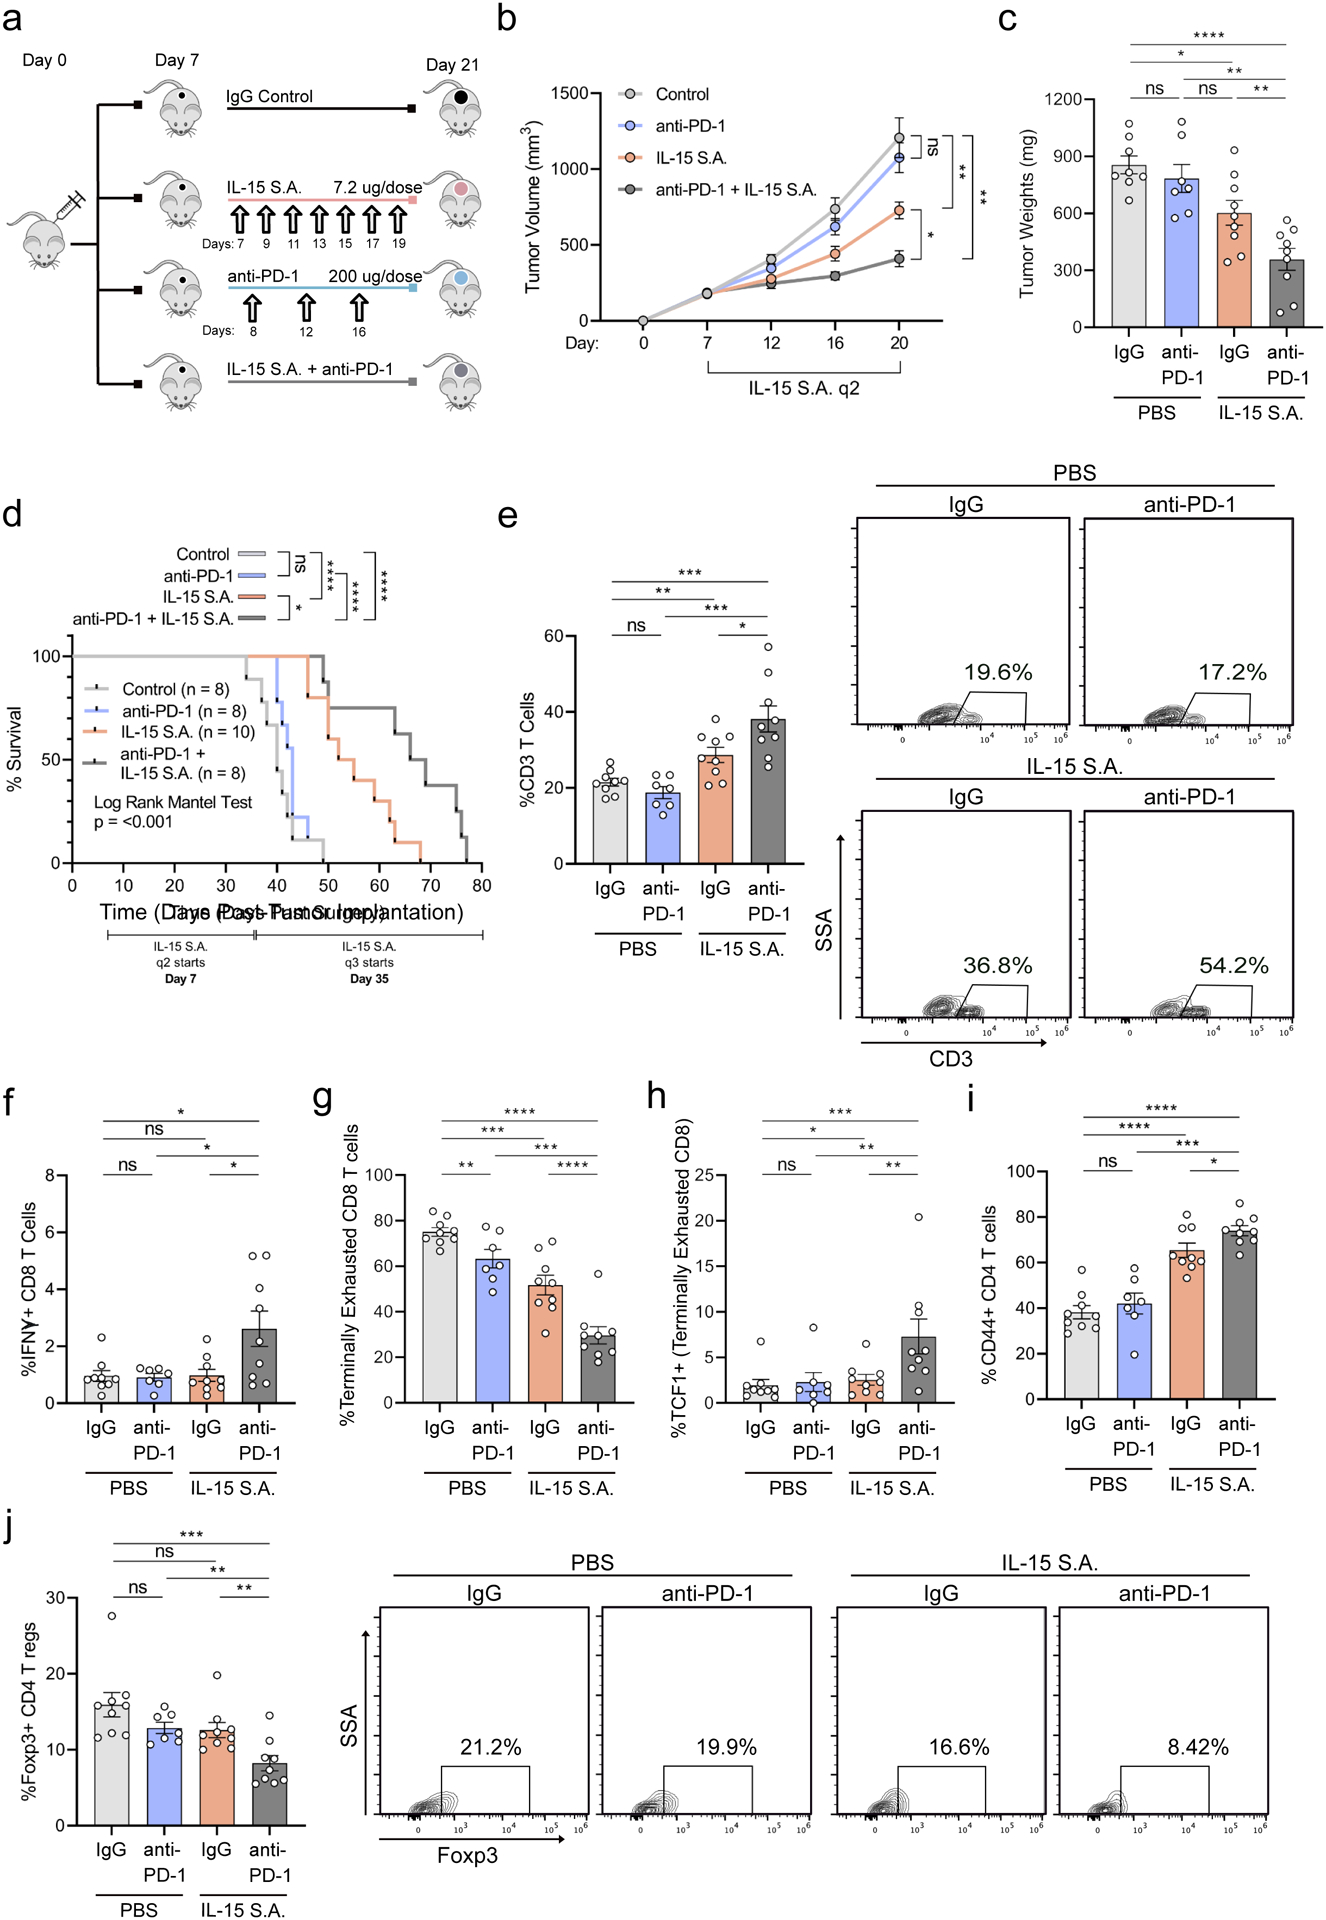
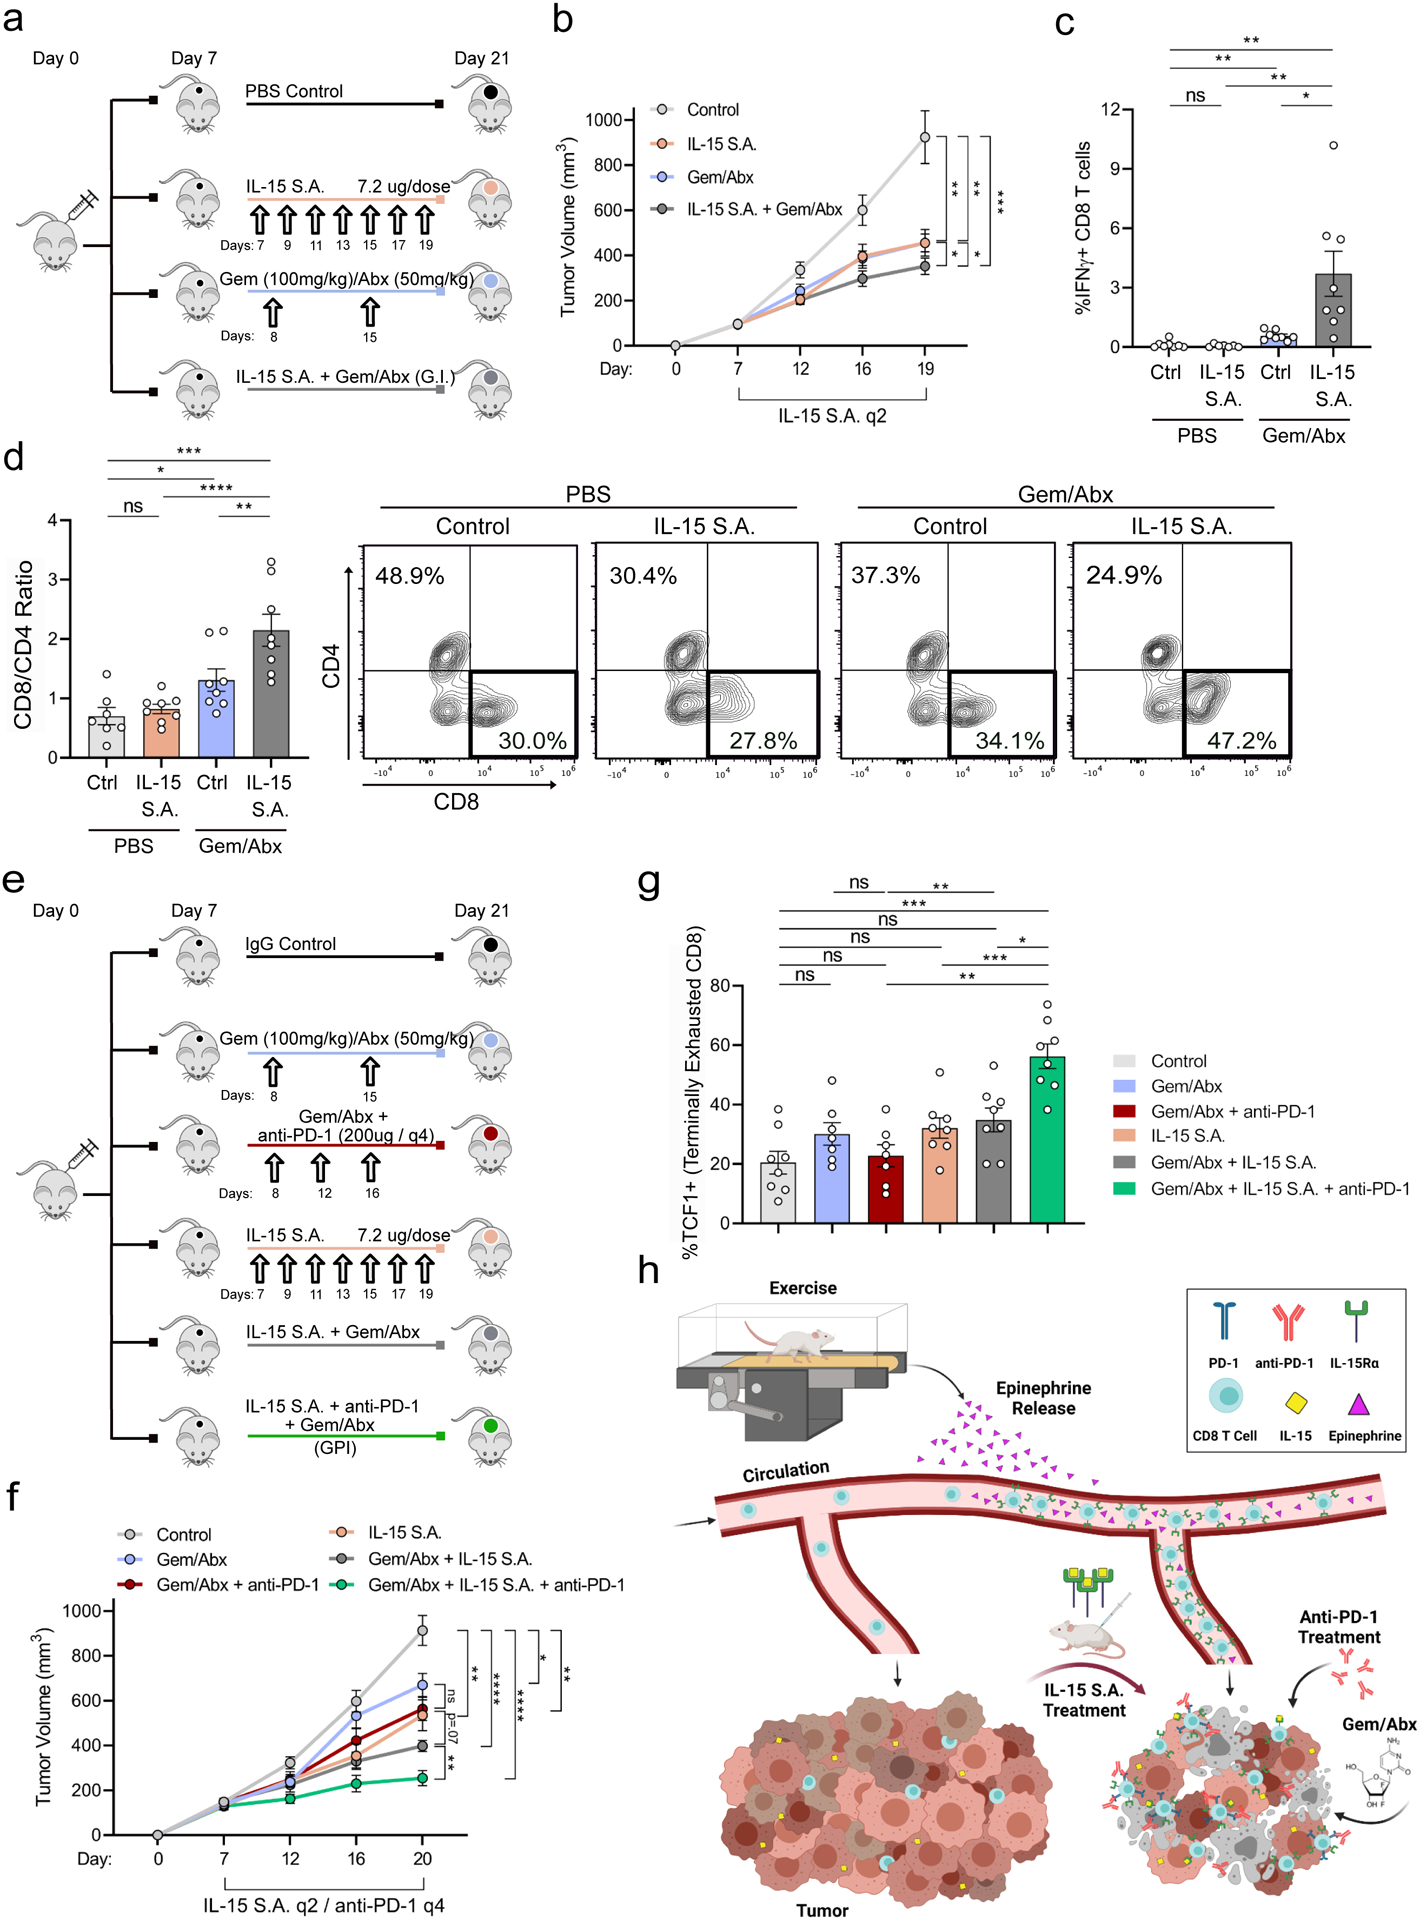
Aerobic exercise is associated with decreased cancer incidence and cancer-associated mortality. However, little is known about the effects of exercise on pancreatic ductal adenocarcinoma (PDA), a disease for which current therapeutic options are limited. Herein, we show that aerobic exercise reduces PDA tumor growth, by modulating systemic and intra-tumoral immunity. Mechanistically, exercise promotes immune mobilization and accumulation of tumor-infiltrating IL15Rα+ CD8 T cells, which are responsible for the tumor-protective effects. In clinical samples, an exercise-dependent increase of intra-tumoral CD8 T cells is also observed. Underscoring the translational potential of the interleukin (IL)-15/IL-15Rα axis, IL-15 super-agonist (NIZ985) treatment attenuates tumor growth, prolongs survival, and enhances sensitivity to chemotherapy. Finally, exercise or NIZ985 both sensitize pancreatic tumors to αPD-1, with improved anti-tumor and survival benefits. Collectively, our findings highlight the therapeutic potential of an exercise-oncology axis and identify IL-15 activation as a promising treatment strategy for this deadly disease.

Trial registration: ClinicalTrials.gov NCT02295956.

Keywords: IL-15; PD-1; T cell; checkpoint blockade; exercise; immunology; immunotherapy; pancreatic cancer; super-agonist.


Conflict of interest statement

Declaration of interests The authors have no competing interests to declare.

Figures

Figure 1:
Figure 1:. Exercise restricts pancreatic cancer growth and reprograms tumor immunity
a. The forced treadmill running model (exercise) is shown. b. 8-week old KC mice were exercised for 6 weeks or remained sedentary. Pancreatic tissue sections stained with Hematoxylin and Eosin (left) and Trichrome and Gomori (right) at 14 weeks of age are shown, with quantification of % acinar and %fibrotic area/field of view (FOV). Each dot = one mouse; n = 4–5. c. 8-week old female C57BL/6J wild type (WT) mice [hereafter “WT mice”] were injected orthotopically with 1×10^5 KPC 4662 cells into the pancreas at Day 0 [hereafter “orthotopically injected”] and exercise was started at Day 1. Day 21 tumor weights and images are shown. Each dot = one tumor (n = 7). Experiment was repeated ten times. d. WT mice were injected orthotopically with 5×10^4 KPC cells and began exercise at Day 12. Schema, tumor images, and weights are shown. Each dot = one tumor (n = 9–10). Experiment was repeated three times. (e-f) WT mice were injected orthotopically and exercise was started at Day 1. e. Single cell RNASeq (sc-RNAseq) was performed on all live leukocytes (PI-, CD45+) from Day 21 tumors. tSNE plots show distribution of clusters, identified by distinct colors (n = 3 tumors pooled / group). f. Relative fraction of each cluster in control and exercise. (p < 0.05 = *, p < 0.01 = **). See Supp. 1
Figure 2:
Figure 2:. Exercise rewires MDSCs and effector lymphocytes
WT mice were injected orthotopically and exercise was started at Day 1. (a-c) Live leukocytes (PI−, CD45+) from Day 21 tumors were analyzed by scRNAseq a. RNA Velocity analysis on all myeloid cells with cell states shown on uMAP plots. Vector arrows represent predicted direction of future transcriptome b. Overlay of phenotypic clusters on the 3 states of myeloid cells. Arrows indicate directionality of transcriptomic predictions. c. Cxcr2 mRNA expression uMAP plots for control and exercise tumors. d. Expression of CXCR2 on Cd11b+ Gr1+ cells by flow cytometry (FC) from Day 21 control and exercise tumors (n =9–10 mice). Experiment was repeated three times e. T cell inhibition assay with MDSC from control or exercise tumors showing Ki67 and PD-1 levels at 72 hours by FC. Each dot = one mouse; n=3. Experiment was repeated twice. f-i. scRNAseq: KNetL plots show distribution of clusters in control and exercise (f). Trajectory analysis shows T cell states (top) with overlay of KNetL clusters (bottom) (g). mRNA expression of Ccr7 and Gzmb across T cell states in control and exercise, each dot = one cell (h). Fraction of total lymphocytes assigned to effector, naïve, and suppressive states (i). (p < 0.05 = *, p < 0.01 = **, p < .0001****). See Supp. 2–3
Figure 3:
Figure 3:. Exercise-induced tumor protection requires CD8 T cells
(a-f) WT mice were injected orthotopically and exercise was started at Day 1. a. Day 21 FFPE tumor sections were stained by IF for CD8, CD3, and DAPI. The % of CD8+ CD3+ cells was quantified. Each dot = one mouse; n=4. (b-d) scRNAseq of Day 21 tumors: b. KEGG analysis of Cluster 11 CD8 T cells. c. Canonical pathway perturbations in IPA (Ingenuity Pathway Analysis) in exercise CD8 T cells. d. Relative mRNA expression of select markers on CD8 T cells, all FDR p-adjusted values < 0.05. e. FC for GZMB, T-bet, CD44, ICOS, and PD-1 as a fraction of CD8. Each dot = one mouse (n = 5–9). Experiment was repeated ten times. f. Control and exercise mice were treated with IgG or anti-CD8. Day 21 tumor weights are shown, each dot = one mouse (n=7–8). Experiment was repeated three times. g. IHC for GZMB+ and CD8+ cells on FFPE tumor sections from exercised pancreatic cancer patients or historical controls; positive cells/FOV quantified. Each dot = one patient (n = 9). h-i. Kaplan-Meier survival curve of exercise patients stratified by CD8 high [top 50%] (n =5), and CD8 low [bottom 50%] (n = 4) (h), or GZMB high (n =5), GZMB low (n = 4) (i), based on levels in (g). j. ELISA for epi on sera isolated 20 minutes after completion of exercise from WT mice. Each dot = one mouse (n = 5), experiment was repeated twice. (k-l) WT mice were injected orthotopically and exercise was started at Day 1. k. At Day 21, CD3+ T cells in tumor and blood were assessed by FC 20 minutes post-exercise. Each dot = one mouse (n= 7–9). Representative contour plots are shown. Experiment was repeated three times. (l) Mice were treated with PBS or FTY720. Day 21 tumor weights are shown, each dot = one tumor (n =7–8). Experiment was repeated three times. (p > 0.05 = ns, p < 0.05 = *, p < 0.01 = **, p < 0.001 = ***). See Supp. 3–6
Figure 4:
Figure 4:. IL-15/IL-15Rα axis is required for exercise-mediated anti-tumor effects
a. Predicted upstream regulators of CD8+ T cells on sc-RNA seq. in IPA. b. Transcript levels of genes downstream of IL-15 in exercise CD8 T cells in IPA. c-f. WT mice were injected orthotopically and exercise was started on Day 1 (c-d) or Day 12 (e). c. Day 21 tumors were analyzed by FC for % of IL-15Rα+ T cells. Each dot = one tumor (n=4–5). d. Day 21 tumors were stained by multiplex IF for CD8, IL-15Rα, and DAPI. The number of CD8+ IL-15Rα+ (orange) cells were quantified. Each dot = one mouse (n=3). e. Day 28 tumors were assessed by FC for % of IL-15Rα+ T cells. Each dot = one tumor (n=7). Experiment was repeated three times. f. Exercise tumors at Day 21 were analyzed by FC for Ki67, IFNγ and CD44 and in IL-15Rα+/− CD8 T cells. Each dot = one tumor (n=8). Representative plots are shown for CD44. (g-i) Orthotopically implanted control and exercise mice were treated with IgG or anti-IL-15. Day 21 tumor weights are shown (g). Tumors were assessed by FC for number of IL-15Rα+ CD8+ T cells (h) and CD44+ IL-15Rα+ CD8+ T cells (i). Each dot = one tumor (n=9–11). Experiment was repeated three times. j. WT mice were injected orthotopically. Day 21 tumors were analyzed by flow for IL-15 levels in indicated populations. Each dot = one mouse (n =5). Experiment was repeated twice. (p > 0.05 = ns, p < 0.05 = *, p < 0.01 = **, p < 0.001 = ***, p<0.0001 = ****). See Supp. 6–7.
Figure 5:
Figure 5:. Exercises sensitizes pancreatic cancer to α-PD1
a-e. WT mice were injected orthotopically and exercise was started at Day 1. Mice were treated with IgG or α-PD-1 blocking antibody. Day 21 tumors were assessed by FC for CD3 (a), CD8/CD4 (b), Ki67, IFNγ, GZMB, and T-bet (c) and IL-15Rα (d) on CD8 T cells. Tumor images and weights are shown (e). Each dot = one tumor (n=7–9). Experiment was repeated three times. (p > 0.05 = ns, p < 0.05 = *, p < 0.01 = **, p < 0.001 = ***, p < 0.0001 = ****). See Supp. 7
Figure 6:
Figure 6:. IL-15 S.A. monotherapy promotes anti-tumor immunity
(a-f) WT mice were injected orthotopically and treated with IL-15 S.A., as shown. Day 21 tumor weights and images are shown. (a). Tumors were assessed by FC for CD3 (b), CD4 and CD8 (c), and GZMB (d), PD-1 (e), and IL-15Rα (f) on CD8 T cells. Each dot = one mouse (n = 9–11). Experiment was repeated at least three times. (g-j). WT mice were injected orthotopically and treated with IL-15 S.A., starting Day 7. Day 21 tumor weights and images are shown. Each dot = one mouse (n = 8–10) (g). Tumor volumes were monitored using ultrasound and each curve represents average of treatment group (n = 8–10 mice) (h) i. Tumors were analyzed by FC for CD3 (% of CD45), and %T-bet and GZMB on CD8 T cells. Each dot = one tumor (n=8–10). Experiment was repeated three times. j. Kaplan-Meier survival curve. (p < 0.05 = *, p < 0.01 = **, p < 0.001 = ***). See Supp. 7
Figure 7:
Figure 7:. α-PD-1 + IL-15 S.A. slows tumor growth and promotes durable immune responses
a-j. WT mice were injected orthotopically and mice were treated starting on Day 7, as shown (a). Tumor volumes were monitored using ultrasound. Each curve represents average of treatment group (n = 7–9 mice per group) (b). At Day 21 tumor weights were quantified. Each dot = one mouse (n = 7–9) (c). d. Kaplan-Meier survival curve. e-j. Tumors were analyzed by FC for CD3 as fraction of CD45 (e), IFNγ (f), CD44 and PD-1 (g) as fraction of CD8 T cells, TCF-1 as fraction of CD44+ PD-1+ [terminally exhausted] CD8 T cells (h), and CD44 (i), and FOXP3 as fraction of CD4 T cells (j). Representative plots are shown for CD3 T cells and FOXP3. Each dot = one tumor (n=7–9). Experiment was repeated three times. (p>.05 = ns, p < 0.05 = *, p < 0.01 = **, p < 0.001 = ***, p<0.0001 = ****). See Supp.7–8.
Figure 8:
Figure 8:. Chemotherapeutic combination with IL-15 S.A. protects against murine PDA
a-d. WT mice were injected orthotopically and were treated starting on Day 7, as shown (a). Tumor volumes were monitored using ultrasound. Each curve represents average of treatment group (n = 8–9 mice) (b). Day 21 tumors were analyzed by FC for CD3, CD8, and IFNγ (c) and CD4 and CD8 (d). Representative plots are shown for CD8/CD4. Each dot = one tumor (n= 8–9). Experiment was repeated three times. (e-g) WT mice were injected orthotopically and were treated starting on Day 7, as shown (e). Tumor volumes were monitored using ultrasound. Each curve represents average of treatment group (n = 7–8 mice) (f). FC of tumors assessing TCF1+ of CD44+PD-1+ CD8 T cells. Each dot = one tumor (n= 7–8) Experiment was repeated twice (g). h. Schematic of proposed mechanism. (p>.05 = ns, p < 0.05 = *, p < 0.01 = **, p < 0.001 = ***, p<0.0001 = ****). See Supp. 8

Comment in

References

    1. Allen BM, Hiam KJ, Burnett CE, Venida A, DeBarge R, Tenvooren I, Marquez DM, Cho NW, Carmi Y, and Spitzer MH (2020). Systemic dysfunction and plasticity of the immune macroenvironment in cancer models. Nat Med 26, 1125–1134. - PMC - PubMed
    1. Ashcraft KA, Peace RM, Betof AS, Dewhirst MW, and Jones LW (2016). Efficacy and Mechanisms of Aerobic Exercise on Cancer Initiation, Progression, and Metastasis: A Critical Systematic Review of In Vivo Preclinical Data. Cancer Res 76, 4032–4050. - PMC - PubMed
    1. Balachandran VP, Beatty GL, and Dougan SK (2019). Broadening the Impact of Immunotherapy to Pancreatic Cancer: Challenges and Opportunities. Gastroenterology 156, 2056–2072. - PMC - PubMed
    1. Barnstorf I, Borsa M, Baumann N, Pallmer K, Yermanos A, Joller N, Sporri R, Welten SPM, Krautler NJ, and Oxenius A (2019). Chronic virus infection compromises memory bystander T cell function in an IL-6/STAT1-dependent manner. J Exp Med 216, 571–586. - PMC - PubMed
    1. Bear AS, Vonderheide RH, and O’Hara MH (2020). Challenges and Opportunities for Pancreatic Cancer Immunotherapy. Cancer Cell 38, 788–802. - PMC - PubMed

Publication types

MeSH terms

Associated data