. 2022 Aug:94:102258.
doi: 10.1016/j.npep.2022.102258. Epub 2022 May 20.

Autonomous regulation of retinal insulin biosynthesis in diabetes

Affiliations

Autonomous regulation of retinal insulin biosynthesis in diabetes

Malita A Jones et al. Neuropeptides. 2022 Aug.

Abstract

Diabetic retinopathy (DR) is a neurodegenerative disease that results as a complication of dysregulated glucose metabolism, or diabetes. The signaling of insulin is lost or dampened in diabetes, but this hormone has also been shown to be an important neurotrophic factor which supports neurons of the brain. The role of local insulin synthesis and secretion in the retina, however, is unclear. We have investigated whether changes in local insulin synthesis occur in the diabetic retina and in response to stressors known to initiate retinal neurodegenerative processes. The expression of insulin and its cleavage product, c-peptide, were examined in retinas of a Type I diabetes animal model and human postmortem donors with DR. We detected mRNAs for insulin I (Ins1), insulin II (Ins2) and human insulin (Ins) by quantitative real-time polymerase chain reaction (qRT-PCR) and in situ hybridization. Using an ex-vivo system, isolated neuroretinas and retinal pigmented epithelium (RPE) layers were exposed to glycemic, oxidative and inflammatory environments to measure insulin gene transcripts produced de novo in the retina under disease-relevant conditions. The expression of insulin in the retina was altered with the progression of diabetes in STZ mice and donors with DR. Transcription factors for insulin, were simultaneously expressed in a pattern matching insulin genes. Furthermore, de novo insulin mRNA in isolated retinas was induced by acute stress. RPE explants displayed the most pronounced changes in Ins1 and Ins2. This data reveals that the retina, like the brain, is an organ capable of producing local insulin and this synthesis is altered in diabetes.

Keywords: C-peptide; Diabetes; Diabetic retinopathy; Insulin; Retina; Retinal pigmented epithelium.


Figures

Figure 1.
Figure 1.
Insulin gene expression in mouse retina. Total RNA collected from mouse retina was used for RT–PCR analysis of PPI1, PPI2 (A), Ins1, and Ins2 expression (B). 18S rRNA was used as an internal control. C) Localization of Ins1 and Ins2 mRNA transcripts was evaluated by fluorescent in situ hybridization (FISH). Hybridization of mouse retinal cryosections with anti-sense probes specific to Ins1 and Ins2. Red labeling is indicative of Ins1 and Ins2 transcripts present in the GCL, INL, ONL, and RPE. No positive signal was detected in sections hybridized with sense (negative control) probe. Abbreviations: ganglion cell layer (GCL); inner nuclear layer (INL); outer plexiform layer (OPL) outer nuclear layer (ONL); retinal pigmented epithelial layer (RPE).
Figure 2.
Figure 2.
Changes in Ins1 and Ins2 expression. A) Expression of Ins1 and Ins2 were compared in different murine tissues (retina, pancreas, olfactory bulb, liver). Real-time quantitative PCR (qPCR) analysis of Ins1 and Ins2 mRNA expression in retinas of normoglycemic (controls) and STZ-injected, diabetic (Db) groups (B-E). mRNA from Db retinas revealed an increase in insulin genes, (Ins1, p=0.0008, Ins2, p=0.0023) over time when measured at after 8 weeks (B,D). At 23 weeks (C,E) of diabetes there was a significant decrease in Ins1 (p=0.012) and no change in Ins2 (n=6 samples per group and amplified in 3 separate runs). *p<0.05 vs. control. F-G) Real-time quantitative PCR (qPCR) analysis of Ins1 and Ins2 mRNA expression in pancreatic tissue from normoglycemic (controls) and diabetic (Db) show decrease in expression of Ins1 and Ins2. n=6 samples and amplified in 3 separate runs. *p<0.05 vs. control.
Figure 3.
Figure 3.
Detection of c-peptide levels in retinas of T1D; STZ-injected and diabetic Akita mice. ELISA values of average c-peptide protein concentration in the retinas of control versus 8-week diabetic, STZ-injected (A) and 23-week diabetic, STZ-injected (B) mice. n=6 samples per group *p<0.05 vs. control. C) Real-time quantitative PCR (qPCR) analysis of Ins1 and Ins2 mRNA expression in retinal tissue from normoglycemic (controls) and diabetic Akita (Akita). Student t-test showed that there was no significant change in Ins1 expression in diabetic Akita mice compared with Wt mice and Ins2 was undetected. n=6 samples and amplified in 3 separate runs. D) Retina c-peptide protein concentration was determined in samples obtained from WT mice and diabetic Akita mice. Negligible amounts of the protein were detected in Akita mice, which are unable to synthesize active insulin or its cleavage product, c-peptide. Values are means ± SE of group size (n = 6).
Figure 4.
Figure 4.
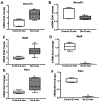
Expression of insulin transcription factors. mRNA of NeuroD1 (A-B), MafA (C-D), and Pdx1 (E-F) in retinal tissue from normoglycemic (controls) and STZ-injected diabetic (Db). mRNA expression of genes were normalized to 18s expression (n=6 samples per group and amplified in 3 separate runs). Data are presented as mean±SEM, *p<0.05 compared to age-matched, non-diabetic controls.
Figure 5.
Figure 5.
Ex-vivo retinal cultures. RNA derived from RPE explants cultured in HG, H2O2 and LPS-conditioned media were utilized to measure the expression of Ins1(A) and Ins2(B) for 1 hour. The expression of Ins1 from mRNA derived from NR explants exposed to HG, H2O2 and LPS for 1 hour was detected in samples. Actinomycin D (actD) was utilized as an inhibitor of RNA synthesis. Data is expressed as mean±SEM, *p<0.05. n=6 samples per group and amplified in 2 separate runs.
Figure 6.
Figure 6.
Ins expression in human retinas. (A) In situ hybridization was used to determine the location of Ins in the retinas of control and diabetic donors. A weak signal detected in sections hybridized with sense (negative control) probe in RPE was determined to be non-specific in experiments which compared slides without any probe incubated with anti-DAB only (not shown) B) Expression profiling of Ins in neuroretinas and RPE isolated from control and diabetic donors. Relative expression of NR versus RPE samples are depicted in bar graphs (n=5 samples per group and amplified in 3 separate runs). C-D) qPCR analysis of mRNA from control and diabetic donors in NR and RPE tissue samples. Data is expressed as mean±SEM, *p<0.05, (n=5 samples per group and amplified in 3 separate runs).

References

    1. Abbott MA, Wells DG, and Fallon JR. 1999. 'The insulin receptor tyrosine kinase substrate p58/53 and the insulin receptor are components of CNS synapses', J Neurosci, 19: 7300–8. - PMC - PubMed
    1. Arden GB, and Sivaprasad S. 2011. 'Hypoxia and oxidative stress in the causation of diabetic retinopathy', Curr Diabetes Rev, 7: 291–304. - PubMed
    1. Barber AJ, Lieth E, Khin SA, Antonetti DA, Buchanan AG, and Gardner TW. 1998. 'Neural apoptosis in the retina during experimental and human diabetes. Early onset and effect of insulin', J Clin Invest, 102: 783–91. - PMC - PubMed
    1. Barber AJ, Nakamura M, Wolpert EB, Reiter CE, Seigel GM, Antonetti DA, and Gardner TW. 2001. 'Insulin rescues retinal neurons from apoptosis by a phosphatidylinositol 3-kinase/Akt-mediated mechanism that reduces the activation of caspase-3', J Biol Chem, 276: 32814–21. - PubMed
    1. Das A, Pansky B, Budd GC, and Kollarits CR. 1984. 'Immunocytochemistry of mouse and human retina with antisera to insulin and S-100 protein', Curr Eye Res, 3: 1397–403. - PubMed