. 2022 Sep:170:34-46.
doi: 10.1016/j.yjmcc.2022.05.009. Epub 2022 Jun 2.

Dual loss of regulator of G protein signaling 2 and 5 exacerbates ventricular myocyte arrhythmias and disrupts the fine-tuning of Gi/o signaling

Affiliations

Dual loss of regulator of G protein signaling 2 and 5 exacerbates ventricular myocyte arrhythmias and disrupts the fine-tuning of Gi/o signaling

Shelby A Dahlen et al. J Mol Cell Cardiol. 2022 Sep.

Abstract

Aims: Cardiac contractility, essential to maintaining proper cardiac output and circulation, is regulated by G protein-coupled receptor (GPCR) signaling. Previously, the absence of regulator of G protein signaling (RGS) 2 and 5, separately, was shown to cause G protein dysregulation, contributing to modest blood pressure elevation and exaggerated cardiac hypertrophic response to pressure-overload. Whether RGS2 and 5 redundantly control G protein signaling to maintain cardiovascular homeostasis is unknown. Here we examined how the dual absence of RGS2 and 5 (Rgs2/5 dbKO) affects blood pressure and cardiac structure and function.

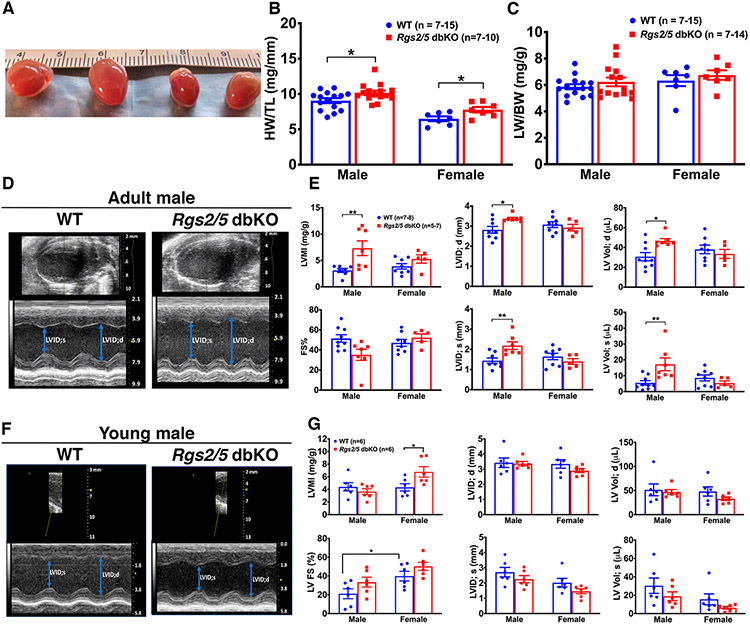
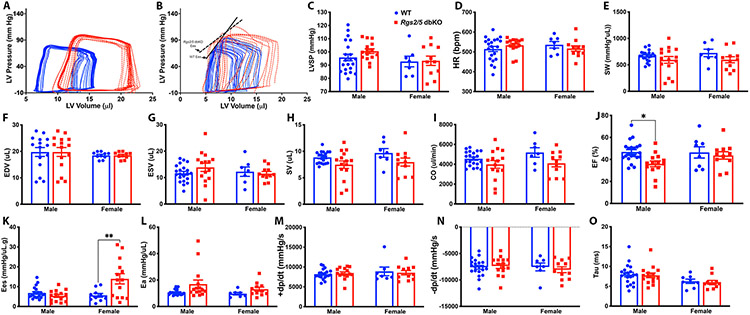
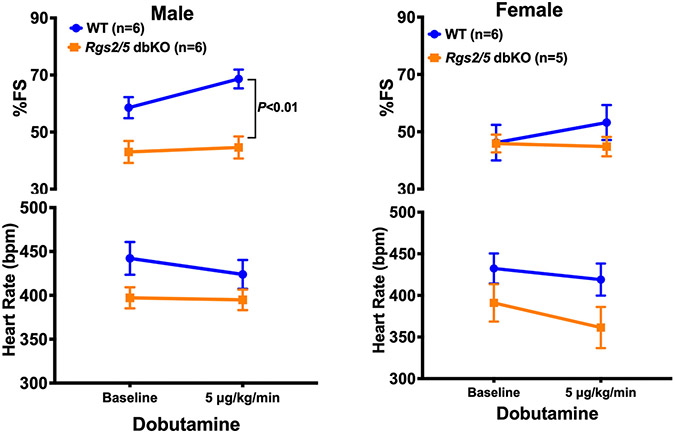
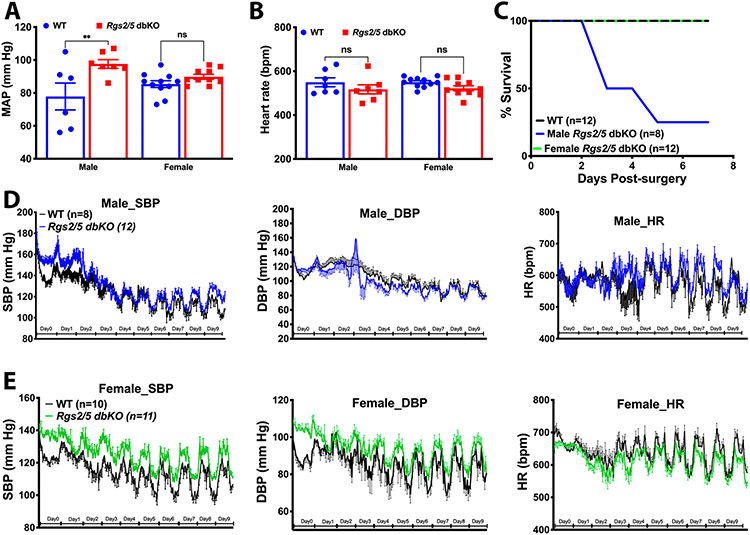
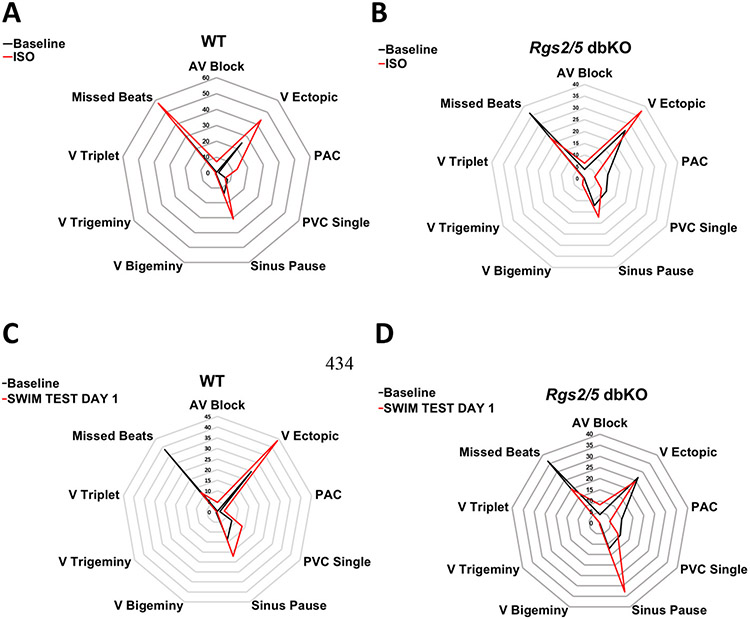
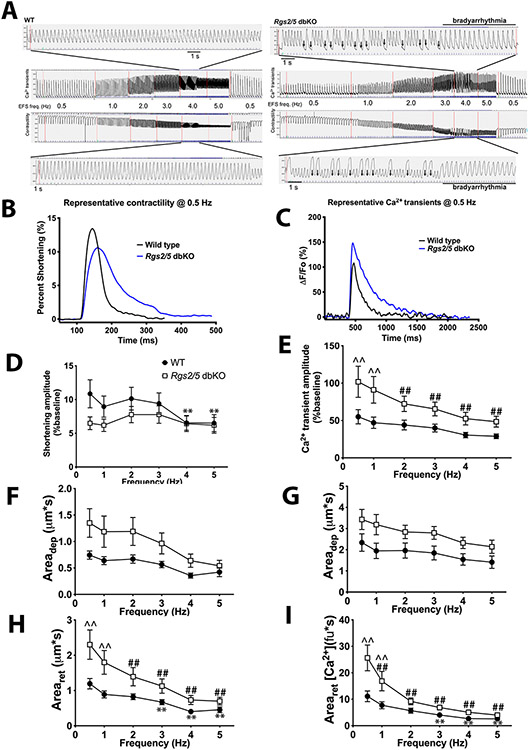
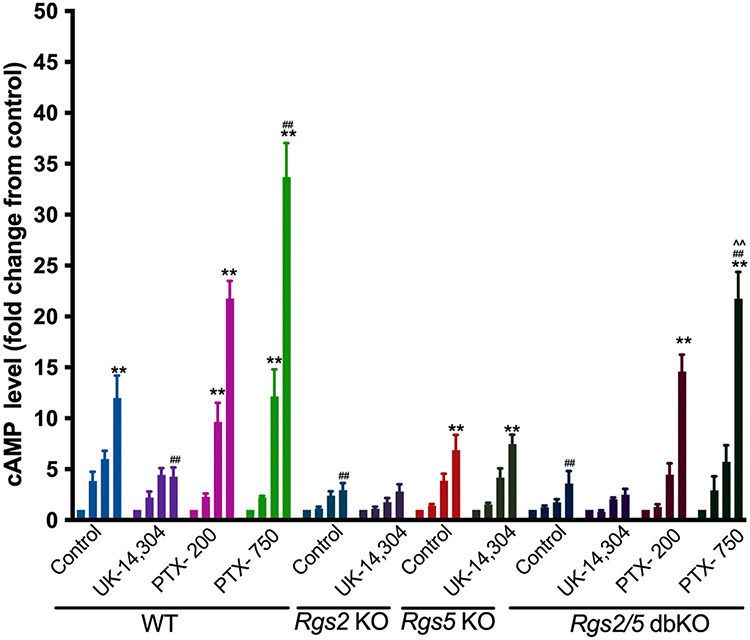
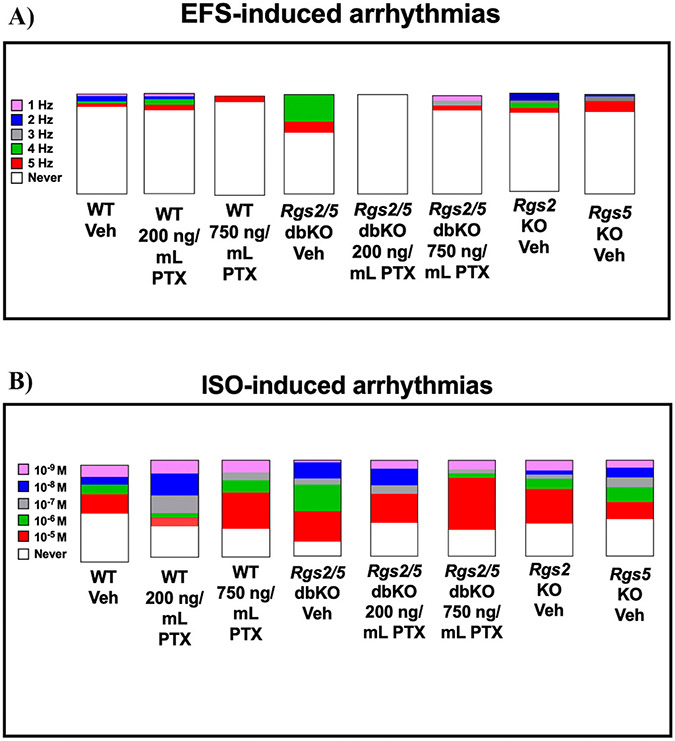
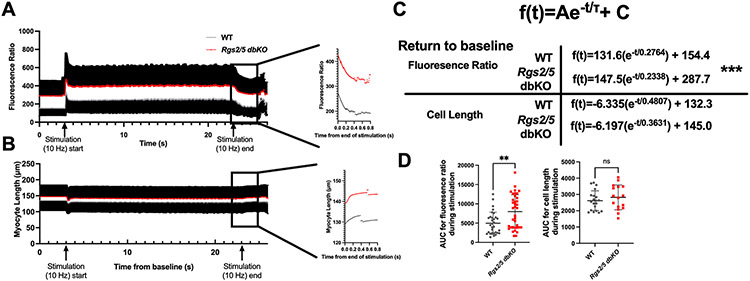
Methods and results: We found that Rgs2/5 dbKO mice showed left ventricular dilatation at baseline by echocardiography. Cardiac contractile response to dobutamine stress test was sex-dependently reduced in male Rgs2/5 dbKO relative to WT mice. When subjected to surgery-induced stress, male Rgs2/5 dbKO mice had 75% mortality within 72-96 h after surgery, accompanied by elevated baseline blood pressure and decreased cardiac contractile function. At the cellular level, cardiomyocytes (CM) from Rgs2/5 dbKO mice showed augmented Ca2+ transients and increased incidence of arrhythmia without augmented contractile response to electrical field stimulation (EFS) and activation of β-adrenergic receptors (βAR) with isoproterenol. Dual loss of Rgs2 and 5 suppressed forskolin-induced cAMP production, which was restored by Gi/o inactivation with pertussis toxin that also reduced arrhythmogenesis during EFS or βAR stimulation. Cardiomyocyte NCX and PMCA mRNA expression was unaffected in Rgs2/5 dbKO male mice. However, there was an exaggerated elevation of EFS-induced cytoplasmic Ca2+ in the presence of SERCA blockade with thapsigargin.

Conclusions: We conclude that RGS2 and 5 promote normal ventricular rhythm by coordinating their regulatory activity towards Gi/o signaling and facilitating cardiomyocyte calcium handling.

Keywords: Arrhythmia; Cardiac excitation-contraction coupling; Cardiomyopathy; Catecholamine; G protein signaling; RGS proteins; cAMP.


Figures

Fig. 1.
Fig. 1.
Cardiac phenotype of Rgs2/5 dbKO mice. A) Representative images of apparent cardiac hypertrophy in adult male and female Rgs2/5 dbKO mice compared to their WT cohorts. B) Gravimetric analysis showing increased heart weight in female (n = 7 of each genotype) and male (n = 10 of each genotype) WT vs. Rgs2/5 dbKO mice. Heart weight (HW) was normalized to tibia length (TL). C) Lung weight (LW) of WT and Rgs2/5 dbKO female and male mice was normalized to body weight (BW). D) Representative B- (top) and M-mode (bottom) of left ventricular (LV) echocardiographs of adult male WT and Rgs2/5 dbKO mice acquired under isoflurane anesthesia. E) Summarized results of analyzed echocardiographs of adult WT and Rgs2/5 dbKO mice (n = 5 of each genotype and sex). F) Representative B- (top) and M-mode (bottom) of left ventricular (LV) echocardiographs of young (30 days old) male WT and Rgs2/5 dbKO mice acquired under isoflurane anesthesia. G) Summarized results of analyzed echocardiographs of young WT and Rgs2/5 dbKO mice (n = 6 of each genotype and sex). Bar graph values are mean ± s.e.m. LV internal dimension at systole (LVID;s) and at diastole (LVID;d) are indicated by the bidirectional arrows in the echocardiograms. LVMI, LV mass index; LV Vol;d, LV volume at diastole; LV Vol;s, LV volume at systole; LV FS, LV fractional shortening. *, **P < 0.05, 0.01.
Fig. 2.
Fig. 2.
Examination of baseline cardiac function using pressure-volume (PV) loop analysis of left ventricle hemodynamics. A, B) Representative PV loops at baseline and during occlusion of the inferior vena cava in male wild type (solid blue lines) and Rgs2 dbKO (dash red lines) mice. Steepness of the end-systolic pressure volume relationship (Ees), reflecting contractile function of each genotype, is indicated by the black tangent lines. C – O) Bar graphs showing summary data from analysis of 10–15 PV loops of male and female WT (n = 20 male & 8 female) and Rgs2/5 dbKO (n = 15 male & 11 female) mice. Male Rgs2/5 dbKO hearts display reduced ejection fraction (EF), with trends towards decreased stroke volume (SV) and cardiac output, and enlarged left ventricle, while female Rgs2/5 dbKO hearts show augmented end-systolic elastance (Ees), reflecting increased contractile function. Both male and female Rgs2/5 dbKO mice show a trend towards increased arterial elastance (Ea), reflecting increased total ventricular afterload likely resulting from elevated systolic blood pressure. Bar graph values are mean ± s.e.m. LVSP, left ventricular systolic pressure; CO, cardiac output; ESV, end-systolic volume; EDV, end-diastolic volume; Tau, relaxation time constant; +dp/dt, peak rate of LV pressure rise; −dp/dt, peak rate of LV pressure decline; SW, stroke work. P values were obtained by 2-way ANOVA for sex and genotype, followed by Sidak post hoc test.
Fig. 3.
Fig. 3.
Echocardiographic analysis of changes in percent fractional shortening (%FS) and heart rate of male and Female WT (n = 6 male & 6 female) and Rgs2/5 dbKO (n = 6 male & 5 female) mice in response to acute intraperitoneal infusion of the β1-adrenergic agonist, dobutamine, under isoflurane anesthesia. A working solution of dobutamine hydrochloride (Dobutamine, 10 μg/μl) was prepared from dobutamine stock (1 g/ml in DMSO) in 1:100 dilution in normal saline. After baseline acquisition, each mouse received intraperitoneal infusion of dobutamine (5 μg/kg/min) for 1 min, using an infusion pump. Changes in left ventricular M-mode fractional shortening in response to the infusion were calculated offline. Values are mean ± s.e.m. P value was repeated measures ANOVA followed by Sidak post hoc test.
Fig. 4.
Fig. 4.
Baseline blood pressure and heart rate of male and female WT and Rgs2 dbKO mice measured under isoflurane anesthesia and in conscious state. A, B) Mean arterial pressure (MAP) and heart rate, respectively, of WT and Rgs2/5 dbKO mice under isoflurane anesthesia. C) Survival curve of WT and Rgs2/5 dbKO mice following telemetry implantation surgery. Systolic blood pressure, diastolic blood pressure (DBP), and heart rate (HR) of male (D) and female (E) mice were monitored starting immediately after the surgical procedure and throughout the recovery period. Values are mean ± s.e.m. **P < 0.05, 0.01.
Fig. 5.
Fig. 5.
Summary data of telemetry electrocardiography (ECG) from conscious male WT and Rgs2/5 dbKO mice before and after acute intraperitoneal administration of the non-selective β-adrenergic agonist, isoproterenol (ISO) and during involuntary swimming. A) Web graphs of male WT (n = 4) and Rgs2/5 dbKO (n = 5) mice before and after a bolus ISO injection (0.75 mg/kg, i.p.). B) Web graphs of male WT (n = 4) and Rgs2/5 dbKO (n = 5) mice before and during a 90-min forced-swim exercise. The frequency of each cardiac event at baseline was calculated as percent of total events in each genotype, while the frequency after ISO injection was calculated as percent change of a given event from baseline of the genotype. AV block, atrio-ventricular block; V ectopic, ventricular ectopic; PAC, premature atrial contraction; PVC Single, single premature ventricular contraction; V Bigeminy, ventricular bigeminy; V Trigeminy, ventricular trigeminy; V triplet, ventricular triplet.
Fig. 6.
Fig. 6.
Adult left ventricular myocytes from male Rgs2/5 dbKO mice show impaired excitation-contraction (E-C) coupling. A) Representative tracings of Ca2+ transients and contractility, respectively, of male WT and Rgs2/5 dbKO cardiomyocytes subjected to a train of electrical field stimulation (EFS, 10 V at 0.5–5.0 Hz). The zoom-in of the E-C coupling tracings show a slower rate of contraction and missing Ca2+ transients and contractions (arrows) in tracings from Rgs2/5 dbKO cardiomyocytes. B, C) Representative tracings of single contractility (left) and Ca2+ transients (right) of male WT and Rgs2/5 dbKO cardiomyocytes subjected to EFS at 0.5 Hz. D – I) Summary graphs of contractility and calcium transient characteristics during EFS application in cardiomyocytes from male WT and Rgs2/5 dbKO mice (n = 50 cells from 9 to 12 hearts of each genotype). Cardiomyocytes from Rgs2/5 dbKO mice show increased amplitude of Ca2+ transients without a corresponding increase in percent shortening or contractility relative to the response in WT cells (D & E). Both the overall level of contraction and the amount of cytosolic Ca2+ accumulation, determined by the area under the curve from the start to the peak of the contractile and transient traces (F & G), are augmented in Rgs2 dbKO cells. Similarly, relaxation and clearance of cytosolic Ca2+ (H & I) are delayed in Rgs2 dbKO relative to WT cells. All values are mean ± s.e.m. **P < 0.01 vs. WT at 0.5 Hz; ##P < 0.01 vs. Rgs2 dbKO at 0.5 Hz; ^^P < 0.01 WT vs. Rgs2 dbKO. P values were from Sidak post hoc analysis following a mixed-effects ANOVA.
Fig. 7.
Fig. 7.
Dual loss of RGS2 and 5 increases Gi/o activity and suppresses cAMP production in adult ventricular cardiomyocytes. Freshly isolated adult ventricular myocytes from wild type (WT, n = 6), Rgs2 knockout (Rgs2 KO, n = 8), Rgs5 knockout (Rgs5 KO, n = 8), and Rgs2/5 double knockout (Rgs2/5 dbKO, n = 8) male mice were stimulated with 1, 10, or 50 μM forskolin in the absence or presence of the selective α2-adrenergic receptor agonist, UK-14,304 (1 μM). Different batches of WT and Rgs2/5 dbKO cells were pre-incubated with 200 or 750 ng/ml of pertussis toxin (PTX) for 2 h prior to forskolin stimulation. All experiments were performed in the presence of 500 μM 3-isobutyl-1-methylxannthine (IBMX). All values are mean ± s.e.m. **P < 0.01 vs. respective control; ##P < 0.01 vs. WT treated with 50 μM forskolin; ^^P < 0.01, WT cells treated with PTX and 50 μM forskolin vs. Rgs2 dbKO cells treated with PTX and 50 μM forskolin. P values were obtained from 2-way ANOVA followed by Sidak post hoc tests.
Fig. 8.
Fig. 8.
Unregulated Gi/o activity contributes to cardiomyocyte arrhythmia resulting from the application of electrical field stimulation (EFS) or a β-adrenergic receptor (βAR) agonist. A) Stacked bar graph of percentages of male WT (n = 59 cells from 14 hearts), Rgs2 KO (n = 25 cells from 4 hearts), Rgs5 KO (n = 47 cells from 8 hearts), and Rgs2/5 dbKO (n = 47 cells from 12 hearts) cardiomyocytes developing arrhythmia following EFS application at 1–5 Hz. B) Stacked bar graph of percentages of total number of male WT (n = 59 cells from 14 hearts) and Rgs2/5 dbKO (n = 47 cells from 12 hearts) cardiomyocytes developing arrhythmia at 0.5 Hz, 10 V, following βAR stimulation with isoproterenol (ISO) from 10−9 to 10−5 M. For Gi/o inhibition, cardiomyocytes were incubated with pertussis toxin (PTX, 200 or 750 ng/ml) for 2 h prior to the application of EFS or ISO.
Fig. 9.
Fig. 9.
Dual deletion of RGS2 and 5 leads to exaggerated cytoplasmic Ca2+ rise following electrical field stimulation of adult ventricular myocytes. A, B) A time course of EFS-induced Ca2+ transient and contraction of ventricular myocytes from male WT (n = 40 cells from 10 hearts) and Rgs2/5 dbKO (n = 45 cells from 12 hearts) mice. Freshly isolated ventricular myocytes were treated with thapsigargin (1 μM) to block SERCA, followed by the application of EFS at 10 Hz (10 V) for 25 s, while monitoring cytoplasmic Ca2+ rise and clearance by Fluo-4 fluorescence imaging. The arrows indicate the beginning and the end of EFS application. The inset shows a zoomed section (indicated by the rectangle) of the Ca2+ transient and contraction at the end of the EFS and during the decay of the transients and myocyte relaxation. The line graphs are representative tracings obtained by curve fitting of the data in the zoomed-in section to a first order exponential decay equation shown in 9C. D) A dot plot of area under the curve (AUC) of the fluorescence ratio-time and myocyte length-time curves for the duration of the EFS train application, indicating total accumulated cytoplasmic Ca2+ and force generated during the application of the EFS train. Values are mean ± s.e.m. **P < 0.01. P values were obtained from an unpaired student’s t-test.

Similar articles

Cited by

References

    1. Cadrin-Tourigny J, Shohoudi A, Roy D, Talajic M, Tadros R, Mondesert B, Dyrda K, Rivard L, Andrade JG, Macle L, Guerra PG, Thibault B, Dubuc M, Khairy P, Decreased mortality with beta-blockers in patients with heart failure and coexisting atrial fibrillation: an AF-CHF substudy, JACC Heart Fail. 5 (2017) 99–106. - PubMed
    1. Hepler JR, Gilman AG, proteins G, Trends Biochem. Sci. 17 (1992) 383–387. - PubMed
    1. Chidiac P, Roy AA, Activity, regulation, and intracellular localization of RGS proteins, Recept. Channels 9 (2003) 135–147. - PubMed
    1. Riddle EL, Schwartzman RA, Bond M, Insel PA, Multi-tasking RGS proteins in the heart: the next therapeutic target? Circ. Res 96 (2005) 401–411. - PubMed
    1. Osei-Owusu P, Blumer KJ, Regulator of G protein signaling 2: a versatile regulator of vascular function, Prog. Mol. Biol. Transl. Sci 133 (2015) 77–92. - PMC - PubMed

Publication types