. 2022 Jun 3;13(1):3122.
doi: 10.1038/s41467-022-30797-4.

Low-degree mantle melting controls the deep seismicity and explosive volcanism of the Gakkel Ridge

Affiliations

Low-degree mantle melting controls the deep seismicity and explosive volcanism of the Gakkel Ridge

Ivan Koulakov et al. Nat Commun. .

Abstract

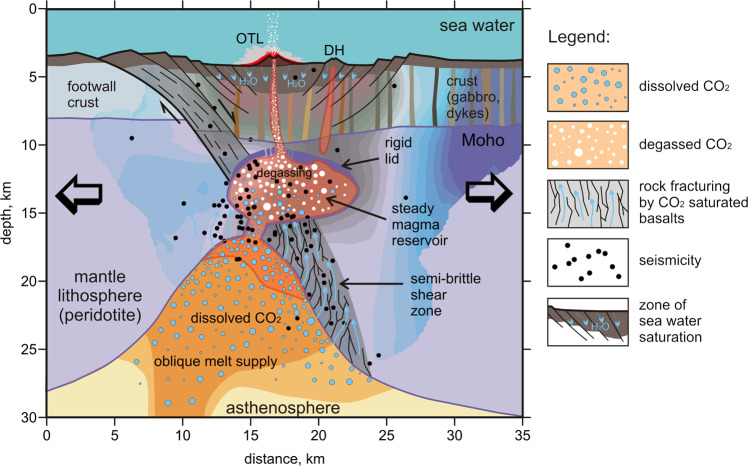
The world's strongest known spreading-related seismicity swarm occurred in 1999 in a segment of the Gakkel Ridge located at 85°E as a consequence of an effusive-explosive submarine volcanic eruption. The data of a seismic network deployed on ice floes were used to locate hundreds of local earthquakes down to ∼25 km depth and to build a seismic tomography model under the volcanic area. Here we show the seismicity and the distribution of seismic velocities together with the 3D magmatic-thermomechanical numerical model, which demonstrate how a magma reservoir under the Gakkel Ridge may form, rise and trigger volcanic eruptions in the rift valley. The ultraslow spreading rates with low mantle potential temperatures appear to be a critical factor in the production of volatile-rich, low-degree mantle melts that are focused toward the magma reservoirs within narrow magmatic sections. The degassing of these melts is the main cause of the explosive submarine eruptions.


Conflict of interest statement

The authors declare no competing interests.

Figures

Fig. 1
Fig. 1. Study area.
a Bathymetry of the Arctic Ocean. The target area of this study is indicated by the white rectangle. b Tracks of the station migrations (thin lines). Red points indicate the station locations when they recorded local earthquakes. The background shows the bathymetry. c The detailed relief and major geological structures in the volcanic area at 85°E in the area are indicated by the rectangle in b. Bathymetry data from ref. .
Fig. 2
Fig. 2. The Vp/Vs ratio distributions in two horizontal and two vertical sections.
The colored dots in the horizontal sections indicate the locations of earthquakes arranged by depth. The dotted lines indicate the border of the rift valley. The major volcanic structures are highlighted with solid black lines. The bathymetry is represented by thin contour lines (every 100 m). In the vertical sections, the black dots show the locations of events at distances less than 7 km. The red triangles depict the volcanic structures (e.g., OTL—Oden, Thor, Loke; DH—Duque’s Hills).
Fig. 3
Fig. 3. Numerical modeling of ultraslow spreading ridges at an evolution time of 10.4 Myr.
a Bathymetry. The red rectangle shows the area plotted in bg. The dashed red line in the red square shows the profile location (ridge = 63.5 km) in d and e. The thick dashed red and black lines show the magmatic and amagmatic sections along the spreading ridge, respectively. b, c Profiles of the compositions and second invariant of the strain rate tensor along spreading ridges. d, f. Profiles of the compositions and second invariant of the strain rate tensor along the dashed red line contained in the rectangle. The high strain localization of the hanging wall in e may provide the channel for melt migration and consequently form volcanoes at the seafloor. f, g Horizontal slices showing the compositions and second invariant of the strain rate tensor at a depth of 20 km. The dashed black lines show the locations of spreading ridges. The very thick crust is likely due to the overfocusing of crustal growth that is introduced by the current simplified melt extraction and transport algorithm (see discussion in Methods).
Fig. 4
Fig. 4. Interpretation of the resulting Vp/Vs ratios along a section that is oriented across the rift valley (vertical Section 2 in Fig. 2) by considering the numerical modeling results (Fig. 3d, e).
The black dots depict earthquakes. See details in the text.

References

    1. DeMets, C., Gordon, R. G., Argus, D. F. & Stein, S. Effect of recent revisions to the geomagnetic reversal time scale on estimate of current plate motions. Geophys. Res. Lett. 10.1029/94GL02118 (1994).
    1. Sella GF, Dixon TH, Mao A. REVEL: a model for recent plate velocities from space geodesy. J. Geophys. Res. Solid Earth. 2002;107:pp.ETG–11. doi: 10.1029/2000JB000033. - DOI
    1. Cochran, J. R., Kurras, G. J., Edwards, M. H. & Coakley, B. J. The Gakkel Ridge: Bathymetry, gravity anomalies, and crustal accretion at extremely slow spreading rates. J. Geophys. Res. Solid Earth10.1029/2002JB001830 (2003).
    1. Ryan WBF, et al. Global multi-resolution topography synthesis. Geochem. Geophys. Geosyst. 2009;10:1525–2027. doi: 10.1029/2008GC002332. - DOI
    1. Schlindwein V. Teleseismic earthquake swarms at ultraslow spreading ridges: indicator for dike intrusions? Geophys. J. Int. 2012;190:442–456. doi: 10.1111/j.1365-246X.2012.05502.x. - DOI