. 2022 Jun 3;13(1):3111.
doi: 10.1038/s41467-022-30575-2.

High resolution microfluidic assay and probabilistic modeling reveal cooperation between T cells in tumor killing

Affiliations

High resolution microfluidic assay and probabilistic modeling reveal cooperation between T cells in tumor killing

Gustave Ronteix et al. Nat Commun. .

Abstract

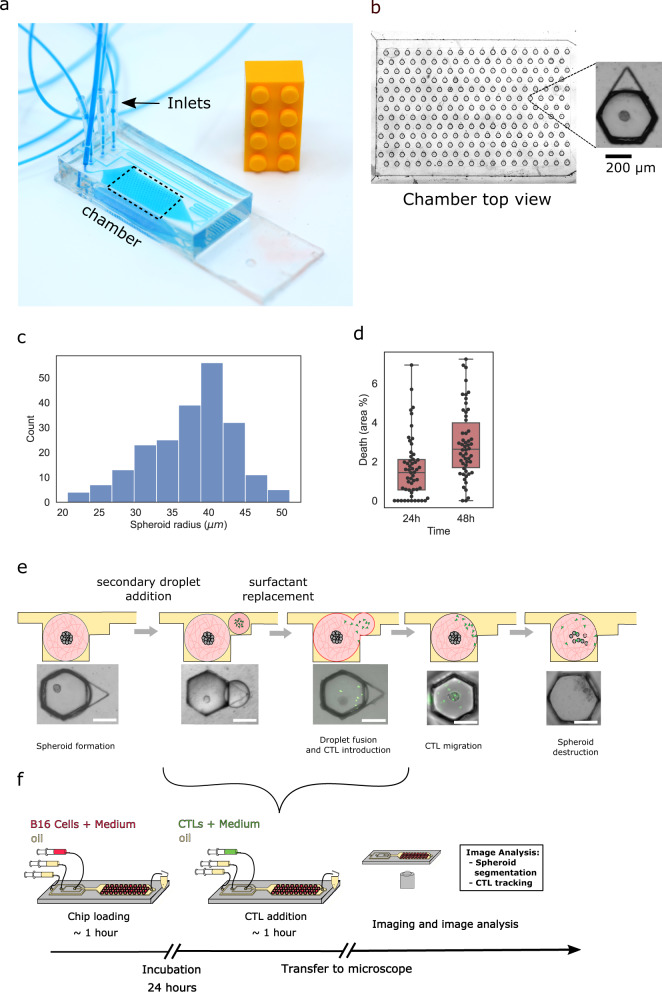
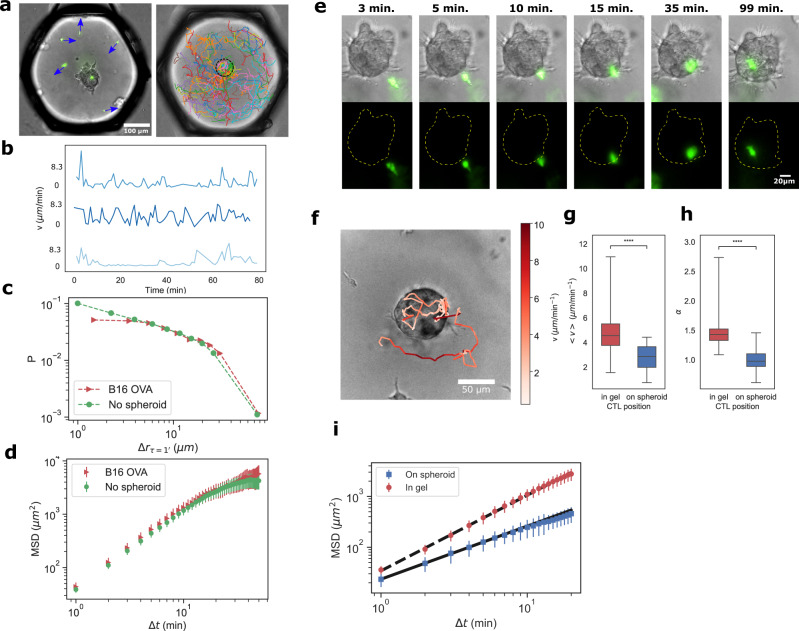
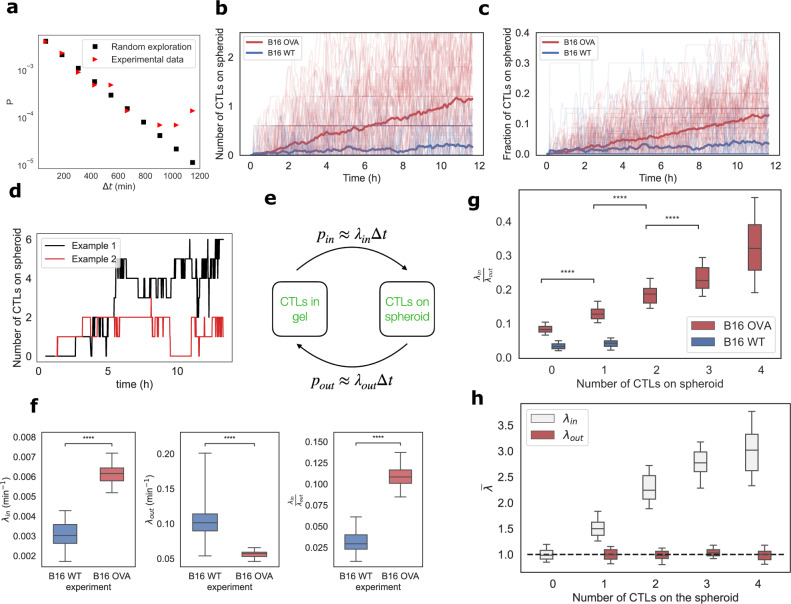
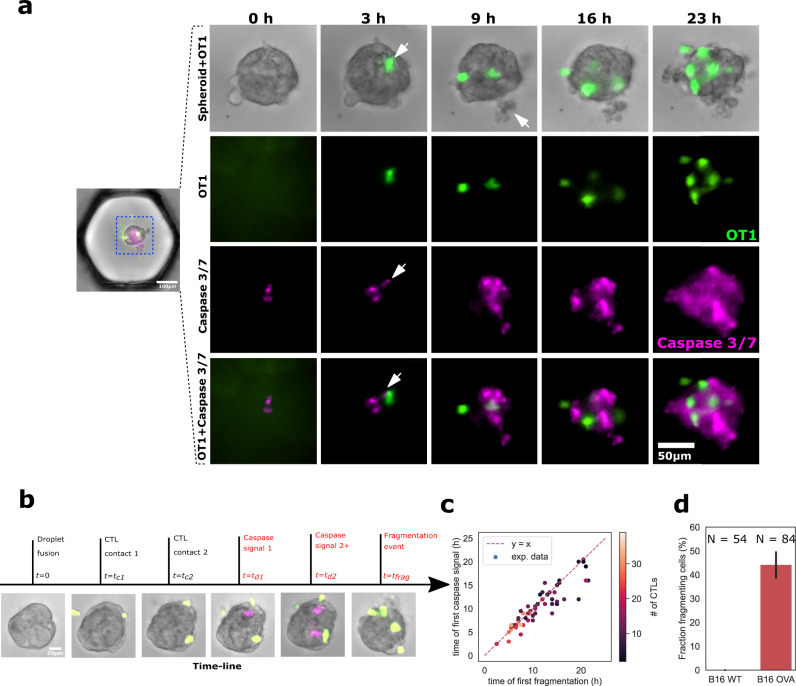
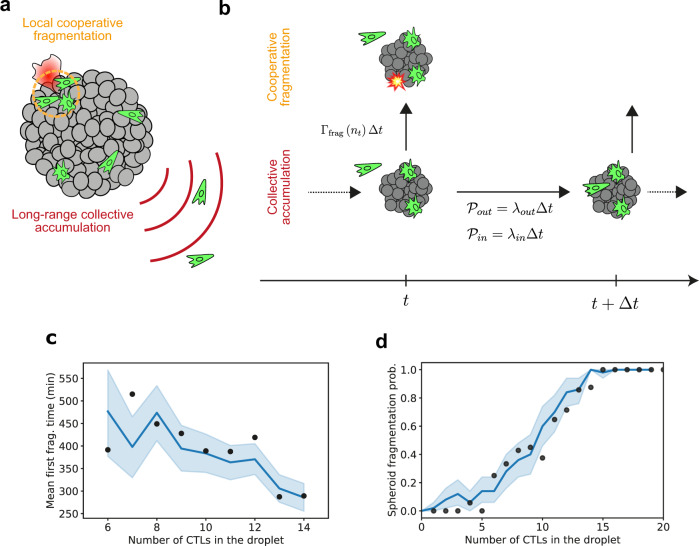
Cytotoxic T cells are important components of natural anti-tumor immunity and are harnessed in tumor immunotherapies. Immune responses to tumors and immune therapy outcomes largely vary among individuals, but very few studies examine the contribution of intrinsic behavior of the T cells to this heterogeneity. Here we show the development of a microfluidic-based in vitro method to track the outcome of antigen-specific T cell activity on many individual cancer spheroids simultaneously at high spatiotemporal resolution, which we call Multiscale Immuno-Oncology on-Chip System (MIOCS). By combining parallel measurements of T cell behaviors and tumor fates with probabilistic modeling, we establish that the first recruited T cells initiate a positive feedback loop to accelerate further recruitment to the spheroid. We also provide evidence that cooperation between T cells on the spheroid during the killing phase facilitates tumor destruction. Thus, we propose that both T cell accumulation and killing function rely on collective behaviors rather than simply reflecting the sum of individual T cell activities, and the possibility to track many replicates of immune cell-tumor interactions with the level of detail our system provides may contribute to our understanding of immune response heterogeneity.


Conflict of interest statement

C.N.B. is named inventor on several patents related to the technology. C.N.B. is also co-founder of the spinoff company Okomera. The remaining authors declare no competing interests.

Figures

Fig. 1
Fig. 1. Microfluidic immuno-oncology chip and protocol.
a Microfluidic chip on a standard glass slide. b Expanded view of the trapping region of the chip (dashed box) showing an array of 234 trapped droplets. Each droplet contains a single B16 spheroid in Matrigel, as shown in the inset. c Distribution of spheroid radii within a single chip (N = 215). d Viability measurements using live-dead staining after 24 and 48 h (N = 54). e Schematic showing a primary droplet with a tumor spheroid, followed by the addition and fusion of a secondary droplet containing GFP-labeled CTLs, eventually leading to tumor cell killing and spheroid fragmentation. Scale bar is 200 μm. f Schematic representation of the complete experimental protocol.
Fig. 2
Fig. 2. CTL migration in droplets recapitulates in vivo behavior.
a (left) Representative image of CTLs with instantaneous velocity vectors inside Matrigel droplet. (right) CTL tracks in one droplet over 24 h, each color represents an individual cell track. The dashed black circle outlines the spheroid boundary. b Representative velocities as a function of time for three different T cells. c Probability distribution of a cell to migrate by a given distance (Δr) during a fixed time step Δt = 1 min (n = 67965 points without spheroid and n = 34072 individual points for CTLs in presence of the B16 spheroids). d Mean-square displacement (MSD) of CTL migration with (N = 20 droplets) and without (N = 26 droplets) spheroids. Error bars represent the SEM. e Time sequence showing the initial CTL approach and contact with a spheroid. f Track of a single CTL as it migrates in the matrigel and on the spheroid surface. Colormap represents the instantaneous velocity of the cell. g, h Average velocity and mean square displacement exponent (α) of cells migrating in the gel and on the spheroid. Each data point is the average velocity in a given droplet (Ngel = 55, Nspheroid = 54, respective p-values of 1.3 × 10−10 and 1.2 × 10−15). i Mean-square displacement of cells migrating in the matrigel and on the spheroid. Bold and dashed lines represent the best fits for the MSD of CTLs on the spheroid and in the matrigel, with respective exponents of 1.1 and 1.4 (measurement conducted over N = 54 droplets). Error bars represent the SEM. Source data are provided as a Source data file.
Fig. 3
Fig. 3. CTL accumulation is  enhanced by a positive feedback-loop after first contact.
a Experimental distribution of first CTL-spheroid contact times and theoretical distribution for randomly migrating CTLs. b Number of CTLs detected on each spheroid and c the fraction per droplet as a function of time. Each thin line represents a single tracked spheroid, in bold is the averaged value. In red is the accumulation for B16-OVA spheroids and in blue for B16 WT spheroids [84 individual B16-OVA spheroids and 81 B16 WT spheroids tracked]. d Number of CTLs as a function of time on two representative spheroids showing the detection of attachment/detachment events. e Schematic of the stochastic accumulation model: CTLs can switch from the gel to the spheroid with different probabilities. pint) (conv. poutt)) is the probability for a cell to attach to (conv. detach from) the spheroid during a time interval Δt. Counting attachment and detachment events in the experiments allow us to infer the rates λin and λout. f Estimates for the attachment rates (λin), detachment rates (λout), and affinity ratio (λin/λout) for B16-WT (blue) and B16-OVA (red) cells. The box plots are obtained by using a bootstrapping method with 50 repetitions as described in the methods (respective p-values of 7 × 10−18, 1.2 × 10−16, and 7 × 10−18). g The affinity ratio as a function of the number of CTLs detected on the spheroid for B16 WT and B16 Ova spheroids (respective p-values of 6 × 10−9, 3 × 10−15, and 1.3 × 10−13). h Normalized attachment rate λin (white) and detachment rate λout (red) as a function of the number of CTLs attached to the spheroid. λin and λout are normalized by their mean values for 0 and 1 CTL on the spheroid, respectively. Source data are provided as a Source data file.
Fig. 4
Fig. 4. CTLs kill tumor cells within spheroids.
a Representative sequence showing CTL (OT1) positions on the spheroid, caspase 3/7 fluorescent death marker, and B16 cell fragmentation. The white arrow at 3h indicates the appearance of capsase signal next to a CTL. At 9 h it represents a fragmented dead cell. b Representative chronology showing the key events for a given spheroid interaction with CTLs: Contact times of CTLs on spheroids, detection of caspase 3/7 signal, detection of fragmentation events. c Time of first caspase signal vs. first observation of cell fragmentation. d Percentage of WT (black) and OVA (red) spheroids that show at least one fragmentation event in under 14 h. N equals 54 and 84 spheroids, respectively. The error bar is the SEM. Source data are provided as a Source data file.
Fig. 5
Fig. 5. CTL number and collective behavior determine probability of killing.
a Two representative images showing CTL clustering on the spheroid during first fragmentation event. The white circles have a radius of 30 μm around fragmenting cell. b Distribution of the CTL numbers within a radius ≤30 μm around the fragmentation areas (N = 31). c Sketch summarizing the observed trends: CTLs (green) migrate on the surface of the spheroid and cluster together in particular regions, where fragmentation of B16 cells (red) is observed. d During a time-interval Δt, a spheroid with n CTLs attached to it has a probability ΓfragΔt of fragmenting. e Illustration of possible scenarios of the number of CTLs on the spheroids and the apparition of fragmentation. f The fragmentation rate Γfrag can be modeled as the result of independent CTLs interacting with the spheroid, with an individual fragmentation rate per CTL worth ρ. Conversely, the fragmentation rate can be viewed as the result of a collaborative process. g Estimates of Γfrag as a function of the number of CTLs on the spheroid n. Experimental measurements (N = 84, black dots) are fitted with an exponential (dashed red line) compared with the results of the independent CTL model (dashed blue line). Source data are provided as a Source data file.
Fig. 6
Fig. 6. Combining short and long-range interactions to simulate spheroid fate.
a The concentration-dependent killing is modeled as the result of two complementary mechanisms: long-distance cooperative attraction of CTLs to the target site and local killing cooperation on the spheroid. b The evolution of the spheroid fate in the droplets can be modeled as a branching process: at each time step the spheroid can fragment with a probability ΓfragΔt or not, and CTLs can either attach to or detach from the spheroid. c Simulations of the spheroid fate using the model in (b) and parameters obtained above recover the experimentally derived first-fragmentation times. Shaded area represents the 95% confidence interval of simulated data. The bold line represents the mean. d Experimental (black dots) and simulated (blue line) spheroid fragmentation probability as a function of the number of CTLs in the droplet. Shaded area represents the 95% confidence interval of simulated data. The bold line represents the mean. Source data are provided as a Source data file.

References

    1. Sharma P, Allison JP. The future of immune checkpoint therapy. Science. 2015;348:56–61. - PubMed
    1. June, C. H. & Sadelain, M. Chimeric antigen receptor therapy. N. Engl. J. Med.379, 64–73 (2018). - PMC - PubMed
    1. Fridman WH, Pagès F, Sautes-Fridman C, Galon J. The immune contexture in human tumours: Impact on clinical outcome. Nat. Rev. Cancer. 2012;12:298–306. doi: 10.1038/nrc3245. - DOI - PubMed
    1. Vasconcelos Z, et al. Individual human cytotoxic T lymphocytes exhibit intraclonal heterogeneity during sustained killing. Cell Rep. 2015;11:1474–1485. doi: 10.1016/j.celrep.2015.05.002. - DOI - PubMed
    1. Boulch M, Grandjean CL, Cazaux M, Bousso P. Tumor immunosurveillance and immunotherapies: a fresh look from intravital imaging. Trends Immunol. 2019;40:1022–1034. doi: 10.1016/j.it.2019.09.002. - DOI - PubMed

Publication types