. 2022 Jun 3;13(1):3101.
doi: 10.1038/s41467-022-29949-3.

Unraveling function and diversity of bacterial lectins in the human microbiome

Affiliations

Unraveling function and diversity of bacterial lectins in the human microbiome

Louis J Cohen et al. Nat Commun. .

Abstract

The mechanisms by which commensal organisms affect human physiology remain poorly understood. Lectins are non-enzymatic carbohydrate binding proteins that all organisms employ as part of establishing a niche, evading host-defenses and protecting against pathogens. Although lectins have been extensively studied in plants, bacterial pathogens and human immune cells for their role in disease pathophysiology and as therapeutics, the role of bacterial lectins in the human microbiome is largely unexplored. Here we report on the characterization of a lectin produced by a common human associated bacterium that interacts with myeloid cells in the blood and intestine. In mouse and cell-based models, we demonstrate that this lectin induces distinct immunologic responses in peripheral and intestinal leukocytes and that these responses are specific to monocytes, macrophages and dendritic cells. Our analysis of human microbiota sequencing data reveal thousands of unique sequences that are predicted to encode lectins, many of which are highly prevalent in the human microbiome yet completely uncharacterized. Based on the varied domain architectures of these lectins we predict they will have diverse effects on the human host. The systematic investigation of lectins in the human microbiome should improve our understanding of human health and provide new therapeutic opportunities.


Conflict of interest statement

The authors declare no competing interests.

Figures

Fig. 1
Fig. 1. Cbeg4 and Cbeg5 glycomics.
a Cbeg5 functional domains (InterPro) and protein constructs created for bioactivity assays (box). b Cbeg4 and Cbeg5 protein constructs were generated containing only the CBM domain and a GFP tag. The Cbeg5 CBM protein (CBM5) and the Cbeg4 CBM protein (CBM4) were assessed in a binding assay against a panel of 609 N-linked and O-linked glycans (Functional Glycomics Consortium). CBM5 and CBM4 were assayed at 5 μg ml−1 and 50 μg ml−1 in 6 replicates and glycan binding quantified as relative fluorescent units (RFU). Dot plots of CBM4 and CBM5 glycan binding screens at a concentration of 5 μg ml−1 (mean ± s.e.m). c Plot of CBM4 vs CBM5 glycan binding normalized to the top glycan binder (set at RFU = 1). Protein concentration is 50 μg ml−1. d The structure of the top bound glycan (red dot in b, c) is pictured. Analysis of CBM4/CBM5 bound and unbound glycans identifies a conserved binding motif outlined in red dotted line (glycopattern). e A Glyconnect search of glycomics datasets for samples containing the conserved N-linked glycan motif was performed. Glycan structures containing the conserved binding motif were most commonly identified in human leukocyte datasets (11/12 glycan structures). Four glycan structures were shared by human leukocyte, urine and kidney datasets. One glycan structure was exclusive to a kidney dataset.
Fig. 2
Fig. 2. PBMC response to Cbeg5.
Fresh PBMC were isolated from healthy patients and exposed to Cbeg5, Fn5 and PBS for 6 h and analyzed by CyTOF with a panel of 16 cell surface and 10 cytokine markers. a Cell surface markers distinguish major immune cell populations (A–K) that correlate to groups identified by tSNE analysis (Supplementary Fig. 2). b Fold induction of 10 cytokines across cell populations A–K from (a). Fold induction is calculated relative to PBS control. Cytokine responses > 3-fold to > 100-fold are marked with gray-shaded boxes. Proteins assayed at 100 nM or 1000 nM as indicated. (Data is a single experiment. PBS data is normalized to a replicate experiment with PBS). c Bar graph (mean ± s.e.m) of percent positive cells for each cytokine in specific cell populations in response to Cbeg5 or FN3 control at 500 nM concentration (N = 5 from three independent experiments, unpaired, two-sided Mann–Whitney test comparing Cbeg5 to Fn3 control in each cell population) ***p < 0.001 **p < 0.01 *p < 0.05.
Fig. 3
Fig. 3. Intestinal leukocyte response to Cbeg5.
Fresh colon tissue was obtained from patients at the time of surgery for isolation of lamina propria leukocytes (LPL). a LPL cells were exposed to Cbeg5 or Fn5, analyzed by CyTOF and the data evaluated by SPADE. A SPADE plot for Cbeg5 induced TNF-α production from intestinal leukocytes. Fold induction calculated relative to Fn5. Cbeg5 induces cytokine production in two myeloid cell clusters (CD19CD56CD66bHLADR+) that are CD14hi or CD1chi. Clusters are annotated by manual gating of indicated cell surface markers. b Cells from the CD14 cluster and CD1c cluster were analyzed to identify CD14+CD4+ cells (monocyte derived macrophage markers) and CD14+CD1c+ cells (monocyte derived dendritic cell markers). Bar graphs depict Cbeg5 induced cytokine production in CD14+CD4+ and CD14+CD1c+ cells (mean ± s.e.m, N = 2, two independent experiments). c Isolated blood CD14+ monocytes were differentiated in vitro into macrophages (MDM) and dendritic cells (moDC) and exposed to 500 nM concentrations of Cbeg5, Fn5 and PBS. Cytokines, chemokines, growth factors and adhesion molecules were analyzed by Luminex (Procarta PlexTM). Heatmap of cytokine production with > 3-fold to > 100-fold induction shown with gray shaded boxes (induction relative to PBS control, data is mean of triplicate experiments for CD14+ monocytes and duplicate experiments for mMAC, mDC). d Bar graph of cytokine or chemokine and adhesion molecule production for cell populations in response to Cbeg5. Bar graph colors are derived from labels used in the heatmap (c).
Fig. 4
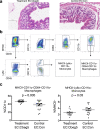
Fig. 4. Immune response to Cbeg5 expression in vivo.
Wild-type 8-week C57BL/6 mice were colonized with E. coli engineered to express Cbeg5 (Treatment, EC:Cbeg5) or E. coli with an empty vector (Control, EC:Con). After 1 week of colonization the colon was analyzed for inflammatory changes by histology (a) and for change in immune cell populations by flow cytometry (b, c). a No difference was observed in colon histologic inflammatory indices (one representative image, Supplementary Fig. 5). b After gating for singlets and live cells (Aqua LIVE/DEAD) the gating schema is shown for identification of macrophages MHCII+CD11c+CD64+CD11b+ and monocytes MHCII-Lyc+CD11b+. c There was a significant increase in lamina propria MHCII+CD11c+CD64+CD11b+ macrophages and a decrease in MHCIILyc+CD11b+ monocytes in the treatment group (N = 16 (8 M/8 F) Treatment, N = 18 (9 M/9 F) Control. Data represents 4 independent experiments. Error bars are mean ± s.e.m. Control and treatment populations compared using an unpaired, two-sided Mann–Whitney test).
Fig. 5
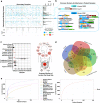
Fig. 5. Human-microbial-lectin prevalence and diversity.
a All domains present in the human-microbial lectin dataset are organized based on co-occurrence between a carbohydrate-binding domain and secondary domains in the same lectin. Bar graphs summarize the count of each domain in the dataset and box color reflects the frequency of domain co-occurrence. b Lectin domain architectures containing the Cbeg4/5 carbohydrate-binding domain (IPR33803) and the Bacteroidetes-Associated Carbohydrate-binding Often N-terminal domain (IPR024361) are pictured. IPR0244361 is the most common domain in the human-microbial-lectin dataset and present in 891 lectins. The most prevalent lectins (top 10% for each body site) containing these domains are pictured. For IPR33803 only the Cbeg4/5 domain architecture is identified in abundance in patient samples. c prevalence of human-microbial-lectins in patient samples from the Human Microbiome Project. Red bar is mean ± SEM. Summary of the average number of human-microbial-lectins per person for each body site is pictured. Color of circle is proportional to the mean lectin count with stool set as 100%. d Overlap of lectin genes between five body sites. e Rarefaction analysis of human-microbial-lectin genes for each body site based on number of samples from the Human Microbiome Project. Stool is pictured on a separate plot due to the large number of lectin sequences. Human digestive tract image in c is from the National Institute of Diabetes and Digestive and Kidney Diseases media library.

Similar articles

Cited by

References

    1. Backhed F, et al. Defining a healthy human gut microbiome: current concepts, future directions, and clinical applications. Cell Host Microbe. 2012;12:611–622. doi: 10.1016/j.chom.2012.10.012. - DOI - PubMed
    1. Cho I, Blaser MJ. The human microbiome: at the interface of health and disease. Nat. Rev. Genet. 2012;13:260–270. doi: 10.1038/nrg3182. - DOI - PMC - PubMed
    1. Huttenhower C, et al. Structure, function and diversity of the healthy human microbiome. Nature. 2012;486:207–214. doi: 10.1038/nature11234. - DOI - PMC - PubMed
    1. Cohen LJ, et al. Functional metagenomic discovery of bacterial effectors in the human microbiome and isolation of commendamide, a GPCR G2A/132 agonist. Proc. Natl Acad. Sci. USA. 2015;112:E4825–E4834. - PMC - PubMed
    1. Estrela, A. B. et al. Functional multigenomic screening of human-associated bacteria for NF-kappaB-inducing bioactive effectors. mBio10. 10.1128/mBio.02587-19 (2019). - PMC - PubMed

Publication types