. 2022 Jun 3;13(1):3106.
doi: 10.1038/s41467-022-30897-1.

Untangling the changing impact of non-pharmaceutical interventions and vaccination on European COVID-19 trajectories

Affiliations

Untangling the changing impact of non-pharmaceutical interventions and vaccination on European COVID-19 trajectories

Yong Ge et al. Nat Commun. .

Abstract

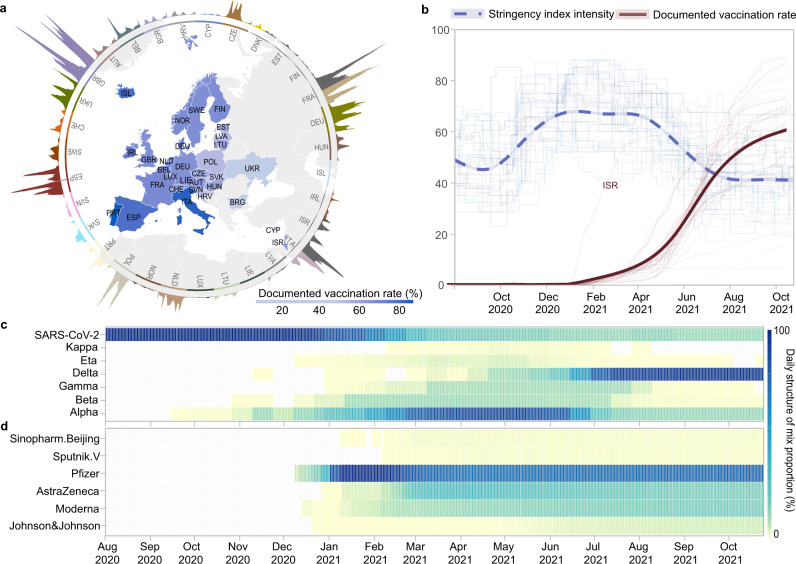
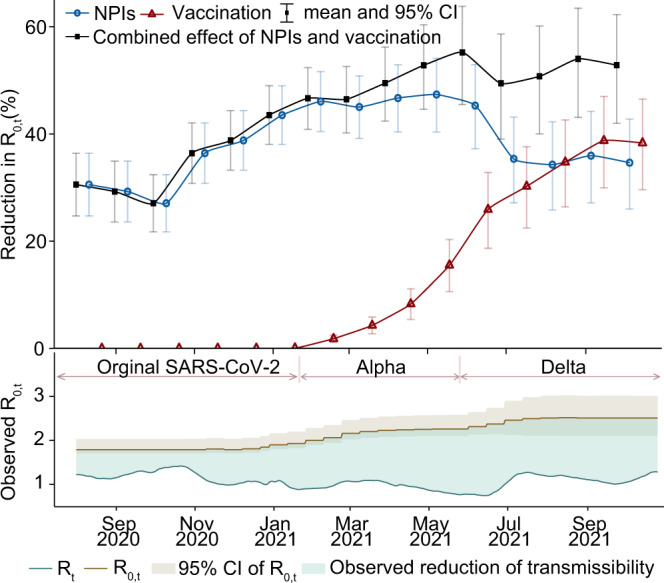
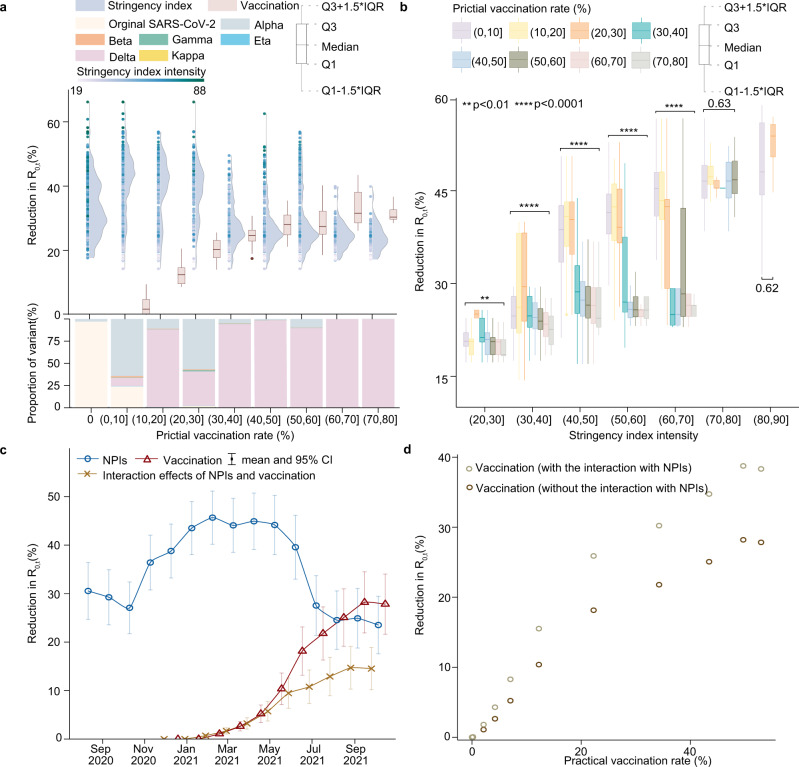
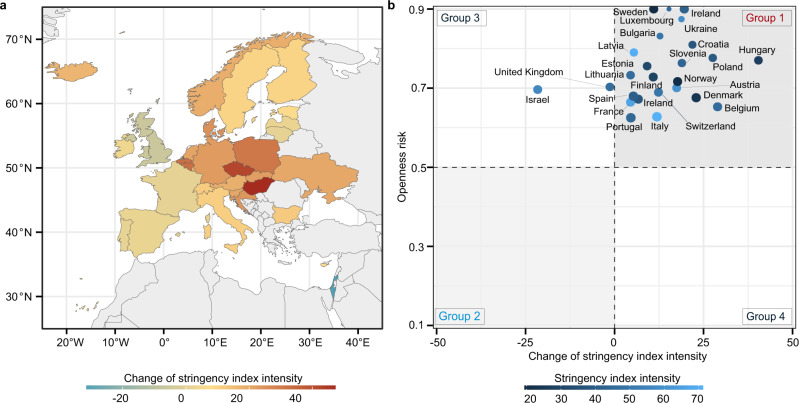
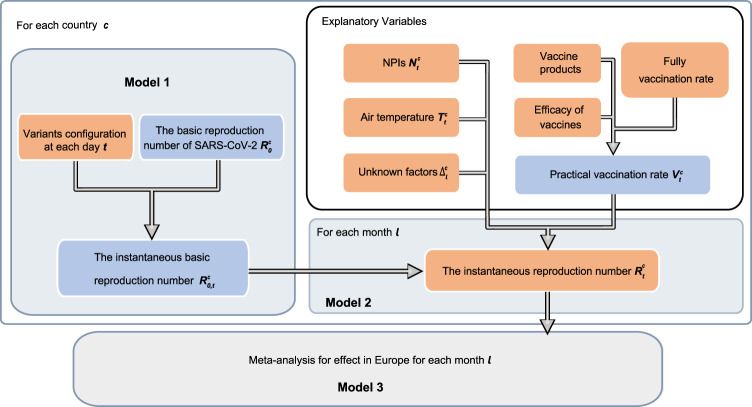
Non-pharmaceutical interventions (NPIs) and vaccination are two fundamental approaches for mitigating the coronavirus disease 2019 (COVID-19) pandemic. However, the real-world impact of NPIs versus vaccination, or a combination of both, on COVID-19 remains uncertain. To address this, we built a Bayesian inference model to assess the changing effect of NPIs and vaccination on reducing COVID-19 transmission, based on a large-scale dataset including epidemiological parameters, virus variants, vaccines, and climate factors in Europe from August 2020 to October 2021. We found that (1) the combined effect of NPIs and vaccination resulted in a 53% (95% confidence interval: 42-62%) reduction in reproduction number by October 2021, whereas NPIs and vaccination reduced the transmission by 35% and 38%, respectively; (2) compared with vaccination, the change of NPI effect was less sensitive to emerging variants; (3) the relative effect of NPIs declined 12% from May 2021 due to a lower stringency and the introduction of vaccination strategies. Our results demonstrate that NPIs were complementary to vaccination in an effort to reduce COVID-19 transmission, and the relaxation of NPIs might depend on vaccination rates, control targets, and vaccine effectiveness concerning extant and emerging variants.


Conflict of interest statement

The authors declare no competing interests.

Figures

Fig. 1
Fig. 1. Overview of the data context in 31 countries from 1 August 2020 to 25 October 2021.
a Daily confirmed cases (outside the circle) and documented vaccination rates (inside the circle). b The stringency index of ‘lockdown’ style NPIs (shallow blue lines) and the documented vaccination rate (shallow red lines) across 31 countries. The documented vaccination rate refers to the proportion of the total population who were fully vaccinated in each country. The corresponding curves (thick blue and red lines) were fitted by the locally weighted smoothing method using national data, representing overall NPIs and vaccination rate in Europe (including Israel). c Daily proportion of infections caused by SARS-CoV-2 and its variants, and (d) daily proportion of different COVID-19 vaccine products used, where the values of each indicator within each day add up to 1. c, d share the same right colour legend.
Fig. 2
Fig. 2. The effects of NPIs and vaccination on reducing COVID-19 transmission in Europe over time.
The overall monthly effects of interventions on reducing R0,t across 31 countries from 1 August 2020 to 25 October 2021 are presented with mean and 95% CI, which was pooled from national level to regional level using meta-analysis. The total effect of NPIs presented here is the effect of NPIs alone plus their interaction effect with vaccination, and the total effect of vaccination shown is the impact of vaccination alone plus its interaction effect with NPIs. In the bottom panel, the light blue area between R0,t (instantaneous basic reproduction number) and Rt (instantaneous reproduction number [solid line]) illustrates the observed reduction of COVID-19 transmissibility. R0,t are presented with mean (dash line) and 95% CI (grey area). Periods in which Alpha and Delta variants were dominant (>50%) are also shown by pink lines and relevant text.
Fig. 3
Fig. 3. The interaction effect of NPIs and vaccination on reducing COVID-19 transmission in populations across 31 countries.
a The effects attributed to NPIs (raincloud plots in blue) and vaccination (boxplots in pink) under different practical vaccination rates. The raincloud plot visualises the intensity of stringency index (points) and the probability density of its effect. The boxplot presents the median and interquartile range. The stacked bar chart in the bottom illustrates the composition of COVID-19 variants under various vaccination levels from 1 August 2020 to 25 October 2021. The numbers of independent samples for boxplot from left (0–10% practical vaccination rate) to right (70–80% practical vaccination rate) are n = 4434, 962, 807, 900, 838, 1086, 497, and 187, respectively. b The effects of vaccines under different vaccination rates and stringency of NPIs. The effect of different practical vaccination rates within each NPI stringency group was assessed by one-way ANOVA (**p < 0.01, ****p < 0.0001). P-values are produced by two sided Wilcoxon test. The numbers of total independent samples form left (20< stringency index < = 30) to right (80< stringency index < = 90) are n = 466, 1334, 2173, 2055, 1805, 1387, and 459, respectively. c The respective effects attributed to NPIs (in blue) and vaccination (in red), and the interaction effect between NPIs and vaccination (in yellow) over time across 31 countries. d The comparison of vaccination effects with/without the interaction with NPIs.
Fig. 4
Fig. 4. The possible relaxation of NPIs or the requirement of extra stringency to contain COVID-19 across countries.
a Under the scenario of vaccination and COVID-19 transmission by 25 October 2021, required changes of NPI stringency index to contain COVID-19 (Rt<1). The negative change means the degree of NPI relaxation, compared to the stringency on 25 October 2021. b The comparison between the estimated requirement of changes in NPI stringency index presented in (a) and the output of the openness risk (from 0 to 1) - an indicator modified from the OxCGRT’s approach. A higher openness risk ( > 0.5) means an increasing likelihood of COVID-19 resurgence, and vice versa. Countries in Group 1 (increasing NPI stringency) and Group 2 (relaxing NPIs) mean that they have consistent findings between two indicators. Groups 3 and 4 mean that the two indicators have conflicting results and extra evidence might be needed.
Fig. 5
Fig. 5. Overview of models using bottom-up approaches.
Orange nodes represent the observed data. Blue nodes represent the pseudo variables generated by the observed data. For each country, we put a prior on R0 with hyperprior varying by country, where the prior mean was setted as the highest Rt before 1 December 2020, see Supplementary Information A2. Then, R0,t representing the intrinsic transmissibility was estimated by Model 1. By comparing observed Rt with R0,t in Model 2, we estimated coefficients of variables to assess respective effects attributed to various interventions and factors on curbing COVID-19 for each country by month. A variable, represented by the residual Δ, was used to characterise the impact of other unknown factors on Rt in addition to practical vaccination rate, NPIs and air temperature. Finally, the overall effect of NPIs and vaccination in the European region was evaluated in Model 3 by pooling the national effects across countries through meta-analysis with the random-effect model.

References

    1. Perra N. Non-pharmaceutical interventions during the COVID-19 pandemic: A review. Phys. Rep. 2021;913:1–52. doi: 10.1016/j.physrep.2021.02.001. - DOI - PMC - PubMed
    1. Lai S, et al. Effect of non-pharmaceutical interventions to contain COVID-19 in China. Nature. 2020;585:410–413. doi: 10.1038/s41586-020-2293-x. - DOI - PMC - PubMed
    1. Hsiang S, et al. The effect of large-scale anti-contagion policies on the COVID-19 pandemic. Nature. 2020;584:262–267. doi: 10.1038/s41586-020-2404-8. - DOI - PubMed
    1. Ge Y, et al. Impacts of worldwide individual non-pharmaceutical interventions on COVID-19 transmission across waves and space. Int. J. Appl. Earth Observation Geoinf. 2022;106:102649. doi: 10.1016/j.jag.2021.102649. - DOI - PMC - PubMed
    1. Fezzi C, Fanghella V. Tracking GDP in real-time using electricity market data: Insights from the first wave of COVID-19 across Europe. Eur. economic Rev. 2021;139:103907. doi: 10.1016/j.euroecorev.2021.103907. - DOI - PMC - PubMed

Publication types