. 2022 Jul 15:368:577897.
doi: 10.1016/j.jneuroim.2022.577897. Epub 2022 May 23.

Infiltration of peripheral immune cells into the olfactory bulb in a mouse model of acute nasal inflammation

Affiliations

Infiltration of peripheral immune cells into the olfactory bulb in a mouse model of acute nasal inflammation

Hinami Asano et al. J Neuroimmunol. .

Abstract

Chronic nasal inflammation induces robust olfactory bulb (OB) atrophy in mice. Here we examined initial events that occur in the OB after bilateral intranasal administration of lipopolysaccharide, focusing on the olfactory nerve fibers and meninges. We analyzed the time course of OB and meninges inflammation using histological and biochemical approaches. Within 12 h, we observed increased chemokine expression and transient infiltration of peripheral immune cells into the OB, resulting in the development of pro-inflammatory status in the OB. Meningeal immunity was activated. Resident microglia produced anti-inflammatory cytokines within 24 h. These could be the initial events that lead to OB atrophy.

Keywords: Meninges; Nasal inflammation; Olfactory bulb; Olfactory nerve fibers; Peripheral immune cells; Resident microglia.


Figures

Fig. 1.
Fig. 1.. Experimental protocol.
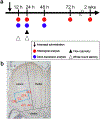
a Mice received a single bilateral intranasal administration of 10 μL of LPS or saline and were culled at 12, 24, 48, 72 h or 2 wks after intranasal administration. b The coronal section of the middle OB. For histological analysis, the middle OB was divided into lateral, medial, and ventral parts. The density of immune cells was determined in each layer, including the olfactory nerve layer (ONL), glomerular layer (GL), external plexiform layer (EPL), and granule cell layer (GCL). The EPL was further divided into the superficial EPL (sEPL), and deep EPL (dEPL). Photoimages in the Figs. 2-4 are magnified views of the rectangle in b. Scale bar: 200 μm.
Fig. 2.
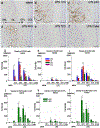
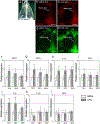
Fig. 2.. Infiltration of CCR2-immunopositive cells into the OB.
a-f Immunohistochemistry for CCR2 in the lateral side of the OB in saline (a), LPS12 h (b), LPS24 h (c), LPS48 h (d), LPS72 h (e), and LPS2 wks (f) groups. Scale bars: 100 μm. g-i The density of CCR2-immunopositive cells in the lateral (g), medial (h), and ventral (i) sides of the OB (cells/mm2). *p < 0.05, **p < 0.01, compared with the saline control. CCR2-immunopositive cells particularly infiltrated the lateral side of the OB. n = 3 for each group, j-l The density of CCR2-immunopositive cells that infiltrated the EPL of the OB in the lateral (j), medial (k) and ventral (l) side of the OB (cells/mm2). *p < 0.05, **p < 0.01, compared to the saline controls. ++ p < 0.01, compared with dEPL. CCR2-immunopositive cells infiltrated the sEPL more than they did the dEPL (j-l). n = 3 for each group.
Fig. 3.
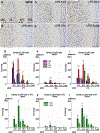
Fig. 3.. Infiltration of Ly6G-immunopositive cells into the OB.
a-f Immunohistochemistry for Ly6G in the lateral side of the OB in saline (a), LPS12 h (b), LPS24 h (c), LPS48 h (d), LPS72 h (e) and LPS2 wks (f) groups. Scale bars: 100 μm. g-i The density of Ly6G-immunopositive cells in the lateral (g), medial (h), and ventral (i) sides of the OB. *p < 0.05, **p < 0.01, compared with the saline controls. Ly6G-immunopositive cells particularly infiltrated the lateral side of the OB. n = 3 for each group with the exception of n = 4 for the LPS72 h group. j-l The density of Ly6G-immunopositive cells that infiltrated the EPL of the OB in the lateral (j), medial (k), and ventral (l) sides of the OB. *p < 0.05, **p < 0.01, compared with the saline controls. ++ p < 0.01, compared with the dEPL. Ly6G-Immunopositive cells infiltrated the sEPL more than they did the dEPL (j-l). n = 3 for each group with the exception of n = 4 for the LPS72 h group.
Fig. 4.
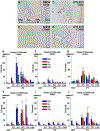
Fig. 4.. Infiltration of lymphocytes into the OB.
a, b Immunohistochemistry for CD3e in the lateral side of the OB in saline (a) and LPS24 h groups (b). c, d Immunohistochemistry for CD45R in the lateral side of the OB in saline (c) and LPS24 h (d) groups. Scale bars: 100 μm. e-g The density of CD3e-immunopositive cells in the lateral (e), medial (f), and ventral (g) sides of the OB. *p < 0.05, **p < 0.01, compared with the saline controls. CD3e-immunopositive cells particularly infiltrated the lateral side of the OB. n = 3 for each group. h-j The density of CD45R-immunopositive cells in the lateral (h), medial (i), and ventral (j) sides of the OB. *p < 0.05, **p < 0.01, compared with the saline controls. CD45R-immunopositive cells particularly infiltrated the lateral side of the OB. n = 3 for each group.
Fig. 5.
Fig. 5.. Flow cytometry.
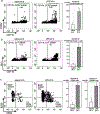
a Graphs showing the presence of CD11b + CCR2+ cells in the four OBs at 24 h post saline and 24 h post LPS. The number of CD11b + CCR2+ myeloid cells in the OB was significantly higher in the LPS24 h group than in the saline controls. *p < 0.05 compared with the saline controls, n = 3 experiments with two saline24 h mice and two LPS24 h mice per experiment. b Graphs showing the presence of CD11b + Gr-1+ cells in the four OBs at 24 h post saline and 24 h post LPS. The number of CD11b + Gr-1+ myeloid cells in the OB was significantly higher in the LPS24 h group than in the saline controls. *p < 0.05 compared with the saline controls. n = 4 experiments with two saline24 h mice and two LPS24 h mice per experiment. c Graphs showing the presence of B220+ or CD3e + cells in the four OBs at 24 h post saline and 24 h post LPS. The numbers of B220+ and CD3e + cells in the OB were both significantly higher in the LPS24 h group than in the saline controls. *p < 0.05, **p < 0.01 compared with the saline controls. n = 4 experiments with two saline24 h mice and two LPS24 h mice per experiment.
Fig. 6.
Fig. 6.. Chemokine expression in the OB.
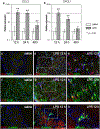
a, b Graphs showing the relative gene expression levels of CCL2 (a) and CXCL1 (b). Error bars are based on the SD of the ΔCT value. **p < 0.01, compared with the saline controls. The gene expression levels of CCL2 and CXCL1 were significantly higher at 12 h and 24 h post LPS than in the saline controls. n = 5 for each group with the exception of n = 4 for the saline12 h group. c-e, Immunofluorescence of CCL2 (red), CCR2 (green), and nuclei (DAPI, blue) in the OB of the saline control (c) and at 12 h post LPS (d and e). (e) is a magnified view of a framed box in (d). The higher magnification image confirms the co-localization. Scale bars, 50 μm in (c) and (d), and 20 μm in (e). f-h Immunofluorescence of CCL2 (red), S100β (green), and nuclei (DAPI, blue) in the OB of the saline control (f) and at 12 h post LPS (g and h). (h) is a magnified view of the framed box in (g). The higher magnification image confirms the co-localization. Scale bars, 50 μm in (f) and (g), and 20 μm in (h). i-k Immunofluorescence of CXCL1 (red), E-Selectin (green), and nuclei (DAPI, blue) in the OB of the saline control (i) and at 12 h post LPS (j) and (k). (k) is a magnified view of the framed box in (j). The higher magnification image confirms the co-localization. Scale bars, 50 μm in (i) and (j), and 20 μm in (k). Most CXCL1-immunopositive cells were also positive for E-Selectin at 12 h post LPS (k).
Fig. 7.
Fig. 7.. Activation of resident microglia in the OB.
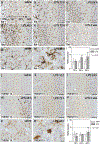
a-h Immunohistochemistry for Iba-1 in the lateral side of the OB in the saline (a, g), LPS12 h (b), LPS24 h (c), LPS48 h (d, h), LPS72 h (e), and LPS2 wks (f) groups. Scale bars: 100 μm (a-f) and 10 μm (g, h). Iba-1-immunopositive microglia were morphologically most activated at 48 h post LPS (d, h). i Graph showing the relative gene expression levels of Iba-1. Error bars are based on the SD of the ΔCT value. **p < 0.01, compared with the saline controls. The expression of Iba-1 was significantly higher at 24 h and 48 h post LPS. n = 5 for each group with the exception of n = 4 for the saline12 h group. j-q Immunohistochemistry for TMEM119 in the lateral side of the OB in the saline (j, p), LPS12 h (k), LPS24 h (l), LPS48 h (m, q), LPS72 h (n) and LPS2 wks (o) groups. Scale bars: 100 μm (j-o) and 10 μm (p, q). TMEM119-immunopositive microglia were morphologically most activated at 48 h post LPS (m, q). r Graph showing the relative gene expression levels of TMEM119. **p < 0.01, compared with the saline controls. The expression of TMEM119 was significantly higher at 48 h post LPS. n = 5 for each group with the exception of n = 4 for the saline12 h group.
Fig. 8.
Fig. 8.. Expression of cytokine in the OB.
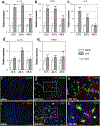
a-e Graphs showing the relative gene expression levels of IL-1β (a), TNFα (b), IL-6 (c), IL-10 (d), and TGFβ (e). Error bars are based on the SD of the ΔCT value. **p < 0.01, compared with the saline controls. The gene expression levels of IL-1β and TNFα were significantly higher at 12 h, 24 h, and 48 h post LPS than in the saline controls, respectively (a, b). The gene expression levels of IL-6 were significantly higher at 12 h and 24 h post LPS than in the saline controls, respectively (c). The gene expression levels of IL-10 were significantly higher at 24 h post LPS than in the saline control (d). The gene expression levels of TGFβ were significantly higher at 12 h, 24 h and 48 h post LPS than in the saline controls (e). n = 5 for each group with the exception of n = 4 for the saline12 h group. f-h Immunofluorescence of IL-1β (red), CCR2 (green), and nuclei (DAPI, blue) in the OB of the saline control (f) and at 12 h post LPS (g and h). IL-1β was expressed mainly by CCR2-immunopositive cells at 12 h post LPS (g and h). (h) is a magnified view of the framed box in (g). The higher magnification image confirms the co-localization. Scale bars, 50 μm in (f) and (g) and 20 μm in (h). i-k Immunofluorescence of TGFβ (red), Iba-1 (green), and nuclei (DAPI, blue) in the OB of the saline control (i) and at 48 h post LPS (j and k). TGFβ was expressed mainly by microglia in the EPL and GCL of the OB at 48 h post LPS (j and k). (k) is a magnified view of the frame box in (j). The higher magnification image confirms the co-localization. Scale bars, 50 μm in (i) and (j) and 20 μm in (k).
Fig. 9.
Fig. 9.. Activation of the meningeal immunity.
a Whole mount meninges. A rectangle indicates the area shown in b-e. b, c Immunofluorescence of CCR2 at 24 h post saline (b) and LPS (c). d, e Immunofluorescence of Ly6G at 12 h post saline (d) and 12 h LPS (e). More CCR2- and Ly6G-immunopositive cells accumulated in the olfactory sinus post LPS. Scale bars, 500 μm. f-l Graphs showing the relative gene expression levels of CCL2 (f), CXCL1 (g), IL-1β (h), TNFα (i), IL-6 (j), IL-10 (k), and TGFβ (l). Error bars are based on the SD of the ΔCT value. *p < 0.05, **p < 0.01, compared with the saline controls. The gene expression levels of CCL2, CXCL1, IL-1β, TNFα and IL-6 were significantly higher in the LPS-treated mice than in the saline controls, while those of IL-10 or TGFβ were not. n = 5 for each group with the exception of n = 4 for the saline12 h group.

References

    1. Abbott NJ, 2000. Inflammatory mediators and modulation of blood-brain barrier permeability. Cell. Mol. Neurobiol 20, 131–147. - PMC - PubMed
    1. Alves de Lima K, Rustenhoven J, Kipnis J, 2020. Meningeal immunity and its function in maintenance of the central nervous system in health and disease. Annu. Rev. Immunol 38, 597–620. - PubMed
    1. Andonegui G, Zelinski EL, Schubert CL, Knight D, Craig LA, Winston BW, Spanswick SC, Petri B, Jenne CN, Sutherland JC, Nguyen R, Jayawardena N, Kelly MM, Doig CJ, Sutherland RJ, Kubes P, 2018. Targeting inflammatory monocytes in sepsis-associated encephalopathy and long-term cognitive impairment. JCI Insight 3. - PMC - PubMed
    1. Asal N, Bayar Muluk N, Inal M, Sahan MH, Dogan A, Buturak SV, 2018. Olfactory bulbus volume and olfactory sulcus depth in psychotic patients and patients with anxiety disorder/depression. Eur. Arch. Otorhinolaryngol 275, 3017–3024. - PubMed
    1. Bennett ML, Bennett FC, Liddelow SA, Ajami B, Zamanian JL, Fernhoff NB, Mulinyawe SB, Bohlen CJ, Adil A, Tucker A, Weissman IL, Chang EF, Li G, Grant GA, Hayden Gephart MG, Barres BA, 2016. New tools for studying microglia in the mouse and human CNS. Proc. Natl. Acad. Sci. U. S. A 113, E1738–E1746. - PMC - PubMed

Publication types

Substances