. 2022 Oct;530(14):2518-2536.
doi: 10.1002/cne.25348. Epub 2022 Jun 3.

From retina to motoneurons: A substrate for visuomotor transformation in salamanders

Affiliations

From retina to motoneurons: A substrate for visuomotor transformation in salamanders

Aurélie Flaive et al. J Comp Neurol. 2022 Oct.

Abstract

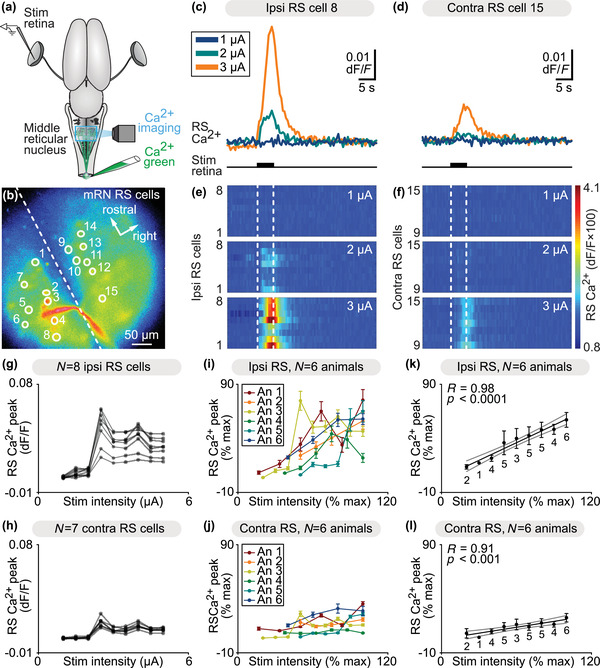
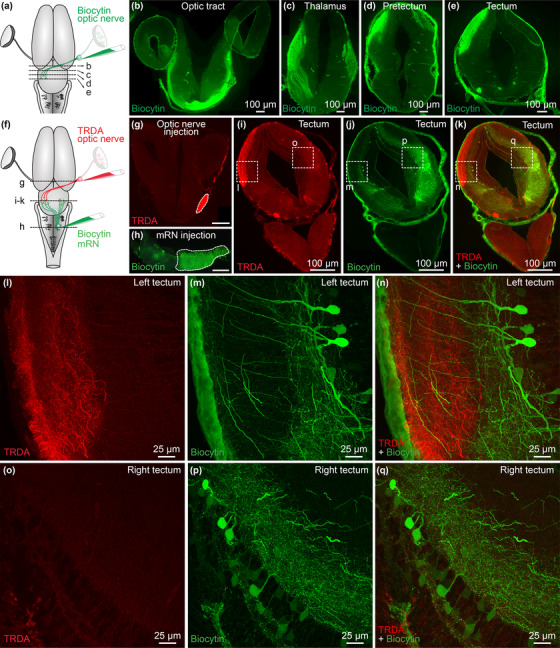
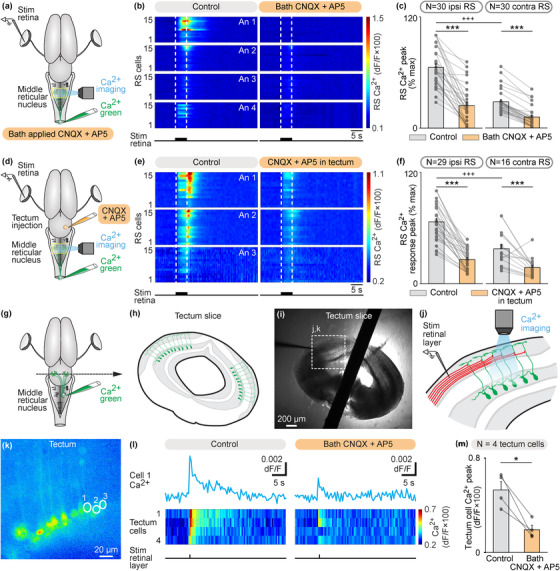
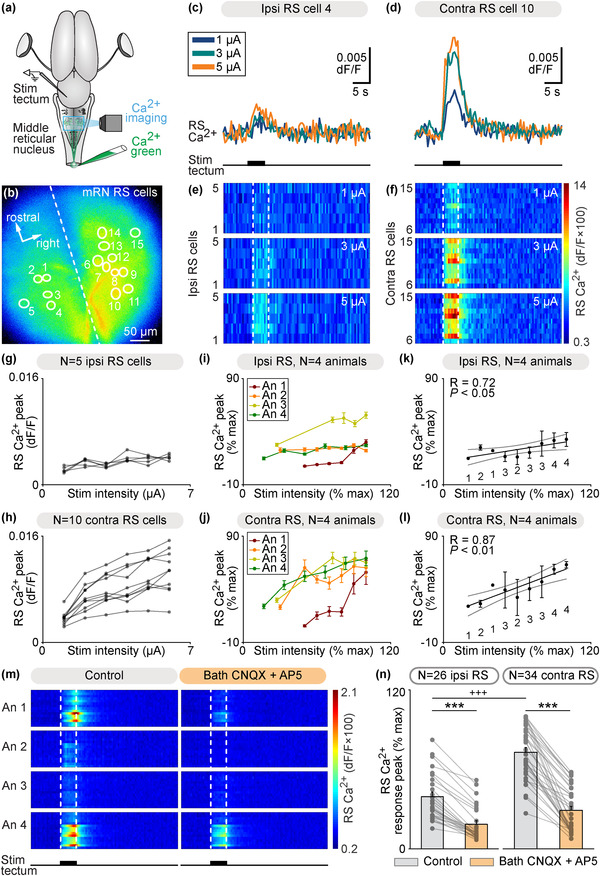
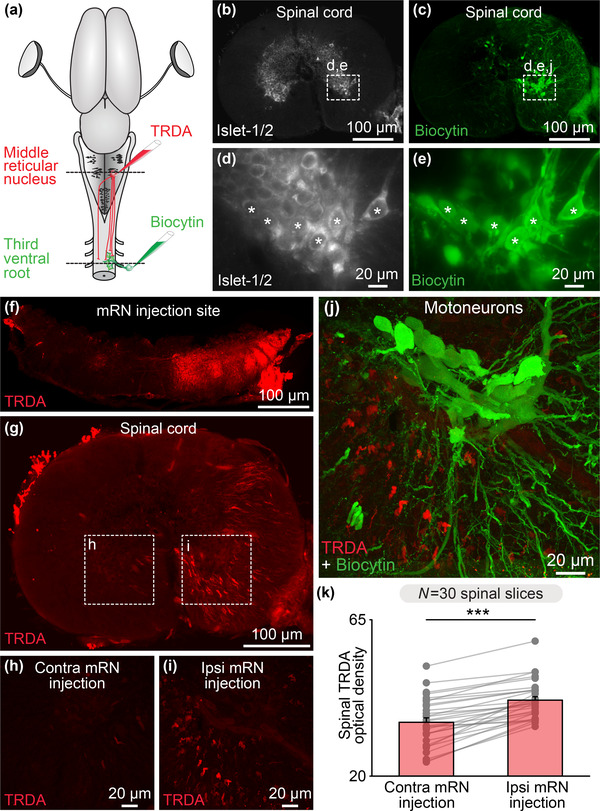
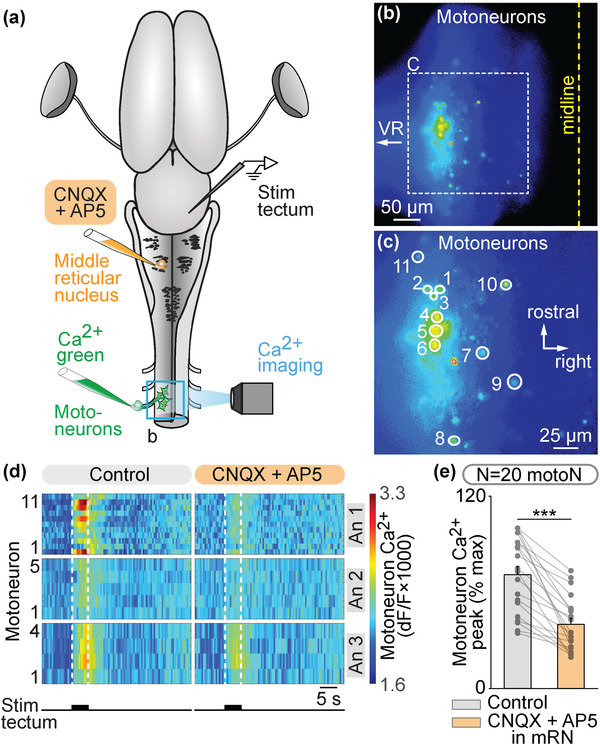
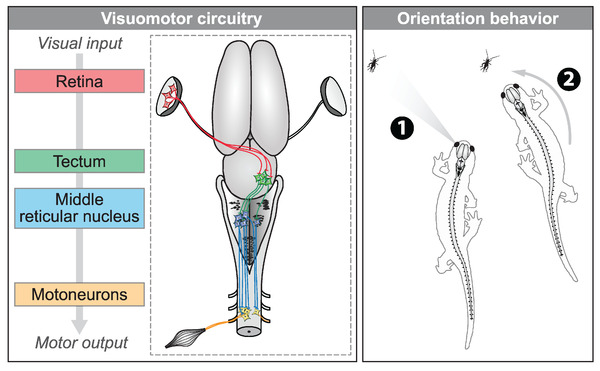
The transformation of visual input into motor output is essential to approach a target or avoid a predator. In salamanders, visually guided orientation behaviors have been extensively studied during prey capture. However, the neural circuitry involved is not resolved. Using salamander brain preparations, calcium imaging and tracing experiments, we describe a neural substrate through which retinal input is transformed into spinal motor output. We found that retina stimulation evoked responses in reticulospinal neurons of the middle reticular nucleus, known to control steering movements in salamanders. Microinjection of glutamatergic antagonists in the optic tectum (superior colliculus in mammals) decreased the reticulospinal responses. Using tracing, we found that retina projected to the dorsal layers of the contralateral tectum, where the dendrites of neurons projecting to the middle reticular nucleus were located. In slices, stimulation of the tectal dorsal layers evoked glutamatergic responses in deep tectal neurons retrogradely labeled from the middle reticular nucleus. We then examined how tectum activation translated into spinal motor output. Tectum stimulation evoked motoneuronal responses, which were decreased by microinjections of glutamatergic antagonists in the contralateral middle reticular nucleus. Reticulospinal fibers anterogradely labeled from tracer injection in the middle reticular nucleus were preferentially distributed in proximity with the dendrites of ipsilateral motoneurons. Our work establishes a neural substrate linking visual and motor centers in salamanders. This retino-tecto-reticulo-spinal circuitry is well positioned to control orienting behaviors. Our study bridges the gap between the behavioral studies and the neural mechanisms involved in the transformation of visual input into motor output in salamanders.

Keywords: motoneurons; reticulospinal neurons; retina; salamander; spinal cord; tectum; visuomotor.


Conflict of interest statement

The authors declare no potential conflict of interest.

Figures

FIGURE 1
FIGURE 1
Retina stimulation evokes stronger reticulospinal (RS) responses on the ipsilateral side. (a) Schematic dorsal view of a salamander brain. A calcium (Ca2+) sensor (Ca2+ green) was applied onto the first spinal segments to retrogradely label RS neurons on both sides. A stimulation electrode was placed in the retina on one side and optical recordings of the RS neurons of the middle reticular nucleus (mRN) were obtained. (b) Ca2+ fluorescence at rest of mRN RS neurons. (c and d) Representative Ca2+ response of individual RS cells on the ipsilateral side (c) and contralateral side (d) of the mRN in response to retina stimulation on left side (1–3 μA, 5 s train, 10 Hz, 2 ms pulses). (e–f) Color plots showing the Ca2+ responses of mRN RS cells for increasing retina stimulation intensities. Each line illustrates the response of one cell, with cells 1–8 located ipsilateral to retina stimulation (e) and 9–15 located contralateral to retina stimulation (f). Onset and offset of stimulation are indicated with vertical white dotted lines. Warm colors (red) indicate stronger Ca2+ responses. (g and h) Relationships between Ca2+ response peak and retina stimulation intensity in RS cells illustrated in b–f. Each trace represents the responses of a single RS cell ipsilateral to stimulation (g) or contralateral to stimulation (h). (i and j) Relationships in six preparations between Ca2+ response peak (mean ± SEM) and retina stimulation intensity for RS cells located ipsilateral (n = 49 RS cells, 4–11 cells per preparation, (i)) and contralateral (n = 41 RS cells, 4–11 cells per preparation, (j)) to the stimulated retina (0.6–30 μA, 5 s train, 10 Hz, 2 ms pulses). In each preparation, response peaks were expressed in % of the maximal peak recorded, and stimulation intensity in % of the maximal intensity used. (k and l) Relationship between Ca2+ response peak (mean ± SEM) and stimulation intensity in the same 6 animals as in (i and j). Data were binned with a bin size of 10%. The data followed a linear polynomial function both for ipsilateral RS cells (solid black line, p < .001, R = 0.98, (k)) and contralateral RS cells (solid black line, p < .001, R = 0.91, (l)). Note that RS cells contralateral to retina stimulation generated lower maximal responses. Gray lines illustrate the confidence intervals
FIGURE 2
FIGURE 2
Retinofugal fibers innervate the dendrites of tectal neurons projecting down to the middle reticular nucleus (mRN). (a) Scheme showing a dorsal view of the salamander brain. A tracer (biocytin, green) was injected in the right optic nerve. After 4h of tracing, the brain was fixed and transverse sections were obtained. (b–e) Transverse sections showing that tracer injection in the optic nerve labeled fibers in the optic tract (b), thalamus (c), pretectum (d) and tectum (e). (f–h) Scheme showing a dorsal view of the salamander brain (f) and pictures of the injection sites (g–h). A first tracer was injected in the right optic nerve (Texas Red Dextran Amine, TRDA, red, (g)) and a second tracer (biocytin, green, (h)) was injected on the right side of the mRN, where many reticulospinal (RS) neurons are located. Scale bar in (g and h): 100 μm. (i–k) Transverse sections showing the anterogradely labeled retinofugal projections (TRDA, red) and the retrogradely labeled tectal neurons (biocytin, green). (l–n) Confocal magnification of the squares in i–k, showing the presence of retinofugal projections (TRDA, red) in the dorsal layers of the left tectum (i.e., contralateral to the injected optic nerve). In green, neurons in the left tectum retrogradely labeled by biocytin injection in the right mRN. (o–q) Magnification of the squares in i–k, showing the rarity of retinofugal projections in the dorsal layers of the right tectum, that is, ipsilateral to the injected optic nerve. In green, many neurons of the right tectum were retrogradely labeled by biocytin injection in the right mRN
FIGURE 3
FIGURE 3
Retina stimulation evokes reticulospinal (RS) responses in the middle reticular nucleus (mRN) via a glutamatergic relay in the contralateral tectum. (a) Schematic dorsal view of a salamander brain. A calcium (Ca2+) sensor (Ca2+ green) was applied onto the first spinal segments to retrogradely label RS neurons. A stimulation electrode was placed in the retina on one side and optical recordings of RS neurons of the mRN were obtained. (b) Color plots showing the Ca2+ responses of mRN RS cells ipsilateral (N = 30 RS cells pooled from four animals, 4–9 cells per animal, An) or contralateral (N = 30 RS cells pooled from four animals, 6–11 cells per animal) to retina stimulation (5 s train, 10 Hz, 2 ms pulses, 4–70 μA) before and 8–24 min after bath application of CNQX (0.9 μM) and AP5 (3.5 μM). Each line illustrates the average response of one cell (five to eight trials per cell per drug condition). Onset and offset of stimulation are indicated with vertical white dotted lines. Warm colors (red) indicate stronger Ca2+ responses. (c) Bar charts showing the Ca2+ responses before and after bath application of the glutamatergic antagonists on RS cells located ipsilateral (ipsi) and contralateral (contra) to retina stimulation. (d–f) Similar representation as in (a–c), showing the responses of RS cells ipsilateral (N = 29 RS cells pooled from three animals, 7–11 cells per animal) or contralateral (N = 16 RS cells pooled from three animals, 4–8 cells per animal) to retina stimulation (5 s train, 10 Hz, 2 ms pulses, 3–10 μA) before and 4–20 min after local injection of CNQX (0.07 pmol) and AP5 (0.03 pmol) in the tectum contralateral to the stimulated retina using a picospritzer (CNQX 1 mM, AP5 0.5 mM). Each line illustrates the average response of one cell (five to seven trials per cell per drug condition). (g and h) To record tectal neurons projecting to the mRN, Ca2+ green was injected in the mRN and transverse slices of the tectum were obtained. (i and j) A stimulation electrode was placed laterally (∼100 μm) from the apical dendrites of the labeled tectal neurons, and the Ca2+ responses of tectal neurons were recorded. (k) Ca2+ fluorescence at rest of tectal neurons. (l) Ca2+ response in tectal cells in response to stimulation of the retinal input layer before (single 2 ms pulses, 60–70 μA, five to seven trials per cell per drug condition) and 6–38 min after bath application of CNQX (0.9 μM) and AP5 (3.5 μM). On the color plot, each line illustrates the average response of one cell (five to seven trials per cell per drug condition). (m) Bar charts showing that Ca2+ responses of tectal neurons decreased in presence of glutamatergic antagonists (n = 4 tectal cells pooled from two slices from two animals). *, p < .05, ***, p < .001, paired t‐test; +++ p < .001, t‐test
FIGURE 4
FIGURE 4
Tectum stimulation evokes stronger reticulospinal (RS) responses on the contralateral side. (a) Schematic dorsal view of a salamander brain. A calcium (Ca2+) sensor (Ca2+ green) was applied onto the first spinal segments to retrogradely label RS neurons. A stimulation electrode was placed in the tectum on one side and optical recordings of the RS neurons of the middle reticular nucleus (mRN) were obtained. (b) Ca2+ fluorescence at rest of mRN RS neurons. (c and d) Ca2+ response in individual RS cells on the ipsilateral side (c) and contralateral side (d) of the mRN in response to tectum stimulation on left side (1–5 μA, 5 s train, 10 Hz, 2 ms pulses). (e and f) Color plots showing the Ca2+ responses of mRN RS cells for increasing tectum stimulation intensities. Each line illustrates the response of one RS cell, with cells 1–5 located ipsilateral to tectum stimulation (e) and cells 6–15 located contralateral to stimulation (f). Onset and offset of stimulation are indicated with vertical white dotted lines. Warm colors (red) indicate stronger Ca2+ responses. (g and h) Relationships between Ca2+ response peak and tectum stimulation intensity in RS cells illustrated in b‐f. Each trace represents the responses of a single RS cell ipsilateral to tectum stimulation (g) or contralateral to stimulation (h). (i and j) Relationships in four preparations between Ca2+ response peak (mean ± SEM) and tectum stimulation intensity for RS cells located ipsilateral (n = 28 RS cells, 5–8 cells per preparation, (i)) and contralateral (n = 32 RS cells, 7–10 cells per preparation, (j)) to the stimulated tectum (1–11 μA, 5 s train, 10 Hz, 2 ms pulses). In each preparation, response peaks were expressed in % of the maximal peak recorded, and stimulation intensity in % of the maximal intensity used. (k and l) Relationship between Ca2+ response peak (mean ± SEM) and tectum stimulation intensity in the same 4 animals as in (i and j) Data were binned with a bin size of 10%. The data followed a linear polynomial function both for ipsilateral RS cells (solid black line, p < .05, R = 0.72, (k)) and contralateral RS cells (solid black line, p < .01, R = 0.87, (l)). Note that RS cells contralateral to tectum stimulation generated lower maximal responses. Gray lines illustrate the confidence intervals. (m) Color plots showing the Ca2+ responses of mRN RS cells ipsilateral (N = 26 RS cells pooled from four animals, 5–8 cells per animal, An) or contralateral (N = 34 RS cells pooled from four animals, 7–10 cells per animal) to tectum stimulation (5 s train, 10 Hz, 2 ms pulses, 1–11 μA) before and 4–20 min after bath application of CNQX (0.9 μM) and AP5 (3.5 μM). Each line illustrates the average response of one cell (five to seven trials per cell per drug condition). Onset and offset of stimulation are indicated with vertical white dotted lines. Warm colors (red) indicate stronger Ca2+ responses. (n) Bar charts showing the Ca2+ responses before and after bath application of the glutamatergic antagonists on RS cells located ipsilateral (ipsi) and contralateral (contra) to tectum stimulation. ***, p < .001 (paired t‐test), +++p < .001 (t‐test)
FIGURE 5
FIGURE 5
Reticulospinal (RS) neurons of the middle reticular nucleus (mRN) send descending projections to spinal motoneurons on the same side. (a) Schematic dorsal view of a salamander brain. To anterogradely label the descending RS projections of the mRN, a first tracer (Texas Red Dextran Amine, TRDA, red) was injected in the right side of the mRN. To retrogradely label the motoneurons, a second tracer (biocytin, green) was injected in the right ventral root of the third cervical spinal segment. (b–e) Transverse slices of the spinal cord showing that motoneurons retrogradely labeled by ventral root injection of biocytin (green, (c and e)) were immuno‐positive for the motoneuronal marker Islet 1–2 (white, (b and d)). (f) Transverse slice at the level of the mRN showing the injection site of TRDA on the right side. (g–i) Transverse slices showing that TRDA injection (red) on the right mRN in (f) anterogradely labeled more fibers in the spinal cord ipsilaterally (i) than contralaterally (h). (j) Confocal images showing that descending RS fibers (red) densely innervated the dendrites of motoneurons (green). (k) Bar chart illustrating the optical density of TRDA immunofluorescence in the ventral spinal cord (spinal segment 3) ipsilateral versus contralateral to mRN injection measured in 10 spinal cord slices per animal from 3 animals. ***p < .001, t‐test
FIGURE 6
FIGURE 6
Tectum stimulation evokes spinal motoneuronal responses via a glutamatergic relay in the contralateral middle reticular nucleus (mRN). (a) Schematic dorsal view of a salamander brain. A calcium (Ca2+) sensor (Ca2+ green) was applied onto the left ventral root of the third cervical spinal segment to retrogradely label motoneurons (motoN). A stimulation electrode was placed in the right tectum. The dorsal spinal cord was surgically removed on the left side to perform optical recordings of the motoneurons. (b and c) Ca2+ fluorescence at rest of motoneurons. The spinal cord midline and the location of the ventral root (VR) are indicated. (c) is a magnification of the square in (b). (d) Color plots showing the Ca2+ responses of motoneurons (N = 20 motoN pooled from three animals, 4–15 cells per animal, An) to tectum stimulation (5 s train, 10 Hz, 2 ms pulses, 25–40 μA) before and 1–14 min after local injection of CNQX (1.9–5.7 pmol) and AP5 (1.0–2.9 pmol) in the mRN ipsilateral to the recorded motoneurons (and contralateral to the stimulated tectum) using a picospritzer (CNQX 1 mM, AP5 0.5 mM). Each line illustrates the average response of one cell (seven trials per cell per drug condition). Onset and offset of stimulation are indicated with vertical white dotted lines. Warm colors (red) indicate stronger Ca2+ responses. (e) Bar charts showing the motoneuronal Ca2+ responses before and after bath application of the glutamatergic antagonists. ***, p < .001 (paired t‐test)
FIGURE 7
FIGURE 7
The proposed visuomotor circuitry in salamanders. Left, schematic dorsal view of a salamander brain showing the transformation of visual input into motor output. When retinal ganglion cells are activated in the left retina, tectal cells of the contralateral tectum are activated via a glutamatergic synapse. These tectal neurons send a stronger input to the reticulospinal (RS) neurons on the left side in the mRN via a glutamatergic synapse. From there, RS neurons send a mainly ipsilateral descending excitatory input to motoneurons, which increase muscular contraction on the side of the detected visual input. Here, the recorded motoneurons were retrogradely labeled from the third ventral root. The descending RS input is in a good position to also target other motoneurons in spinal segment three, such as those innervating the neck muscles (Nishikawa et al. , also see discussion). Altogether, the spinal motoneurons activated by the visual stimulus would cause orientation movements toward the visual stimulus. Right, the circuitry could account for prey tracking during ongoing locomotion. When a prey appears in the left visual field (e.g., cricket), the proposed circuitry would allow the animal to orient its body movements toward the prey and track it, to eventually snap it

Similar articles

Cited by

References

    1. Bachmann, L. C. , Matis, A. , Lindau, N. T. , Felder, P. , Gullo, M. , & Schwab, M. E. (2013). Deep brain stimulation of the midbrain locomotor region improves paretic hindlimb function after spinal cord injury in rats. Science Translational Medicine, 5, 208ra146. - PubMed
    1. Basso, M. A. , Bickford, M. E. , & Cang, J. (2021). Unraveling circuits of visual perception and cognition through the superior colliculus. Neuron, 109, 918–937. - PMC - PubMed
    1. Beauséjour, P.‐A. , Auclair, F. , Daghfous, G. , Ngovandan, C. , Veilleux, D. , Zielinski, B. , & Dubuc, R. (2020). Dopaminergic modulation of olfactory‐evoked motor output in sea lampreys (Petromyzon marinus L.). Journal of Comparative Neurology, 528, 114–134. - PMC - PubMed
    1. Beauséjour, P.‐A. , & Zielinski, B. , Dubuc, R. (2021). Olfactory‐induced locomotion in lampreys. Cell and Tissue Research. - PubMed
    1. Bianco, I. H. , & Engert, F. (2015). Visuomotor transformations underlying hunting behavior in zebrafish. Current Biology, 25, 831–846. - PMC - PubMed

Publication types