Review
. 2022 Dec;17(12):2632-2636.
doi: 10.4103/1673-5374.339477.

Artificial intelligence for assessment of Stargardt macular atrophy

Affiliations
Review

Artificial intelligence for assessment of Stargardt macular atrophy

Ziyuan Wang et al. Neural Regen Res. 2022 Dec.

Abstract

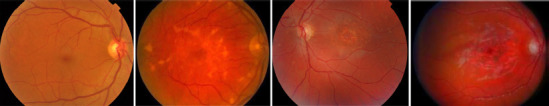
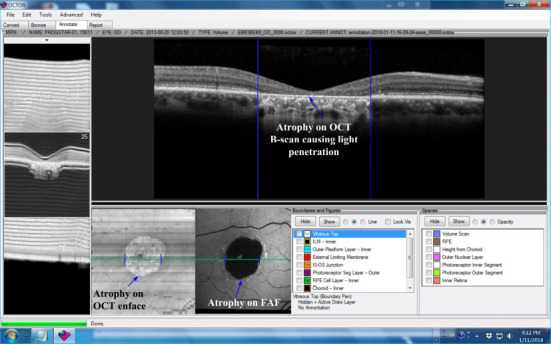
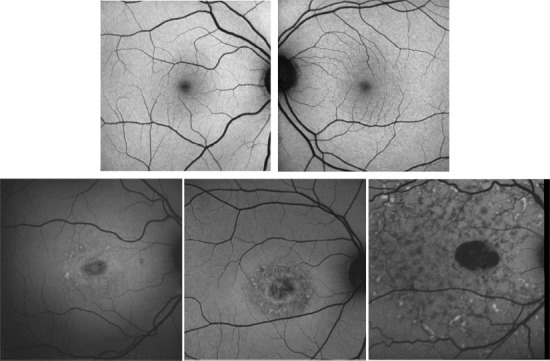
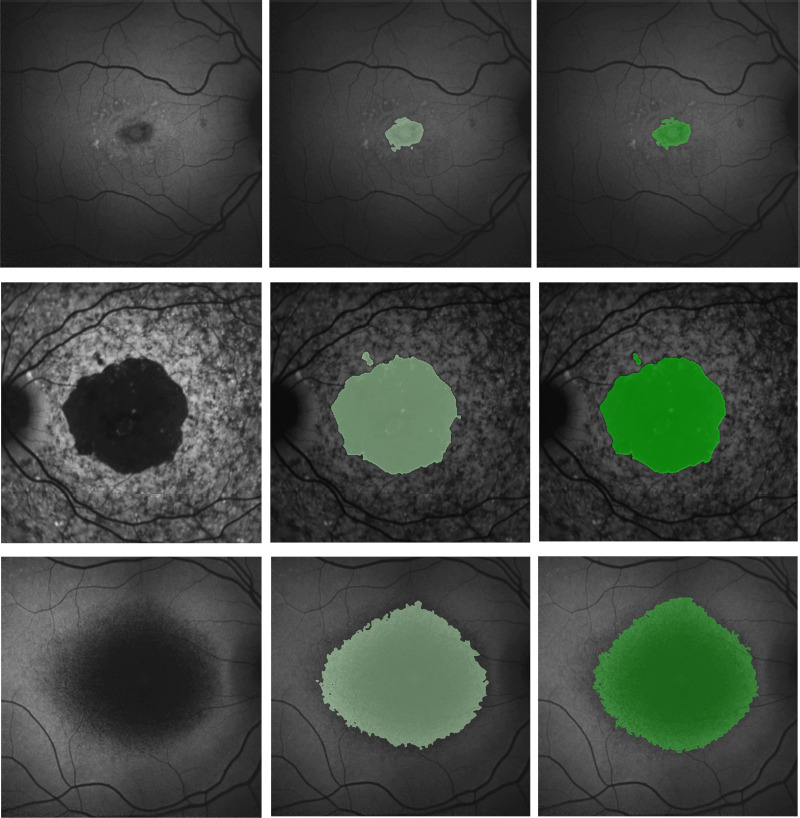
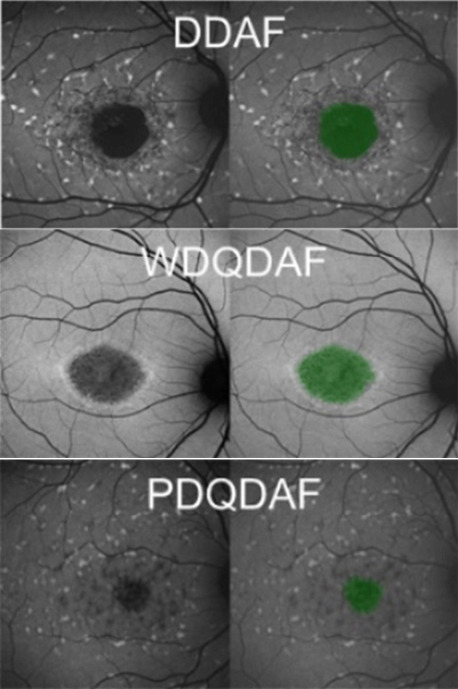
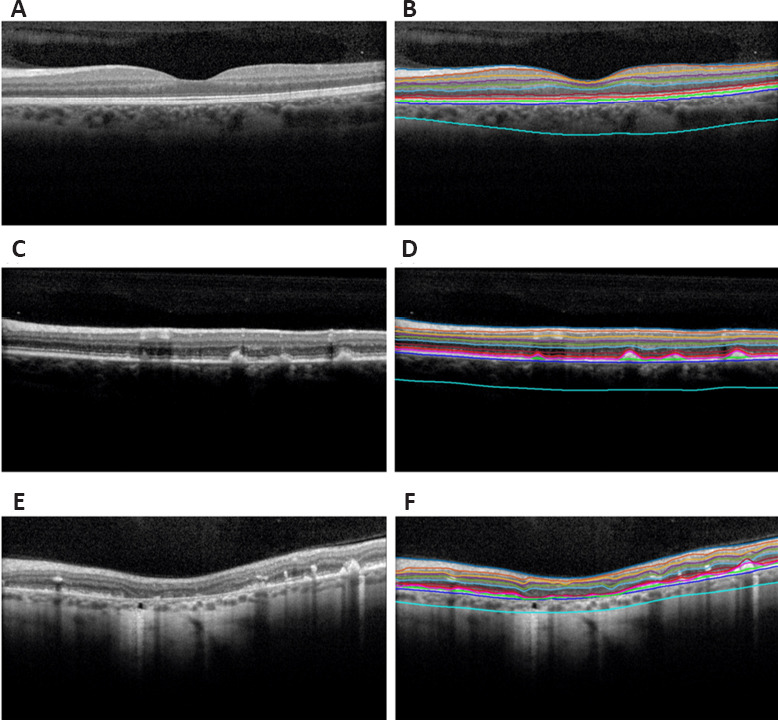
Stargardt disease (also known as juvenile macular degeneration or Stargardt macular degeneration) is an inherited disorder of the retina, which can occur in the eyes of children and young adults. It is the most prevalent form of juvenile-onset macular dystrophy, causing progressive (and often severe) vision loss. Images with Stargardt disease are characterized by the appearance of flecks in early and intermediate stages, and the appearance of atrophy, due to cells wasting away and dying, in the advanced stage. The primary measure of late-stage Stargardt disease is the appearance of atrophy. Fundus autofluorescence is a widely available two-dimensional imaging technique, which can aid in the diagnosis of the disease. Spectral-domain optical coherence tomography, in contrast, provides three-dimensional visualization of the retinal microstructure, thereby allowing the status of the individual retinal layers. Stargardt disease may cause various levels of disruption to the photoreceptor segments as well as other outer retinal layers. In recent years, there has been an exponential growth in the number of applications utilizing artificial intelligence for help with processing such diseases, heavily fueled by the amazing successes in image recognition using deep learning. This review regarding artificial intelligence deep learning approaches for the Stargardt atrophy screening and segmentation on fundus autofluorescence images is first provided, followed by a review of the automated retinal layer segmentation with atrophic-appearing lesions and fleck features using artificial intelligence deep learning construct. The paper concludes with a perspective about using artificial intelligence to potentially find early risk factors or biomarkers that can aid in the prediction of Stargardt disease progression.

Keywords: Stargardt atrophy; Stargardt disease; Stargardt flecks; artificial intelligence; assessment; deep learning; fundus autofluorescence; screening; segmentation; spectral-domain optical coherence tomography.


Conflict of interest statement

Conflicts of interest: The authors declare no conflicts of interest.

Figures

Figure 1
Figure 1
Illustration of 4-stage Stargardt disease classification on color fundus photography images. Left to right columns: stage 1 to 4. Unpublished data.
Figure 2
Figure 2
Stargardt atrophy on FAF and OCT images, captured from the grading tool of our lab. The blue arrows highlight the atrophy on different modality images from a right eye of a patient with Stargardt disease. FAF: Fundus autofluorescence; OCT: optical coherence tomography. Unpublished data.
Figure 3
Figure 3
Example illustration of the screening system results on fundus autofluorescence images with 100% accuracy. Top row shows example images from normal eyes and the bottom row shows example images from eyes with Stargardt atrophy. Note that the Stargardt image in the bottom left has similar intensity distribution as normal images in the top row but still can be differentiated in the accuracy of 100%. Reprinted with permission from Wang et al. (2019).
Figure 4
Figure 4
Example illustration of the results of the Stargardt atrophic lesion segmentation on fundus autofluorescence images. Left column: Fundus autofluorescence images. Middle column: U-Net segmentation results (light green) overlapping on fundus autofluorescence. Right column: manual delineation results (darker green) overlapping on fundus autofluorescence. Reprinted with permission from Wang et al. (2019).
Figure 5
Figure 5
Example illustration of the Stargardt atrophic lesion segmentation on fundus autofluorescence images with three different morphologies. From top to bottom: definite decreased AF (DDAF), well-defined questionable decreased AF (WDQDAF), and poorly defined questionable decreased AF (PDQDAF). Unpublished data.
Figure 6
Figure 6
Illustration of graph search segmentation of optical coherence tomography retinal surfaces associated with Stargardt atrophic-appearing lesion, as well as retinal deposits corresponding to the characteristic flecks of Stargardt disease. From top to bottom: reference surface in vitreous layer, internal limiting membrane, outer plexiform and outer nuclear junction, external limiting membrane, inner-outer photoreceptor segmentation junction, inner retinal pigment epithelium, outer retinal pigment epithelium/Bruch’s membrane, choroidal-scleral junction. Unpublished data.
Figure 7
Figure 7
Segmentation of normal eyes and eyes diagnosed with Stargardt disease overlaid on spectral-domain optical coherence tomography B-scans. (A) and (B) are the original B-scan and segmentation of a normal eye. (C) and (D) are the original B-scan and segmentation of an eye diagnosed with Stargardt disease showcasing mild degeneration and deposits corresponding to the characteristic flecks of Stargardt disease. (E) and (F) are the original B-scan and segmentation of an eye diagnosed with Stargardt disease showcasing severe degeneration and an atrophic-appearing lesion. The layers in order from top to bottom are the internal limiting membrane, nerve fiber-ganglion cell junction, ganglion cell-inner plexiform, inner plexiform-inner nuclear junction, inner nuclear-outer plexiform junction, outer plexiform-outer nuclear junction, external limiting membrane, inner-outer photoreceptor segmentation junction, Stargardt features, inner retinal pigment epithelium, outer retinal pigment epithelium, and choroidal-scleral junction. Reprinted with permission from Mishra et al. (2021).

References

    1. Binley K, Widdowson P, Loader J, Kelleher M, Iqball S, Ferrige G, de Belin J, Carlucci M, Angell-Manning D, Hurst F, Ellis S, Miskin J, Fernandes A, Wong P, Allikmets R, Bergstrom C, Aaberg T, Yan J, Kong J, Gouras P, et al. Transduction of photoreceptors with equine infectious anemia virus lentiviral vectors:safety and biodistribution of StarGen for Stargardt disease. Invest Ophthalmol Vis Sci. 2013;54:4061–4071. - PMC - PubMed
    1. Cabrera Fernandez D, Salinas HM, Puliafito CA. Automated detection of retinal layer structures on optical coherence tomography images. Opt Express. 2005;13:10200–10216. - PubMed
    1. Charng J, Xiao D, Mehdizadeh M, Attia MS, Arunachalam S, Lamey TM, Thompson JA, McLaren TL, De Roach JN, Mackey DA, Frost S, Chen FK. Deep learning segmentation of hyperautofluorescent fleck lesions in Stargardt disease. Sci Rep. 2020;10:16491. - PMC - PubMed
    1. Chiu SJ, Li XT, Nicholas P, Toth CA, Izatt JA, Farsiu S. Automatic segmentation of seven retinal layers in SDOCT images congruent with expert manual segmentation. Opt Express. 2010;18:19413–19428. - PMC - PubMed
    1. Cicinelli MV, Battista M, Starace V, Battaglia Parodi M, Bandello F. Monitoring and management of the patient with Stargardt disease. Clin Optom (Auckl) 2019;11:151–165. - PMC - PubMed