. 2022 Jun;54(6):739-752.
doi: 10.1038/s12276-022-00781-5. Epub 2022 Jun 3.

Hyaluronan synthase 2, a target of miR-200c, promotes carbon tetrachloride-induced acute and chronic liver inflammation via regulation of CCL3 and CCL4

Affiliations

Hyaluronan synthase 2, a target of miR-200c, promotes carbon tetrachloride-induced acute and chronic liver inflammation via regulation of CCL3 and CCL4

Sun Myoung Kim et al. Exp Mol Med. 2022 Jun.

Abstract

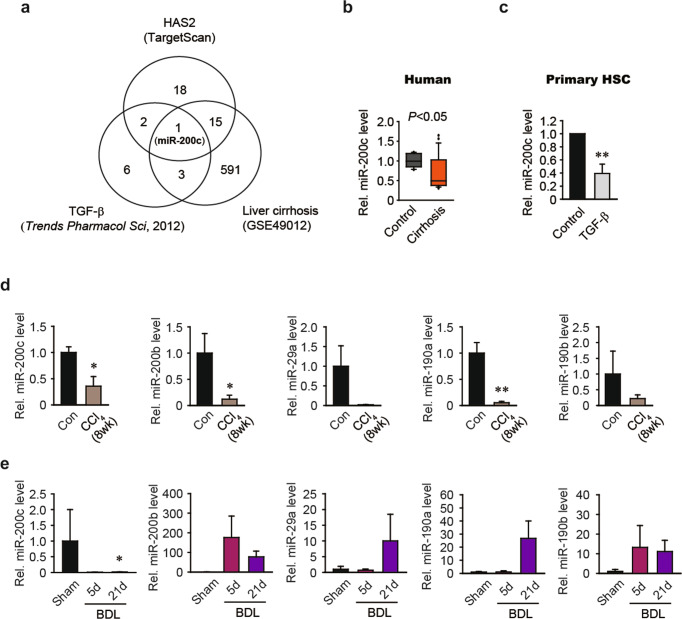
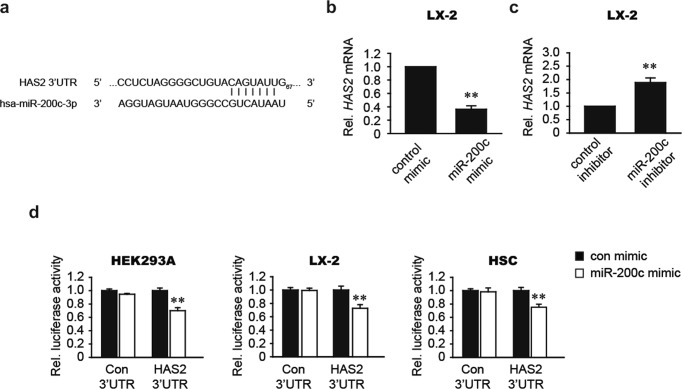
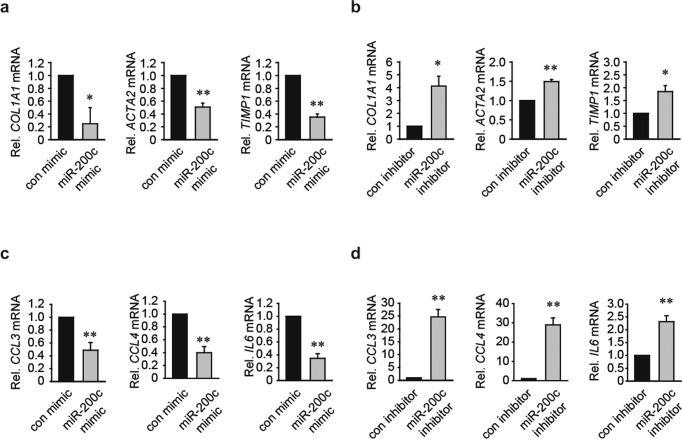
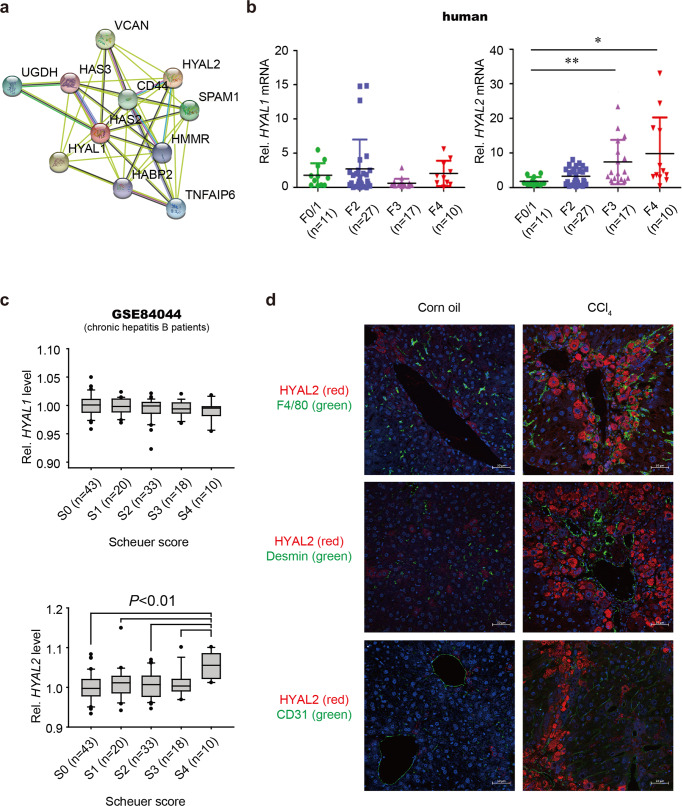
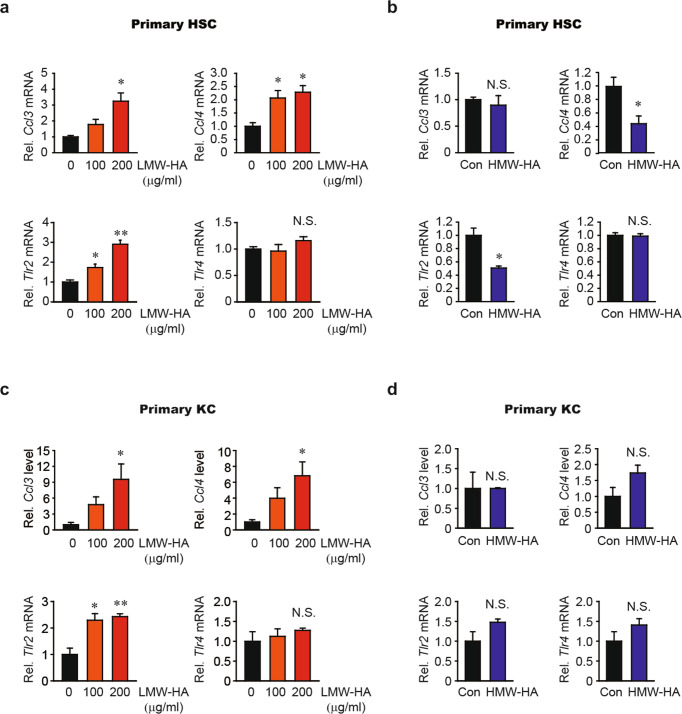
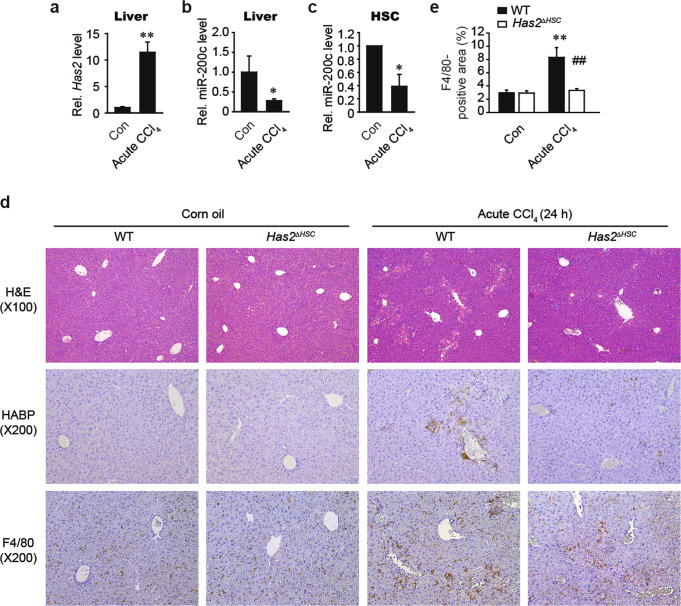
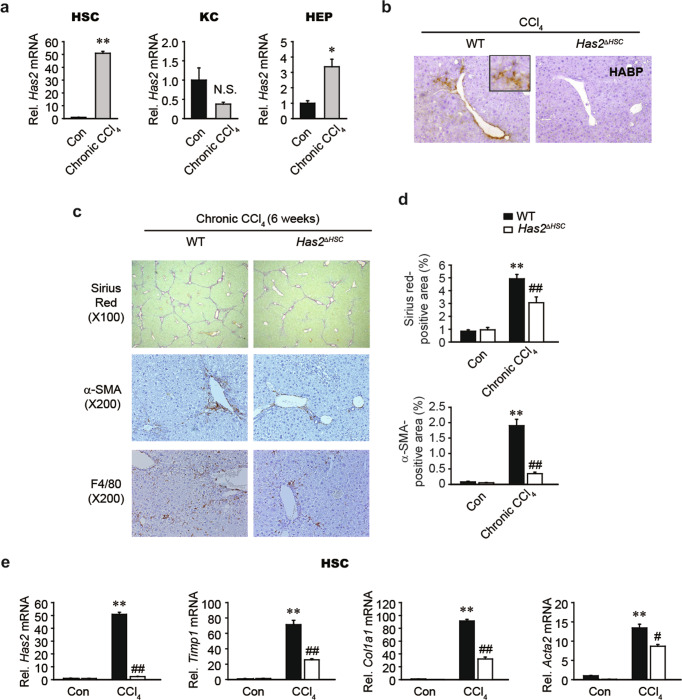
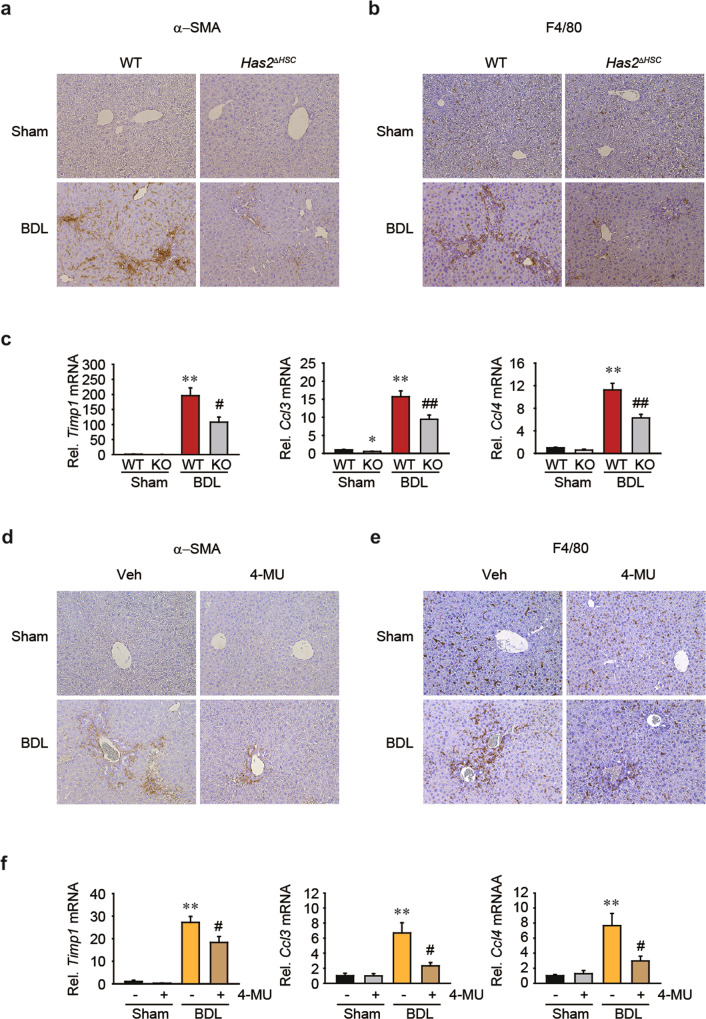
Liver fibrosis occurs during wound healing after repeated liver injury and is characterized by extensive extracellular matrix deposition. We previously identified hyaluronan synthase 2 (HAS2) as a driver of liver fibrosis and hepatic stellate cell (HSC) activation. Developing strategies to suppress HSC activation is key to alleviating liver fibrosis, and HAS2 is an attractive candidate for intervention. To gain insight into the molecular function of HAS2, we investigated its posttranscriptional regulation. We found that miR-200c directly targets the 3' untranslated regions of HAS2. Moreover, miR-200c and HAS2 were inversely expressed in fibrotic human and mouse livers. After establishing the direct interaction between miR-200c and HAS2, we investigated the functional outcome of regulating HAS2 expression in three murine models: CCl4-induced acute liver injury, CCl4-induced chronic liver fibrosis, and bile duct ligation-induced liver fibrosis. Hepatic Has2 expression was induced by acute and chronic CCl4 treatment. In contrast, miR-200c expression was decreased after CCl4 treatment. HSC-specific Has2 deletion reduced the expression of inflammatory markers and infiltration of macrophages in the models. Importantly, hyaluronidase-2 (HYAL2) but not HYAL1 was overexpressed in fibrotic human and murine livers. HYAL2 is an enzyme that can cleave the extracellular matrix component hyaluronan. We found that low-molecular-weight hyaluronan stimulated the expression of inflammatory genes. Treatment with the HA synthesis inhibitor 4-methylumbelliferone alleviated bile duct ligation-induced expression of these inflammatory markers. Collectively, our results suggest that HAS2 is negatively regulated by miR-200c and contributes to the development of acute liver injury and chronic liver inflammation via hyaluronan-mediated immune signaling.


Conflict of interest statement

The authors declare no competing interests.

Figures

Fig. 1
Fig. 1. The expression of miR-200c is reduced in liver fibrosis.
a Venn diagram showing the overlapping miRNAs. The number of miRNAs computationally predicted by TargetScan to target HAS2 is shown in the upper circle. The number of miRNAs downregulated by TGF-β administration is shown in the lower left circle. The number of miRNAs downregulated in liver tissues from individuals with cirrhosis (GSE49012) is shown in the lower right circle. MiR-200c is depicted in the three overlapping circles. b MiR-200c transcript levels in liver tissues from patients. We reanalyzed GEO dataset GSE49012 (Control, n = 12; Cirrhosis, n = 22). c Quantitative reverse transcription-polymerase chain reaction (qRT–PCR) analysis of miR-200c expression after TGF-β treatment in mouse primary HSCs. HSCs were treated with TGF-β for 12 h. **P < 0.01 versus the control group (n = 4). d Hepatic levels of miR-200c, miR-200b, miR-29a, miR-190a, and miR-190b. Mice were injected intraperitoneally with corn oil (Con) or carbon tetrachloride (CCl4) twice a week for 8 weeks. *P < 0.05, **P < 0.01 versus the Con group (n = 4–5 mice/group). e Quantification of hepatic miRNA levels. Mice underwent bile duct ligation (BDL) and were assessed after 5 or 21 days. *P < 0.05 versus the sham group (Sham, n = 2; BDL 5d, n = 4; BDL 21d, n = 8). The values shown are the means ± SEMs. Significance was assessed by two-tailed Student’s t-test (b–d) and one-way ANOVA with Tukey’s post-hoc test (e).
Fig. 2
Fig. 2. miR-200c directly targets HAS2.
a Prediction of miR-200c binding to the 3’UTR of human HAS2 mRNA. b The effect of miR-200c mimic treatment on the HAS2 mRNA level. c The effect of miR-200c inhibitor treatment on the HAS2 mRNA level. d The effect of miR-200c mimic treatment on pEZX-HAS2-3’UTR luciferase activity. Luciferase activity was assessed in HEK293A cells, LX-2 cells, and mouse HSCs transfected with the negative control mimic or miR-200c mimic in combination with pEZX-control or pEZX-HAS2-3’UTR. **P < 0.01 indicates a significant difference between the control mimic (or inhibitor) and miR-200c mimic (or inhibitor) (n = 3–6 per group). The data are presented as the mean ± SEM values. Significance was assessed by two-tailed Student’s t-test (b, c) and one-way ANOVA with Tukey’s post-hoc test (d).
Fig. 3
Fig. 3. miR-200c decreases hepatic fibrogenic and inflammatory gene expression.
a The effect of miR-200c mimic treatment on fibrogenic gene expression. LX-2 cells were transfected with the control mimic or miR-200c mimic. b qRT–PCR analysis of COL1A1, ACTA2, and TIMP1 mRNA expression. LX-2 cells were transfected with the control inhibitor or miR-200c inhibitor. c Proinflammatory gene expression in LX-2 cells after miR-200c mimic transfection. d The effect of miR-200c inhibitor transfection on CCL3, CCL4, and IL6 mRNA expression. *P < 0.05 and **P < 0.01 indicate a significant difference between the control (or inhibitor) and miR-200c mimic (or inhibitor) (n = 3–4 per group). The data are presented as the mean ± SEM values. Significance was assessed by two-tailed Student’s t-test.
Fig. 4
Fig. 4. Hyaluronidase-2 expression is elevated in human liver fibrosis.
a STRING protein–protein interaction network of HAS2. b HYAL1 and HYAL2 gene expression in liver samples from patients with fibrosis and chronic HBV. *P < 0.05 and **P < 0.01 indicate a significant difference versus F0/1. c Hepatic HYAL1 and HYAL2 expression in patients with HBV-related liver fibrosis (GEO accession number: GSE84044). Liver fibrosis was staged according to the Scheuer scoring system. The data are presented as the mean ± SEM values. Significance was assessed by one-way ANOVA with Tukey’s post-hoc test. d Mice were injected intraperitoneally with corn oil or CCl4 twice a week for 6 weeks. Representative immunofluorescence images of costaining for HYAL2 (red) and cell-specific markers (green)—F4/80 (a marker of macrophages), Desmin (a marker of HSCs), and CD31 (a marker of endothelial cells)—in the livers of corn oil- or CCl4-injected mice. Nuclei were stained with DAPI (blue). Scale bar, 50 μm.
Fig. 5
Fig. 5. Low-molecular-weight HA elevates Ccl3, Ccl4, and Tlr2 mRNA expression in HSCs and Kupffer cells.
a, b Ccl3, Ccl4, Tlr2, and Tlr4 mRNA expression in mouse hepatic stellate cells (HSCs). a Cells were treated with vehicle or with 100 or 200 μg/ml low-molecular-weight hyaluronan (LMW-HA) in combination with 10 μg/ml polymyxin B for 12 h. b Cells were treated with vehicle (Con) or 600 μg/ml high-molecular-weight hyaluronan (HMW-HA) in the presence of 10 μg/ml polymyxin B for 12 h. c, d qRT–PCR analysis of Ccl3, Ccl4, Tlr2, and Tlr4 mRNA expression in mouse Kupffer cells (KC). Cells were treated with vehicle, with 100 or 200 μg/ml LMW-HA, or with 600 μg/ml HMW-HA in combination with 10 μg/ml polymyxin B for 4 h. *P < 0.05 and **P < 0.01 indicate a significant difference versus the Con group (n = 3 per group). N.S. not significant. The data are presented as the mean ± SEM values. Significance was assessed by one-way ANOVA with Tukey’s post-hoc test (a, c) and two-tailed Student’s t-test (b, d).
Fig. 6
Fig. 6. Has2 deficiency in hepatic stellate cells alleviates CCl4-induced ALI.
C57BL/6 mice were injected intraperitoneally with CCl4 or corn oil (Con). Liver samples were harvested 24 h after CCl4 injection. a qRT–PCR analysis of Has2 mRNA expression (Con, n = 5; CCl4, n = 7). **P < 0.01 indicates a significant difference versus the Con group. b qRT–PCR analysis of miR-200c expression in the livers of Con- and CCl4-treated mice. *P < 0.05 indicates a significant difference versus the Con group. c miR-200c levels in primary HSCs isolated from Con- and CCl4-treated mice. *P < 0.05 indicates a significant difference versus the Con group. d Representative images of H&E (upper), HA-binding protein (HABP) (middle), and F4/80 (lower) staining. e Quantification of F4/80+ staining. **P < 0.01 indicates a significant difference versus the WT-Con group; ##P < 0.01 indicates a significant difference versus the WT-CCl4 group. The data are presented as the mean ± SEM values. Significance was assessed by two-tailed Student’s t-test (a–c) and one-way ANOVA with Tukey’s post-hoc test (e).
Fig. 7
Fig. 7. Has2 deficiency in hepatic stellate cells attenuates CCl4-induced chronic liver fibrosis and inflammation.
a qRT–PCR analysis of Has2 mRNA expression in primary hepatic stellate cells (HSC), Kupffer cells (KC), and hepatocytes (HEP) isolated from corn oil (Con)- and CCl4-treated mice. Mice were injected intraperitoneally with corn oil or CCl4 twice a week for 3 weeks. Cells were isolated two days after the last injection. *P < 0.05 and **P < 0.01 indicate a significant difference versus the Con group. N.S. not significant. Significance was assessed by two-tailed Student’s t-test. b Representative images of HA staining of mouse liver sections. Wild-type (WT) and HSC-specific Has2 knockout (Has2ΔHSC) mice were treated with CCl4 twice a week for 6 weeks (n = 5–6 mice per group). c Sirius Red staining and immunohistochemical staining for α-SMA and F4/80. Representative images are shown. d Quantification of the Sirius Red+ area and α-SMA+ area. e qRT–PCR analysis of Has2, Timp1, Col1a1, and Acta2 mRNA expression in primary HSCs (n = 3 per group). **P < 0.01 indicates a significant difference versus the WT-Con group; #P < 0.05 and ##P < 0.01 indicate a significant difference versus the WT-CCl4 group. The data are presented as the mean ± SEM values. Significance was assessed by one-way ANOVA with Tukey’s post-hoc test.
Fig. 8
Fig. 8. Has2 deficiency in hepatic stellate cells or treatment with 4-methylumebelliferone decreases Ccl3 and Ccl4 mRNA levels after bile duct ligation.
a Immunohistochemical staining for α-SMA in liver sections of wild-type (WT) and Has2ΔHSC mice 3 weeks after bile duct ligation (BDL). b Immunohistochemical staining for F4/80. Representative images are shown. c qRT–PCR analysis of Timp1, Ccl3, and Ccl4 in the livers of mice. *P < 0.05 and **P < 0.01 indicate a significant difference versus the Sham-WT group; #P < 0.05 and ##P < 0.01 indicate a significant difference versus the BDL-WT group (n = 3–11 mice per group). The data are presented as the mean ± SEM values. Significance was assessed by one-way ANOVA with Tukey’s post-hoc test. d Immunohistochemical staining for α-SMA in mouse livers 5 days after BDL. Sham- and BDL-operated mice received 225 mg/kg 4-methylumbelliferone (4-MU) or vehicle (Veh) twice a day for 5 days orally. e Immunohistochemical staining for F4/80. Representative pictures are shown. f Hepatic Timp1, Ccl3, and Ccl4 mRNA levels were determined by quantitative PCR. **P < 0.01 indicates a significant difference versus the Sham-Veh group; #P < 0.05 indicates a significant difference versus the BDL-Veh group (n = 4–9 mice per group). The data are presented as the mean ± SEM values. Significance was assessed by one-way ANOVA with Tukey’s post-hoc test.

Similar articles

Cited by

References

    1. Collaborators, G. B. D. C. The global, regional, and national burden of cirrhosis by cause in 195 countries and territories, 1990-2017: a systematic analysis for the Global Burden of Disease Study 2017. Lancet Gastroenterol. Hepatol. 2020;5:245–266. doi: 10.1016/S2468-1253(19)30349-8. - DOI - PMC - PubMed
    1. Yang L, et al. Transforming growth factor-beta signaling in hepatocytes promotes hepatic fibrosis and carcinogenesis in mice with hepatocyte-specific deletion of TAK1. Gastroenterology. 2013;144:1042–1054. doi: 10.1053/j.gastro.2013.01.056. - DOI - PMC - PubMed
    1. Gyorfi AH, et al. Targeting TGF-beta signaling for the treatment of fibrosis. Matrix Biol. 2018;68-69:8–27. doi: 10.1016/j.matbio.2017.12.016. - DOI - PubMed
    1. Butz H, et al. Crosstalk between TGF-beta signaling and the microRNA machinery. Trends Pharmacol. Sci. 2012;33:382–393. doi: 10.1016/j.tips.2012.04.003. - DOI - PubMed
    1. Wang B, et al. miR-200a Prevents renal fibrogenesis through repression of TGF-beta2 expression. Diabetes. 2011;60:280–287. doi: 10.2337/db10-0892. - DOI - PMC - PubMed

Publication types