. 2022 May 14;25(6):104406.
doi: 10.1016/j.isci.2022.104406. eCollection 2022 Jun 17.

Experimental evolution of Bacillus subtilis on Arabidopsis thaliana roots reveals fast adaptation and improved root colonization

Affiliations

Experimental evolution of Bacillus subtilis on Arabidopsis thaliana roots reveals fast adaptation and improved root colonization

Mathilde Nordgaard et al. iScience. .

Abstract

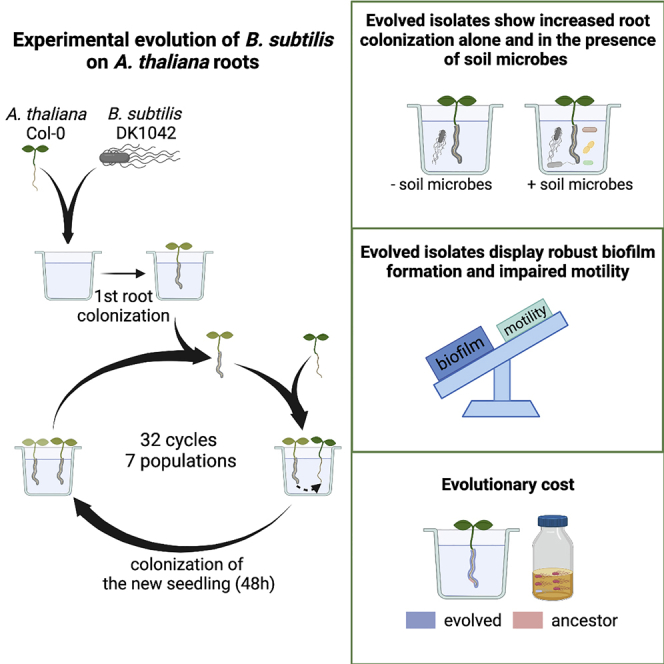
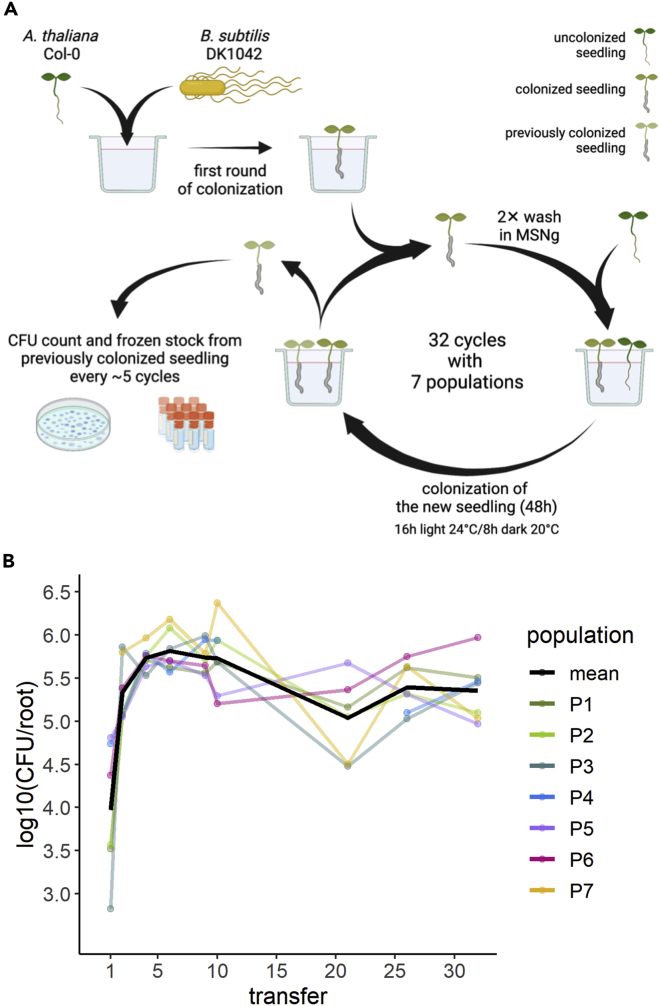
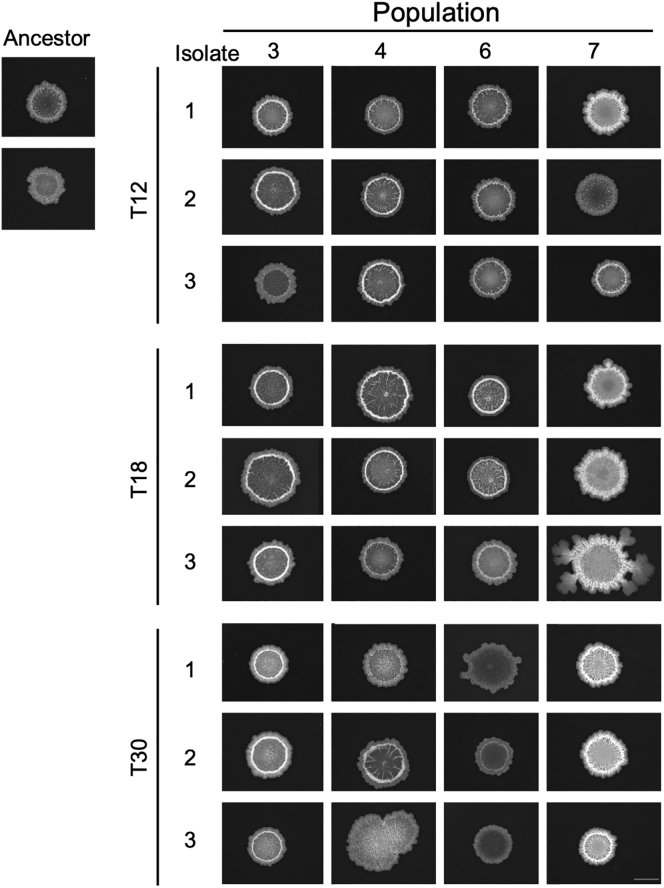
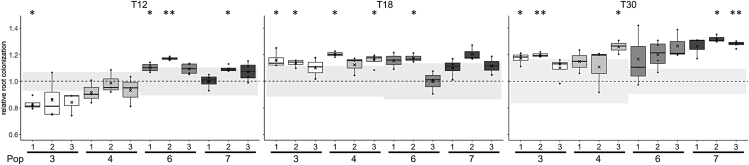
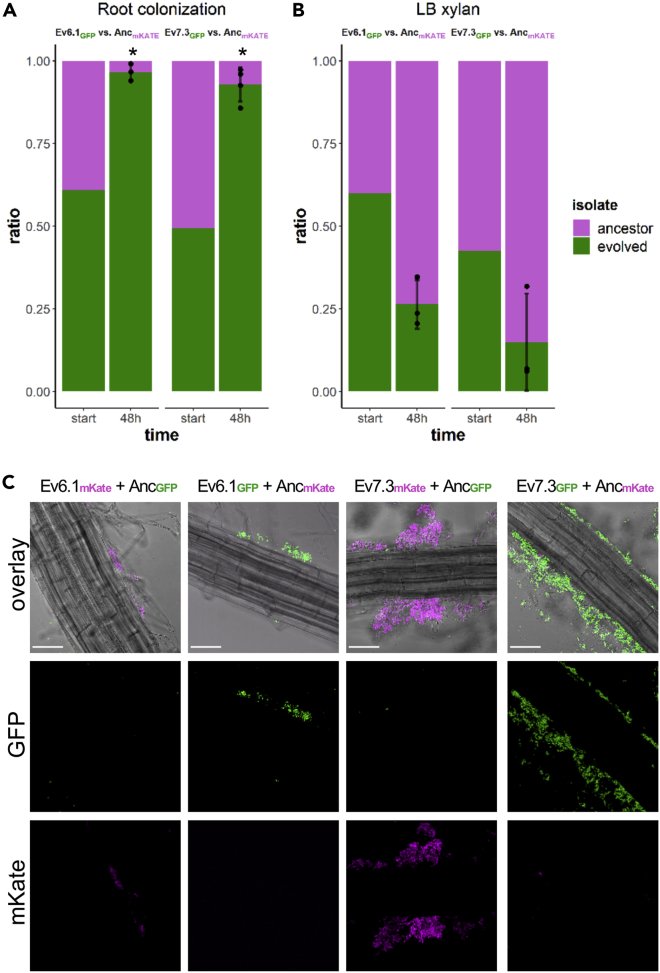
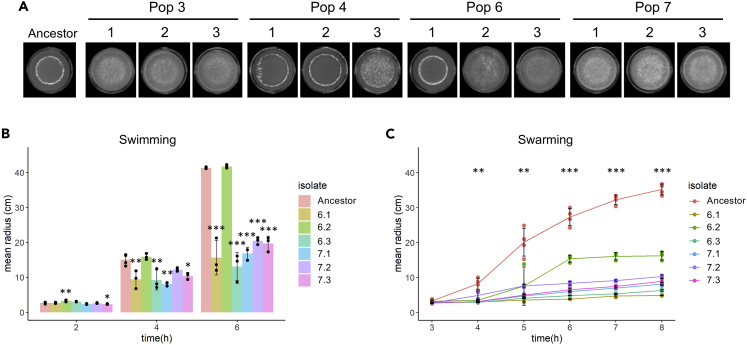
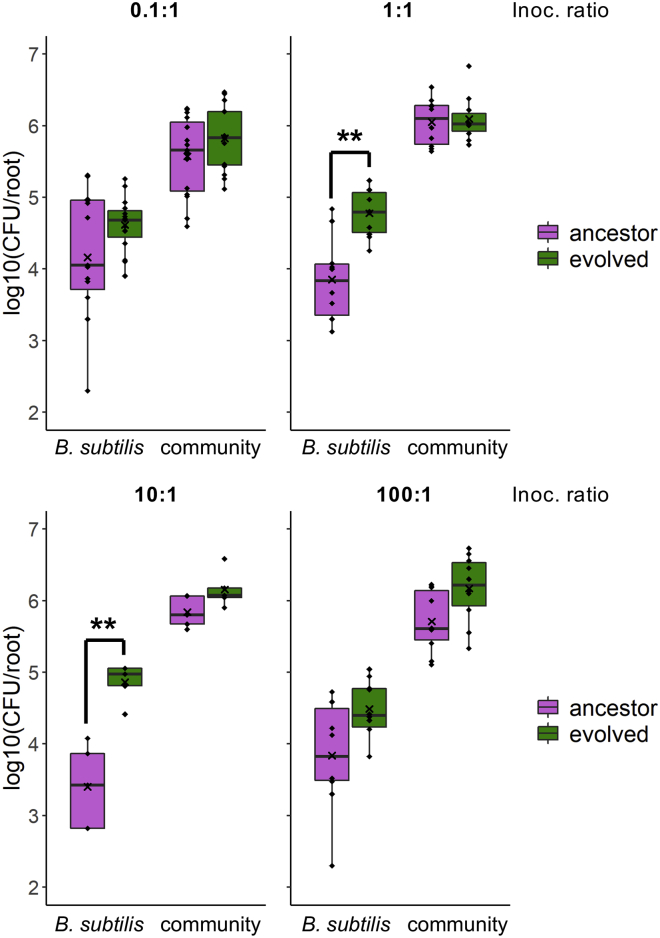
Bacillus subtilis is known to promote plant growth and protect plants against disease. B. subtilis rapidly adapts to Arabidopsis thaliana root colonization, as evidenced by improved root colonizers already after 12 consecutive transfers between seedlings in a hydroponic setup. Re-sequencing of single evolved isolates and endpoint populations revealed mutations in genes related to different bacterial traits, in accordance with evolved isolates displaying increased root colonization associated with robust biofilm formation in response to the plant polysaccharide xylan and impaired motility. Interestingly, evolved isolates suffered a fitness disadvantage in a non-selective environment, demonstrating an evolutionary cost of adaptation to the plant root. Finally, increased root colonization by an evolved isolate was also demonstrated in the presence of resident soil microbes. Our findings highlight how a plant growth-promoting rhizobacterium rapidly adapts to an ecologically relevant environment and reveal evolutionary consequences that are fundamental to consider when evolving strains for biocontrol purposes.

Keywords: ecology; microbiology; plant biology.


Conflict of interest statement

The authors declare no competing interests.

Figures

None
Graphical abstract
Figure 1
Figure 1
Overview of experimental evolution and productivity of evolving populations (A) Overview of the experimental evolution approach. Created on BioRender.com. (B) The B. subtilis populations rapidly increased in productivity during the experimental evolution on A. thaliana roots. The productivity (CFU/root) of the evolving populations was systematically quantified as CFU/root at nine different time points during the ongoing EE. The y axis displays the log10-transformed productivity. The black line represents the mean population productivity (N = 7).
Figure 2
Figure 2
Distinct colony morphologies are observed among evolved isolates from different time points of the experimental evolution ON cultures of the ancestor and evolved isolates from populations 3, 4, 6, and 7 at transfer 12, 18, and 30 were spotted on LB agar (1.5%) and imaged after incubation for 48 h at 30°C using a stereomicroscope. Ancestor represents B. subtilis DK1042. Each colony is representative of at least three replicates. Scale bar = 5 mm.
Figure 3
Figure 3
Evolved isolates from different time points show increased productivity on the root relative to the ancestor The ancestor and evolved isolates from populations 3, 4, 6, and 7 at three different time points (T12, 18, 30) were tested for individual root colonization. For each evolved isolate, relative root colonization was calculated by dividing the log10-transformed productivity (CFU/mm root) of each replicate by the mean of the log10-transformed productivity of the ancestor from the same experimental setup. The cross represents the mean relative root colonization (N = 3-4). The dashed, horizontal line represents the mean of the ancestor (N = 3-4), whereas the grey-shaded rectangles represent the SD of the ancestor from the corresponding experiment. The normalized values were subjected to a One-sample t-test to test whether the mean was significantly different from 1. p-values have been corrected for multiple comparisons. ∗p < 0.05, ∗∗p < 0.01. See also Figure S2.
Figure 4
Figure 4
Two evolved isolates from transfer 30 outcompete the ancestor on the root but suffer a fitness disadvantage under shaking conditions in LB + xylan (A and B) Pairwise competitions between ancestor (magenta) and evolved isolates (green) during root colonization (A) and in LB xylan (0.5%) under shaking conditions (B) for 48 h. In A and B, the bar plots show the starting ratio of the evolved isolate and ancestor in the mix, and the observed ratios after 48 h. Bars represent the mean (N = 3-4), the error bars represent the SD and the points show the replicates for the evolved (below) and ancestor (above). For statistical analysis, the relative fitness (r) of the evolved isolates was calculated by comparing the frequency of the evolved isolate at the beginning and end of the competition experiment. The log2-transformed relative fitness values were subjected to a One-sample t-test to test whether the mean was significantly different from 0. ∗p < 0.05. (C) A. thaliana roots colonized by a 1:1 mix of ancestor and evolved isolates imaged by CLSM. Both fluorescence combinations are shown. The top row shows the overlay of the fluorescence channels and the bright field image. Images are representative of three independent A. thaliana seedlings. Color codes are shown at the top. Scale bar is 50 μm. See also Figure S1.
Figure 5
Figure 5
Evolved isolates from T30 show altered pellicle biofilm formation in response to plant polysaccharides and impaired motility (A) Ancestor and evolved isolates from transfer 30 were inoculated into LB + 0.5% xylan at a starting OD600 of 0.05 in 24-well plates. Images were acquired after 48 h incubation at 30°C using a stereomicroscope. Each image is representative of four replicates. Each well has 16 mm width. Evolved isolates were tested for swimming (B) and swarming (C) motility in LB medium supplemented with 0.3 or 0.7% agar, respectively. (B) Bars represent the mean (N = 3-4) and error bars represent SD. (C) Lines represent the mean (N = 2-4) and error bars the SD. For the motility assays, the following statistical analysis applies: For each time point, an ANOVA was performed on the log10-transformed data followed by a Dunnett’s Multiple Comparison test with the ancestor as the control. For swarming motility, the asterisks show the least significance observed for the given time point. At 3 h, only isolate 7.3 was significantly reduced in swarming motility. ∗p < 0.05, ∗∗p < 0.01, ∗∗∗p < 0.001. See also Tables S1, S2, Figures S3, S4, and S5.
Figure 6
Figure 6
Root colonization by B. subtilis ancestor and isolate Ev7.3 in the presence of a synthetic, soil-derived community The ancestor and evolved isolate, Ev7.3, were tested for the ability to colonize the root in the presence of a synthetic, soil-derived bacterial community. B. subtilis ancestor or Ev7.3 and the community were co-inoculated onto A. thaliana roots in four different ratios: 0.1:1, 1:1, 10:1, and 100:1 of B. subtilis and community, respectively. Root colonization after 48 h was quantified as log10-transformed productivity (CFU/root). Each plot shows the resulting root colonization at the given inoculation ratio of B. subtilis (left) and the co-inoculated community (right). Magenta: Ancestor and the corresponding community co-inoculated with the ancestor. Green: Ev7.3 and the community co-inoculated with Ev7.3. The cross represents the mean (N = 5–15). Within each inoculation ratio, statistical significance between B. subtilis ancestor and Ev7.3, and between the communities co-inoculated with the ancestor or with Ev7.3 was tested with a Two-sample t-test (Welch’s Two-sample t-test when unequal variance). ∗∗p < 0.01. See also Figures S6 and S7.

References

    1. Agarwala R., Barrett T., Beck J., Benson D.A., Bollin C., Bolton E., Bourexis D., Brister J.R., Bryant S.H., Canese K., et al. Database resources of the National center for biotechnology information. Nucleic Acids Res. 2018;46:D8–D13. doi: 10.1093/nar/gkx1095. - DOI - PMC - PubMed
    1. Akram W., Anjum T., Ali B. Searching ISR determinant/s from Bacillus subtilis IAGS174 against Fusarium wilt of tomato. BioControl. 2015;60:271–280. doi: 10.1007/s10526-014-9636-1. - DOI
    1. Allard-Massicotte R., Tessier L., Lécuyer F., Lakshmanan V., Lucier J.F., Garneau D., Caudwell L., Vlamakis H., Bais H.P., Beauregard P.B. Bacillus subtilis early colonization of Arabidopsis thaliana roots involves multiple chemotaxis receptors. MBio. 2016;7:e01664-16. doi: 10.1128/mBio.01664-16. - DOI - PMC - PubMed
    1. Asaka O., Shoda M. Biocontrol of Rhizoctonia solani damping-off of tomato with Bacillus subtilis RB14. Appl. Environ. Microbiol. 1996;62:4081–4085. doi: 10.1128/aem.62.11.4081-4085.1996. - DOI - PMC - PubMed
    1. Bai U., Mandic-Mulec I., Smith I. SinI modulates the activity of SinR, a developmental switch protein of Bacillus subtilis, by protein-protein interaction. Genes Dev. 1993;7:139–148. doi: 10.1101/gad.7.1.139. - DOI - PubMed

LinkOut - more resources