. 2022 May 4:25:288-304.
doi: 10.1016/j.omto.2022.04.012. eCollection 2022 Jun 16.

Icaritin inhibits PLK1 to activate DNA damage response in NK/T cell lymphoma and increases sensitivity to GELOX regime

Affiliations

Icaritin inhibits PLK1 to activate DNA damage response in NK/T cell lymphoma and increases sensitivity to GELOX regime

Canjing Zhang et al. Mol Ther Oncolytics. .

Abstract

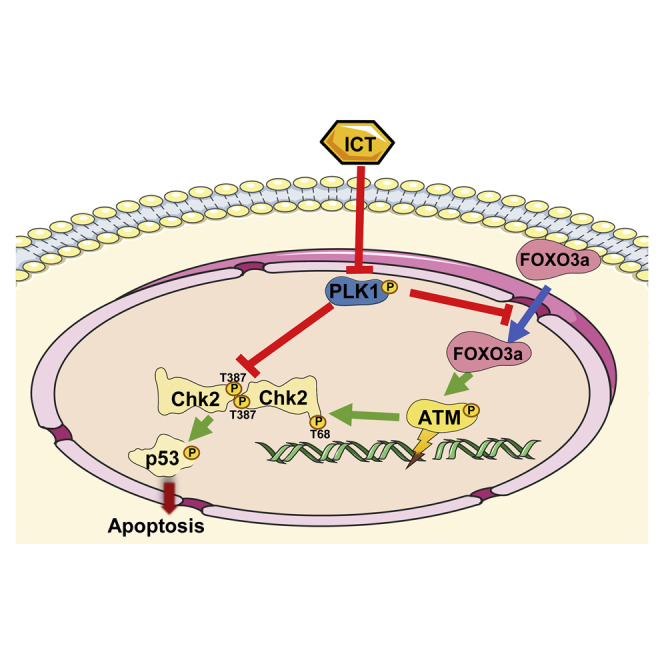
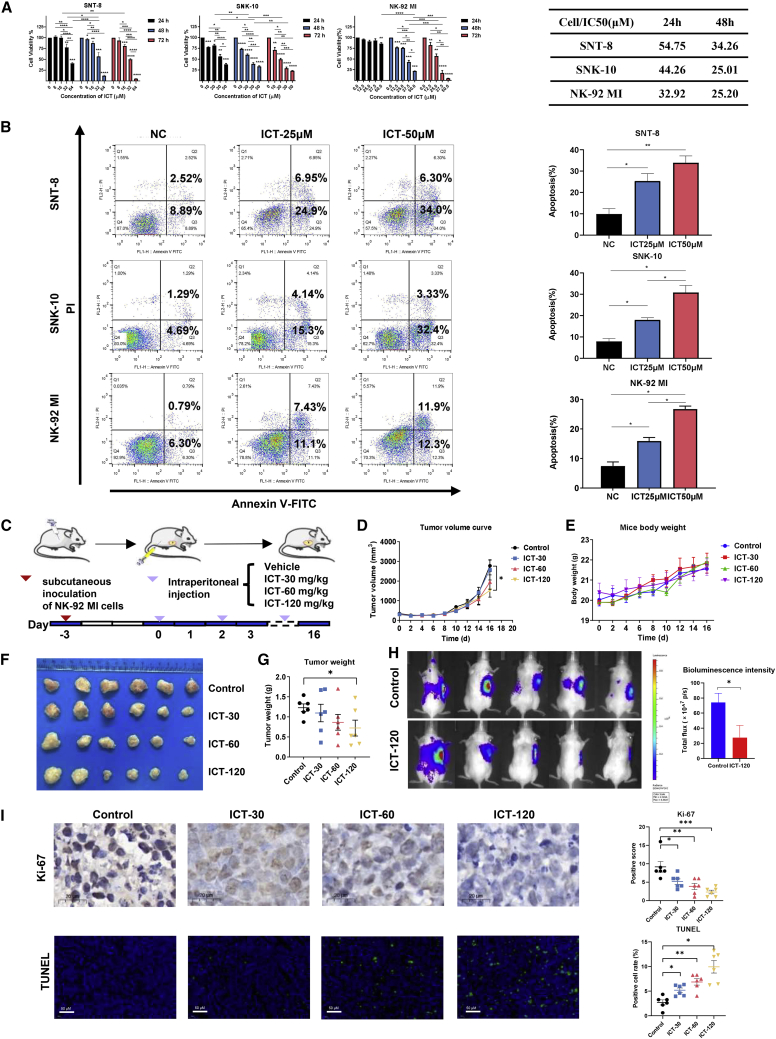
Natural killer/T cell lymphoma (NKTCL) is a highly aggressive subtype of non-Hodgkin lymphoma. Gemcitabine, oxaliplatin, and L-asparaginase (GELOX) is one of the first-line chemotherapy regimens of NKTCL. Yet, the prognosis of NKTCL is poor. Icaritin is an herb-derived monomer from icariin with antitumor effects. We found that icaritin induced proliferation inhibition and apoptosis of NKTCL both in vitro and in vivo. Moreover, icaritin inhibited the dissemination of NKTCL in vivo. RNA sequencing revealed the Polo-like kinase 1 (PLK1) gene and DNA damage response (DDR) as the targets of icaritin. Mechanistically, icaritin inhibited PLK1 to promote checkpoint kinase 2 (Chk2) homodimerization and its T387 phosphorylation, which further activated p53, leading to the activation of the DDR pathway. Moreover, inhibiting PLK1 increased Forkhead box O3a nuclear localization, the latter of which activated ataxia telangiectasia mutated (ATM), an early sensor of DNA damage. Then ATM phosphorylated Chk2 T68 and initiated Chk2 activation. Remarkably, the combined treatment of icaritin and GELOX achieved better antitumor efficacy than single treatment in vivo. In summary, our results proved the efficacy of icaritin treating NKTCL, provided insights into its antitumor molecular mechanism, and revealed the application value of icaritin in facilitating clinical NKTCL treatment.

Keywords: Chk2; DNA damage response; FOXO3a; NKTCL; PLK1; icaritin.


Conflict of interest statement

The authors declare no competing interests.

Figures

None
Graphical abstract
Figure 1
Figure 1
ICT inhibits NKTCL growth in vitro and in vivo (A) ICT inhibited the viability of NKTCL cells. SNT-8, SNK10 and NK-92 MI cells were treated with the indicated concentrations of ICT for 24, 48, and 72 h. Cell viability was measured by CCK-8 assay (left). Data are presented as mean ± standard error of the mean (n = 3). The IC50 of NKTCL cells treated with ICT for 24 and 48 h were calculated (right). (B) ICT induced apoptosis of NKTCL cell lines. NKTCL cells were treated with 0, 25, and 50 μM ICT for 48 h and the apoptosis was measured by Annexin V-FITC/PI double staining and flow cytometry. Representative results were shown and percentage of apoptotic cells was plotted. Data were represented as mean ± standard error of the mean (n = 3). (C) The mice were inoculated with NK-92 MI cells subcutaneously and randomized into four groups (n = 6/group). Tumor inoculation and treatment scheme were shown. (D) Tumor volumes measured at the indicated time. (E) Mice body weight measured at the indicated time. (F) The photo of isolated tumors derived from mice treated with vehicle or 30, 60, or 120 mg/kg ICT. (G) Tumor weights measured after mice sacrifice. (H) Bioluminescence imaging of NK-92 MI LUC-tumor bearing mice in control and ICT 120 mg/kg groups (n = 5/group). (I) The Ki67 expression in tumor xenografts was examined by IHC. The apoptosis rate was assessed by TUNEL assay. Nuclei were stained with DAPI (blue). Green points indicate the TUNEL-positive nuclei. Representative images were shown. ∗p < 0.05; ∗∗p < 0.01; ∗∗∗p < 0.001; ∗∗∗∗p < 0.0001. Scale bar, 20 μm or 50 μm.
Figure 2
Figure 2
Bioinformatic analysis reveals that ICT down-regulates PLK1 and activates the apoptosis, p53 and FOXO pathway (A) DEGs of SNT-8, SNK-10, and NK-92 MI cell lines treated with DMSO or ICT were selected with a fold change of 2 or greater and a p value of less than 0.05. Orange for up-regulated genes and blue for down-regulated genes. (B) The Venn diagram showed the overlap of 110 genes among 3 datasets. (C) The bubble plot showed the KEGG results of the 110 genes. (D) Heatmap of genes enriched in p53, FOXO and apoptosis signaling pathways. (E) The PPI network of 110 enriched genes was constructed using Cytoscape. One of the core modules of DEGs obtained by MCODE from PPI network was shown by red arrow. (F) The FPKM value of PLK1 gene in three NKTCL cell lines treated with DMSO or ICT were shown. (G) The expression of PLK1 in normal lymph nodes and NKTCL cell lines. The data were acquired from the GSE63548, GSE25297, GSE36172, and GSE19067 datasets of the GEO database. ∗p < 0.05; ∗∗p < 0.01; ∗∗∗p < 0.001; ∗∗∗∗p < 0.0001.
Figure 3
Figure 3
ICT inhibits cell proliferation and induces apoptosis by inhibiting PLK1 (A) SNT-8 and SNK-10 cells were treated with 50 μM of ICT for 0, 3, 6, 12, 24, and 48 h. NK-92 MI cells were treated with 25 μM of ICT for 0, 1, 2, 3, 6, and 12 h. The PLK1 mRNA expression was detected by qPCR. β-Actin was used as an internal reference. Data were presented as mean ± standard error of the mean (n = 3). (B) The protein levels of PLK1 and p-PLK1 in SNT-8, SNK-10, and NK-92 MI cells treated with ICT for the indicated time points were assessed by Western blot. GAPDH was used as a loading control. (C and D) The quantitative analyses of p-PLK1 and PLK1 protein levels in SNT-8, SNK-10, and NK-92 MI cells treated with ICT. (E) NK-92 MI cells stably transfected with tet on PLK1 or EV were treated with 2 or 4 mg/mL of DOX for 12 or 24 h. The mRNA level of PLK1 was detected by qPCR. (F) NK-92 MI, tet on PLK1 and EV cells were treated with 2 mg/mL of DOX for 24 h and the PLK1 protein level was detected using western blot. (G) NK-92 MI cells stably transfected with tet on PLK1 or EV were treated with 2 mg/mL DOX for 12 h, or 25 μM ICT for 24 h, or ICT for 24 h followed with DOX for 12 h. The apoptotic cell ratio was measured by Annexin V-FITC/PI double staining and flow cytometry. Representative images were shown. (H) SNT-8, SNK10, and NK-92 MI cells were treated with the indicated concentrations of BI 2536 for 24, 48 or 72 h. Cell viability was measured by CCK-8 assay. (I) The apoptotic cell ratio was measured after NKTCL cells were treated with BI 2536, ICT, or DMSO for 48 h. Representative images were shown. Data were presented as mean ± standard error of the mean (n = 3). ∗p < 0.05; ∗∗p < 0.01; ∗∗∗p < 0.001; ∗∗∗∗p < 0.0001. Tet on PLK1, tetracycline-inducible PLK1 overexpression NK-92 MI cells.
Figure 4
Figure 4
ICT promotes Chk2 dimerization and activation through inhibiting PLK1 (A) SNT-8 and SNK-10 cells were treated with 50 μM of ICT and NK-92 MI cells were treated with 25 μM of ICT for 0, 3, 6, 12, 24, or 48 h. Cell lysates were subjected to western blot to detect the indicated proteins (intracellular crosslinking using DSS was needed to detect Chk2 dimer). β-Actin, GAPDH, and α-tublin were used as loading controls. (B and C) Co-IP assay was performed using SNT-8, SNK-10, and NK-92 MI cells lysates. (B) The immune complexes were formed by pre-incubation with anti-PLK1 (IP PLK1) and revealed with Chk2 antibody or PLK1 antibody. (C) The immune complexes were formed by pre-incubation with anti-Chk2 (IP Chk2) and revealed with PLK1 antibody or Chk2 antibody. (D) Tet on PLK1 and EV cells were treated with DMSO, 2 mg/mL DOX for 12 h, 25 μM ICT for 12 h, or ICT for 12 h followed with DOX for 12 h. Western blot assay was conducted using indicated antibodies (intracellular crosslinking before cell lysis was performed to detect Chk2 dimer). GAPDH was used as a loading control. (E) SNT-8, SNK-10, and NK-92 MI cells were treated with ICT or BI 2536 and the indicated proteins were detected using western blot. GAPDH was used as a loading control. IP, immunoprecipitation; Tet on EV, tetracycline-inducible EV NK-92 MI cell line; Tet on PLK1, tetracycline-inducible PLK1 overexpression NK-92 MI cell line.
Figure 5
Figure 5
ICT promotes FOXO3a nuclear localization to activate ATM through inhibiting PLK1 (A) SNT-8 and SNK-10 cells were treated with 50 μM of ICT and NK-92 MI cells were treated with 25 μM of ICT for 0, 3, 6, 12, 24, or 48 h. Total cell lysates, cytoplasmic, and nuclear extracts were immunoblotted for the indicated proteins. GAPDH was used as a loading control. (B and C) Co-IP assay was performed using SNT-8, SNK-10, and NK-92 MI cells lysates. (B) The immune complexes were formed by pre-incubation with anti-PLK1 (IP PLK1) and revealed with FOXO3a antibody and PLK1 antibody. (C) The immune complexes were formed by pre-incubation with anti-FOXO3a (IP FOXO3a) and revealed with PLK1 antibody and FOXO3a antibody. (D) Tet on PLK1 and EV cells were treated with DMSO, 2 mg/mL DOX for 12 h, 25 μM ICT for 12 h, or ICT for 12 h followed by DOX for 12 h. The total cell lysates, cytoplasmic and nuclear extracts were subjected to the immunoblotting of indicated proteins. GAPDH was used as a loading control. (E) SNT-8, SNK-10, and NK-92 MI cells were treated with DMSO, ICT or BI 2536. The total cell lysates, cytoplasmic and nuclear extracts were subjected to the immunoblotting of indicated proteins. (F) Representative IF images of FOXO3a (red) in cells treated with DMSO, ICT, or BI 2536 for 48 h. Nuclei were stained with DAPI (blue). Three experiments were performed with similar results. (G) Double fluorescent immunostaining of PLK1 (red) and FOXO3a (green) of the xenograft tissues from the control group and the 120 mg/kg of ICT group. Nuclei were stained with DAPI (blue). Three experiments were performed with similar results. Scale bar, 20 μm. IP, immunoprecipitation; Tet on EV, tetracycline-inducible EV NK-92 MI cell line; Tet on PLK1, tetracycline-inducible PLK1 overexpression NK-92 MI cell line.
Figure 6
Figure 6
ICT inhibits PLK1 and activates DDR pathway in vivo (A) Representative IHC images of tumor tissues from control, 30, 60, and 120 mg/kg of ICT mice group (left) and the quantification of IHC results (right). (B) Tumor tissue extracts (120 mg/kg of ICT group and control group) were subjected to western blot using the indicated antibodies (n = 6/group). GAPDH was used as a loading control (left). (Right) Densitometric analysis of the western blot. ∗p < 0.05; ∗∗p < 0.01. Scale bar, 20 μm.
Figure 7
Figure 7
ICT facilitates GELOX regime in vivo (A) The xenograft mice were treated with vehicle, ICT (120 mg/kg every other day) or/and GELOX regime (62.5 mg/kg gemcitabine, 6.25 mg/kg oxaliplatin, and 125 U/kg L-asparaginase at day 1, and 62.5 mg/kg gemcitabine at day 8). (B) Tumor volumes measured at the indicated time. (C) The photo of isolated xenografts. (D) Tumor weights after isolation. (E) Mice body weight measured at the indicated time. (F) Tumor xenograft sections of control, 120 mg/kg ICT, GELOX, and combined treatment of ICT and GELOX groups were examined by IHC analyses of Ki-67, and TUNEL assay. Nuclei were stained with DAPI (blue). Green points indicate the TUNEL-positive nuclei. Representative images were shown (left). (Right) Statistical analysis of the TUNEL and Ki-67. ∗p < 0.05; ∗∗p < 0.01; ∗∗∗p < 0.001; ∗∗∗∗p < 0.0001. Scale bar, 20 μm.

References

    1. Swerdlow S.H.C.E., Harris N.L., Jaffe E.S., Pileri S.A., Stein H., Thiele J. Fourth edition. IARC; 2017. WHO Classification of Tumours of Haematopoietic and Lymphoid Tissues, Revised.
    1. Yamaguchi M., Suzuki R., Oguchi M. Advances in the treatment of extranodal NK/T-cell lymphoma, nasal type. Blood. 2018;131:2528–2540. doi: 10.1182/blood-2017-12-791418. - DOI - PubMed
    1. Yamaguchi M., Miyazaki K. Current treatment approaches for NK/T-cell lymphoma. J. Clin. Exp. Hematopathol. 2017;57:98–108. doi: 10.3960/jslrt.17018. - DOI - PMC - PubMed
    1. Kwong Y.L., Kim W.S., Lim S.T., Kim S.J., Tang T., Tse E., Leung A.Y.H., Chim C.S. SMILE for natural killer/T-cell lymphoma: analysis of safety and efficacy from the Asia Lymphoma Study Group. Blood. 2012;120:2973–2980. doi: 10.1182/blood-2012-05-431460. - DOI - PubMed
    1. Yamaguchi M., Kwong Y.L., Kim W.S., Maeda Y., Hashimoto C., Suh C., Izutsu K., Ishida F., Isobe Y., Sueoka E., et al. Phase II study of SMILE chemotherapy for newly diagnosed stage IV, relapsed, or refractory extranodal natural killer (NK)/T-cell lymphoma, nasal type: the NK-Cell Tumor Study Group Study. J. Clin. Oncol. 2011;29:4410–4416. doi: 10.1200/jco.2011.35.6287. - DOI - PubMed