

Dihydroartemisinin Exerts Antifibrotic and Anti-Inflammatory Effects in Graves' Ophthalmopathy by Targeting Orbital Fibroblasts
- PMID: 35663306
- PMCID: PMC9157422
- DOI: 10.3389/fendo.2022.891922
Dihydroartemisinin Exerts Antifibrotic and Anti-Inflammatory Effects in Graves' Ophthalmopathy by Targeting Orbital Fibroblasts
Abstract
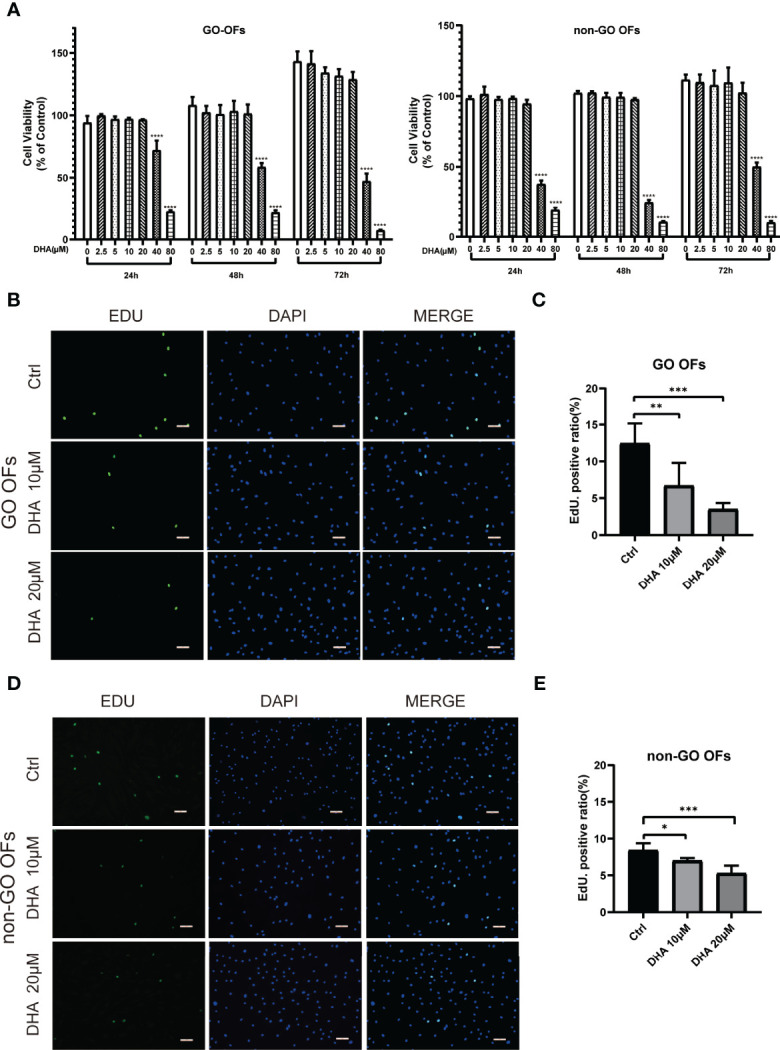
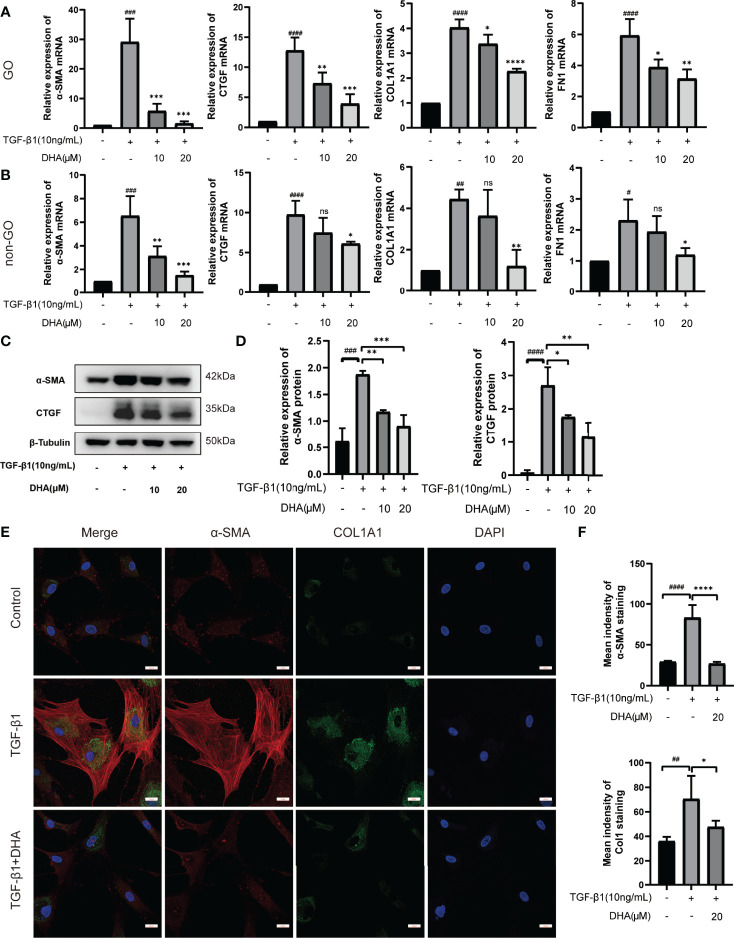
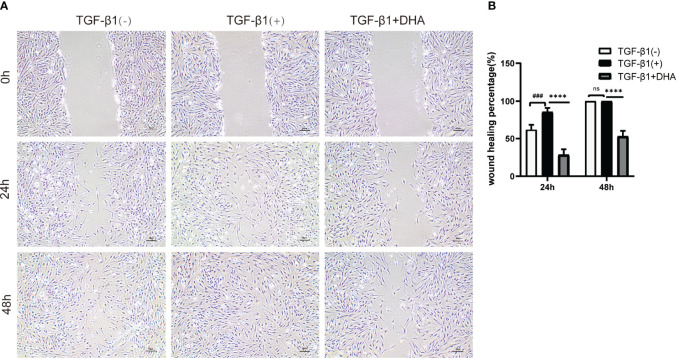
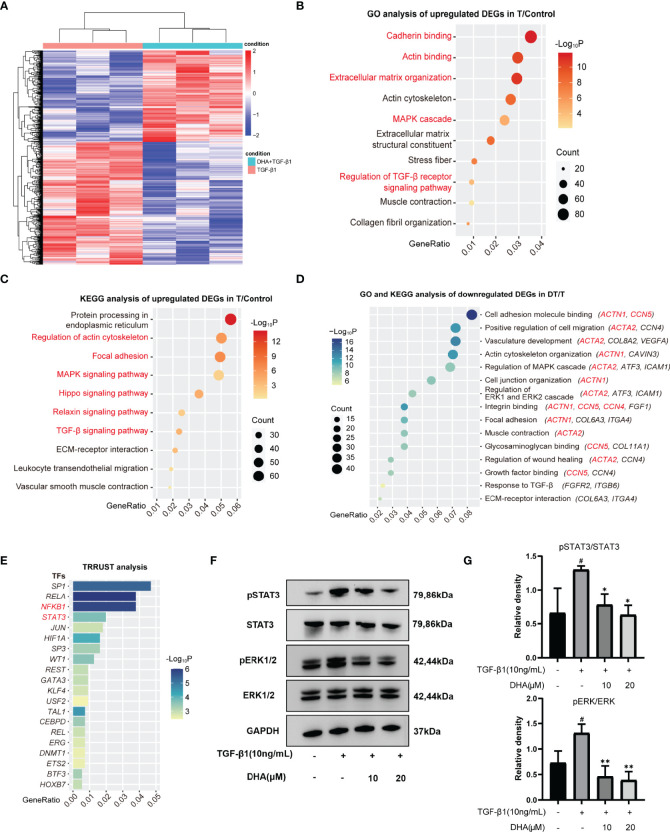
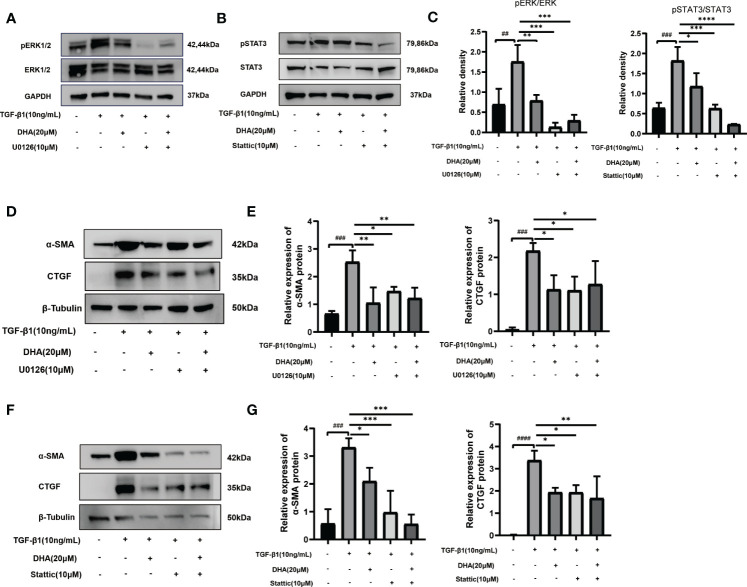
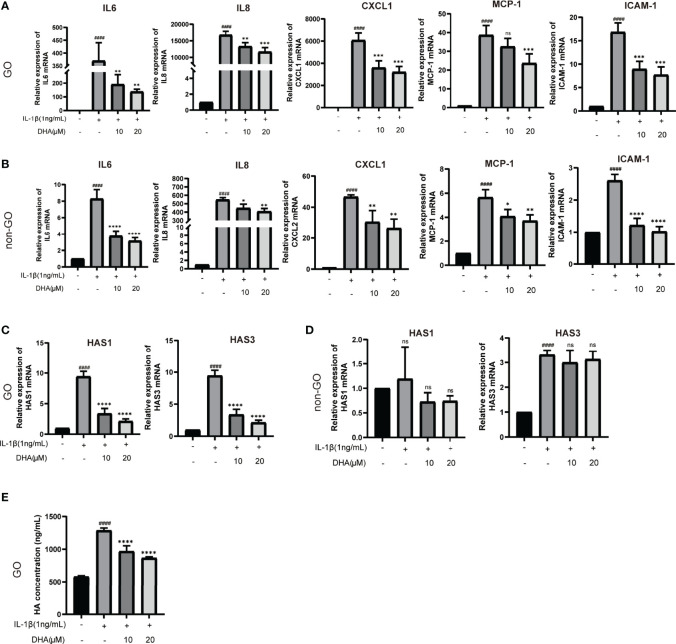
Graves' ophthalmopathy (GO) is a common orbital disease that threatens visual function and appearance. Orbital fibroblasts (OFs) are considered key target and effector cells in GO. In addition, hyaluronan (HA) production, inflammation, and orbital fibrosis are intimately linked to the pathogenesis of GO. In this study, we explored the therapeutic effects of dihydroartemisinin (DHA), an antimalarial drug, on GO-derived, primary OFs. CCK8 and EdU assays were applied to evaluate the antiproliferative effect of DHA on OFs. Wound healing assays were conducted to assess OF migration capacity, while qRT-PCR, western blotting, ELISA, and immunofluorescence were used to determine the expression of fibrosis-related and pro-inflammatory markers in these cells. Moreover, RNA sequencing was conducted to identify differentially expressed genes (DEGs) in DHA-treated OFs, and Gene Ontology (GO) and Kyoto Encyclopedia of Genes and Genomes (KEGG) pathway enrichment analysis of DEGs was performed to explore potential mechanisms mediating the antifibrotic effect of DHA on GO-derived OFs. Results showed that DHA dose-dependently inhibited OF proliferation and downregulated, at the mRNA and protein levels, TGF-β1-induced expression of fibrosis markers, including alpha smooth muscle actin (α-SMA) and connective tissue growth factor (CTGF). Furthermore, DHA inhibited TGF-β1 induced phosphorylation of extracellular signal-regulated protein kinase 1/2 (ERK1/2) and signal transducer and activator of transcription 3 (STAT3), which suggested that DHA exerted antifibrotic effects via suppression of the ERK and STAT3 signaling pathways. In addition, DHA suppressed the expression of pro-inflammatory cytokines and chemokines, including IL-6, IL-8, CXCL-1, MCP-1, and ICAM-1, and attenuated HA production induced by IL-1β in GO-derived OFs. In conclusion, our study provides first-time evidence that DHA may significantly alleviate pathogenic manifestations of GO by inhibiting proliferation, fibrosis- and inflammation-related gene expression, and HA production in OFs. These data suggest that DHA may be a promising candidate drug for treatment of GO.
Keywords: ERK; Graves’ ophthalmopathy; STAT3; dihydroartemisinin; fibrosis; inflammation; orbital fibroblast.
Copyright © 2022 Yang, Wang, Xiao, Xu, Ye, Sha and Yang.
Conflict of interest statement
The authors declare that the research was conducted in the absence of any commercial or financial relationships that could be construed as a potential conflict of interest.
Figures
Similar articles
-
Disulfiram Exerts Antiadipogenic, Anti-Inflammatory, and Antifibrotic Therapeutic Effects in an In Vitro Model of Graves' Orbitopathy.Thyroid. 2022 Mar;32(3):294-305. doi: 10.1089/thy.2021.0246. Epub 2021 Dec 31. Thyroid. 2022. PMID: 34605662
-
Disulfiram Exerts Antifibrotic and Anti-Inflammatory Therapeutic Effects on Perimysial Orbital Fibroblasts in Graves' Orbitopathy.Int J Mol Sci. 2022 May 9;23(9):5261. doi: 10.3390/ijms23095261. Int J Mol Sci. 2022. PMID: 35563653 Free PMC article.
-
MMP14 as a central mediator of TGF-β1-induced extracellular matrix remodeling in graves' orbitopathy.Front Endocrinol (Lausanne). 2025 Jul 22;16:1623842. doi: 10.3389/fendo.2025.1623842. eCollection 2025. Front Endocrinol (Lausanne). 2025. PMID: 40766297 Free PMC article.
-
Current perspectives on the role of orbital fibroblasts in the pathogenesis of Graves' ophthalmopathy.Exp Eye Res. 2016 Jan;142:83-91. doi: 10.1016/j.exer.2015.02.007. Exp Eye Res. 2016. PMID: 26675405 Review.
-
Molecular biomarkers of Graves' ophthalmopathy.Exp Mol Pathol. 2019 Feb;106:1-6. doi: 10.1016/j.yexmp.2018.11.004. Epub 2018 Nov 8. Exp Mol Pathol. 2019. PMID: 30414981 Free PMC article. Review.
Cited by
-
Current and promising therapies based on the pathogenesis of Graves' ophthalmopathy.Front Pharmacol. 2023 Nov 16;14:1217253. doi: 10.3389/fphar.2023.1217253. eCollection 2023. Front Pharmacol. 2023. PMID: 38035032 Free PMC article. Review.
-
Purine nucleoside phosphorylase dominates Influenza A virus replication and host hyperinflammation through purine salvage.Signal Transduct Target Ther. 2025 Jun 15;10(1):191. doi: 10.1038/s41392-025-02272-1. Signal Transduct Target Ther. 2025. PMID: 40517177 Free PMC article.
-
Identification and verification of the optimal feature genes of ferroptosis in thyroid-associated orbitopathy.Front Immunol. 2024 Dec 13;15:1422497. doi: 10.3389/fimmu.2024.1422497. eCollection 2024. Front Immunol. 2024. PMID: 39735537 Free PMC article.
-
Elastin as a Novel Extracellular Matrix From Aberrant HDAC4 Expression in PDGF-BB-Induced Orbital Fibroblasts From Graves' Ophthalmopathy Patients.Invest Ophthalmol Vis Sci. 2025 Jul 1;66(9):30. doi: 10.1167/iovs.66.9.30. Invest Ophthalmol Vis Sci. 2025. PMID: 40643339 Free PMC article.
-
Characteristics of Hyaluronan Metabolism During Myofibroblast Differentiation in Orbital Fibroblasts.Invest Ophthalmol Vis Sci. 2024 Nov 4;65(13):13. doi: 10.1167/iovs.65.13.13. Invest Ophthalmol Vis Sci. 2024. PMID: 39504052 Free PMC article.
References
Publication types
MeSH terms
Substances
LinkOut - more resources
Full Text Sources
Molecular Biology Databases
Research Materials
Miscellaneous