. 2021:1:39.
doi: 10.1038/s43586-021-00038-x. Epub 2021 Jun 3.

Single-molecule localization microscopy

Affiliations

Single-molecule localization microscopy

Mickaël Lelek et al. Nat Rev Methods Primers. 2021.

Abstract

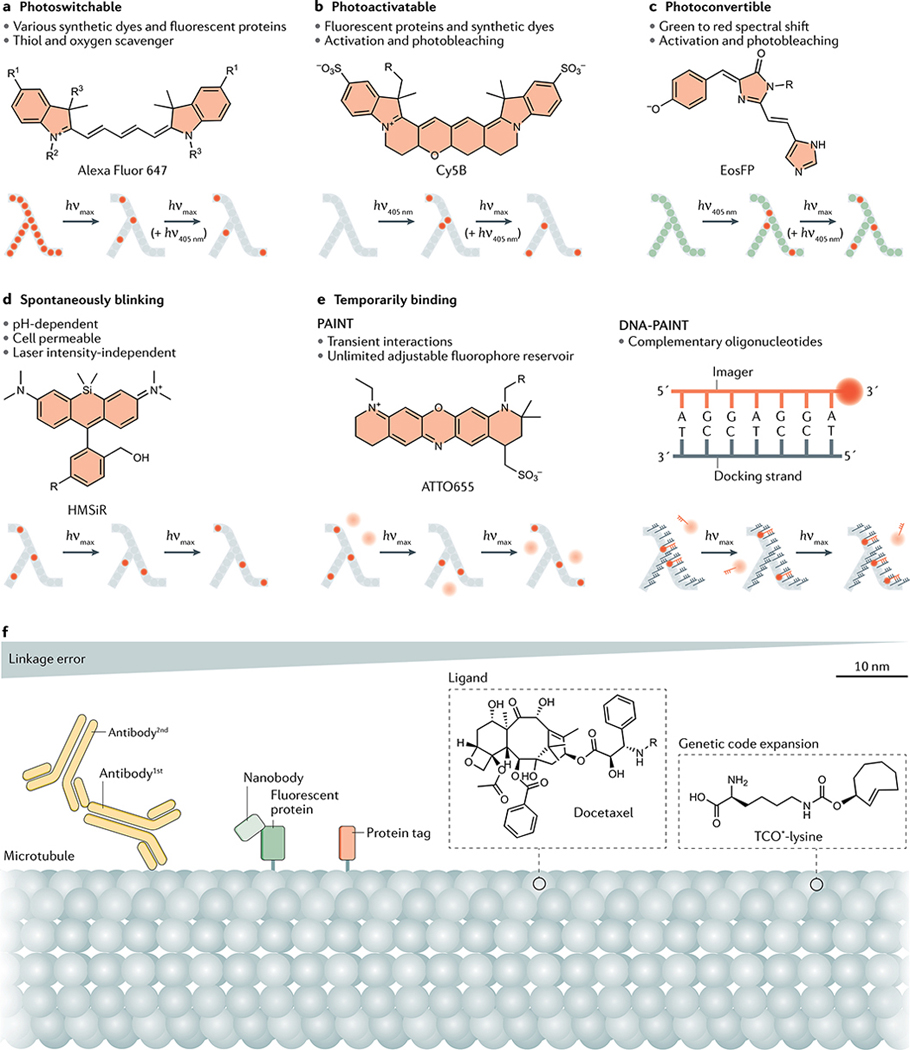
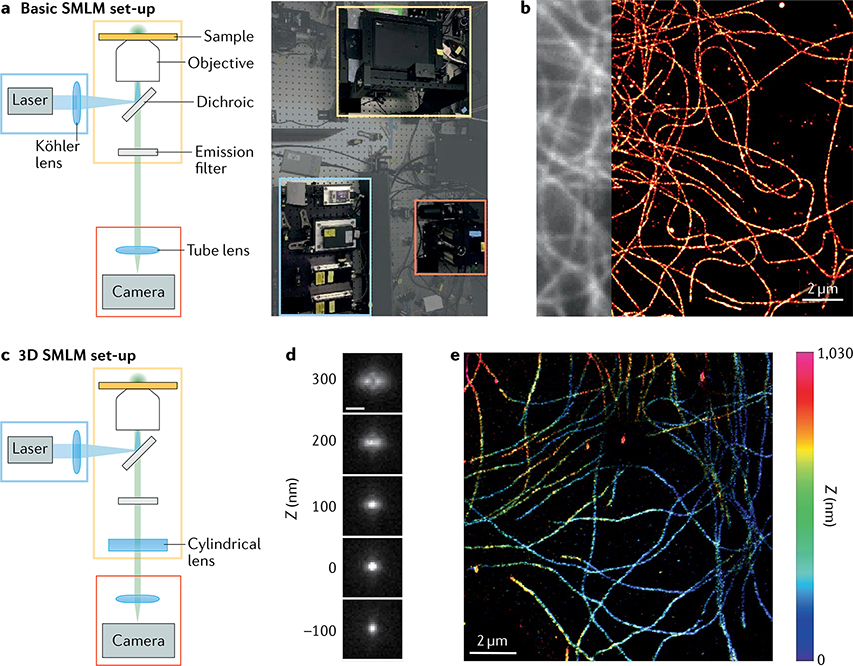
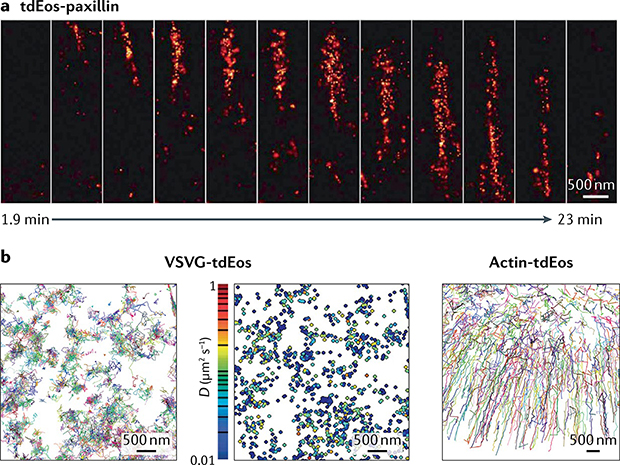
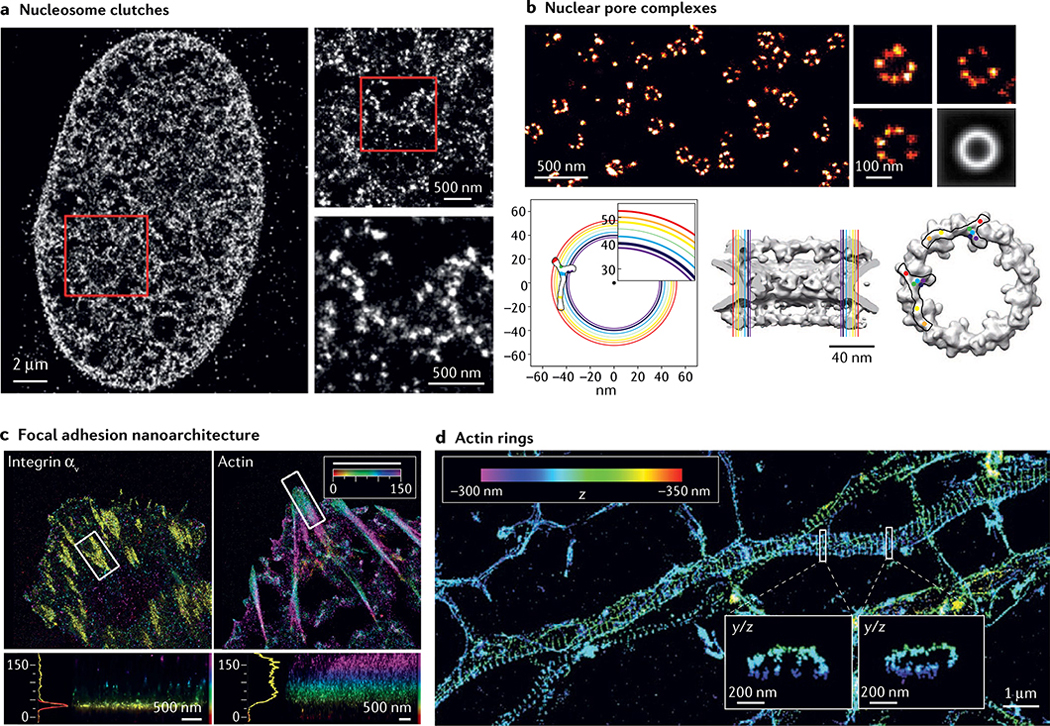
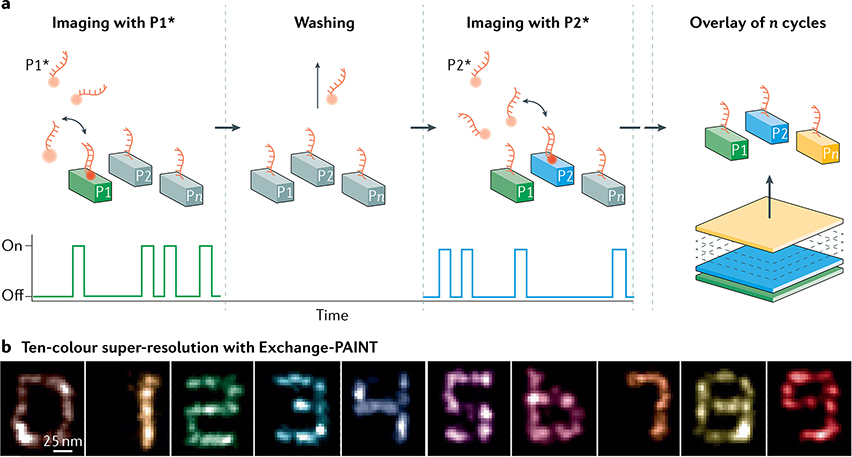
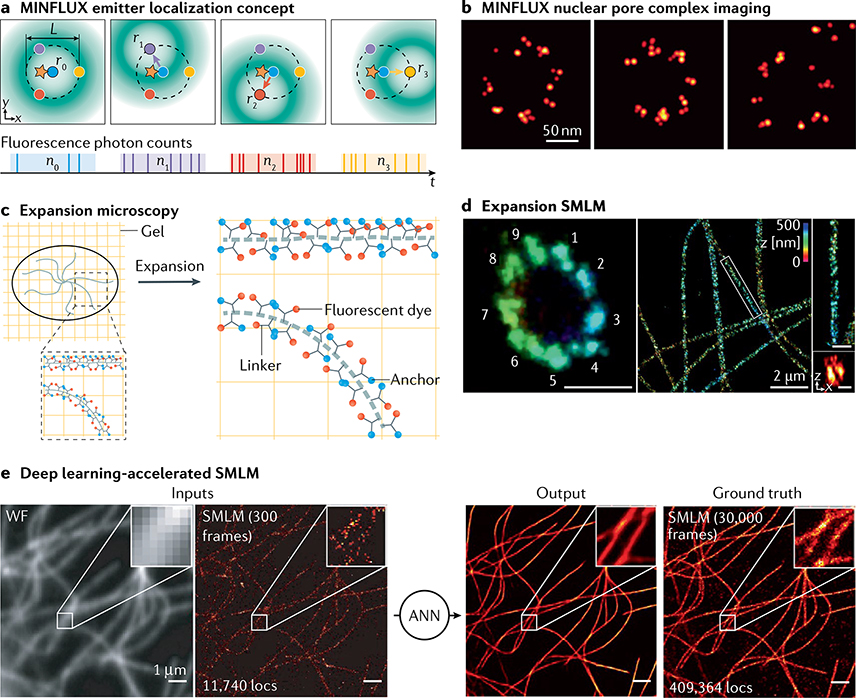
Single-molecule localization microscopy (SMLM) describes a family of powerful imaging techniques that dramatically improve spatial resolution over standard, diffraction-limited microscopy techniques and can image biological structures at the molecular scale. In SMLM, individual fluorescent molecules are computationally localized from diffraction-limited image sequences and the localizations are used to generate a super-resolution image or a time course of super-resolution images, or to define molecular trajectories. In this Primer, we introduce the basic principles of SMLM techniques before describing the main experimental considerations when performing SMLM, including fluorescent labelling, sample preparation, hardware requirements and image acquisition in fixed and live cells. We then explain how low-resolution image sequences are computationally processed to reconstruct super-resolution images and/or extract quantitative information, and highlight a selection of biological discoveries enabled by SMLM and closely related methods. We discuss some of the main limitations and potential artefacts of SMLM, as well as ways to alleviate them. Finally, we present an outlook on advanced techniques and promising new developments in the fast-evolving field of SMLM. We hope that this Primer will be a useful reference for both newcomers and practitioners of SMLM.


Conflict of interest statement

Competing interests R.J. is cofounder of Ultivue, Inc. and Massive Photonics GmbH. All other authors declare no competing interests.

Figures

Fig. 1 |
Fig. 1 |. Principle of single-molecule fluorescence microscopy.
a | A single fluorescent molecule (green dot) imaged through a microscope appears on the camera as a fuzzy spot ~200 nm wide known as the point spread function (PSF), which extends over multiple pixels. b | PSFs from simultaneously emitting molecules overlap if they are separated by a distance smaller than the PSF, blurring the structure. c | x and y coordinates of a single molecule (xm, ym) can be computed with high precision because subpixel displacements, here by 0.5 pixels in x and y, lead to predictable changes in pixel values, shown by the greyscale image (bottom) and corresponding 2D histogram (centre) (simulated data). The mesh surface (top) shows a Gaussian model of the PSF centred on (xm, ym). d | Higher photon counts (N) give a better signal to noise ratio and allow more precise localizations. Scatter plots show photon impacts on camera pixels. Pixel values in images on the right are photon counts. e | Single-molecule fluorescence microscopy (SMLM) usually exploits the fact that fluorophores stochastically switch between an active (‘ON’) state and one or more inactive (‘OFF’) states. f | An experimental, diffraction-limited image of nuclear pores, with all fluorophores ON. g | A sequence of diffraction-limited images of the same area as part f, where only few molecules are ON simultaneously. h,i | In each frame, single molecules are computationally detected (part h) and localized (part i). j | SMLM results in a localization table, where each row represents a distinct localization event and columns indicate x, y coordinates and additional information such as frame number and N. There are usually multiple localizations per frame, and the same molecule can be localized in multiple frames. k,l | Accumulated localizations can be visualized as a scatter plot (part k) or a 2D histogram (part l), with subpixel-sized bins. Raw image pixels are shown by the dashed grid, and bins are shown as a 10 × 10 grid inside a single pixel in part k). This ‘super-resolution’ image reveals the ring-like structure of nuclear pores. NPC, nuclear pore complex.
Fig. 2 |
Fig. 2 |. Fluorophore types and labelling strategies in single-molecule localization microscopy.
ae | Fluorophores compatible with single-molecule localization microscopy (SMLM) can be divided into five classes: photoswitchable (part a), photoactivatable (part b), photoconvertible (part c), spontaneously blinking (part d) or temporarily binding (part e), which includes the techniques of point accumulation in nanoscale topography (PAINT) and DNA-PAINT. Bullet points indicate types or properties of fluorophores in each class and an example fluorophore is shown. Activated fluorophores are shown as red dots, freely diffusing fluorophores as pale pink discs. f | Different fluorescent labelling approaches in order of decreasing linkage error (from left to right): immunolabelling with primary (1st) and secondary (2nd) antibodies (yellow); labelling with a small camelid antibody (nanobody, light green), often in combination with green fluorescent protein (dark green), as shown, or when available directly binding to the protein of interest (not shown); labelling with a protein tag or genetically encoded protein, such as Eos (orange); direct labelling with a dye-conjugated ligand (such as the microtubule-binding compound docetaxel in this example); and incorporation of unnatural amino acids such as TCO*-lysine through genetic code expansion, which enables rapid labelling using functionalized synthetic dyes. max, irradiation at the absorption maximum; λ shape, target structure imaged by SMLM.
Fig. 3 |
Fig. 3 |. Single-molecule localization microscopy hardware.
a | Basic single-molecule localization microscopy (SMLM) set-up consisting of an illumination source (here, a laser) and a Köhler lens (blue box), an objective lens and a stage for placing the sample (yellow box) and a detector with a tube lens and a camera (red box). Dichroic mirrors are used to separate excitation and emission wavelengths, and can be combined with additional emission filters to reject autofluorescence. b | 2D direct stochastic optical reconstruction microscopy (dSTORM) image of microtubules after secondary immunolabelling with Alexa-647-conjugated antibodies, obtained from 60,000 raw frames, with the corresponding wide-field image shown partially on the left. Estimated resolution (Fourier ring correlation) ≈44 nm. c | 3D SMLM system obtained simply by adding an optical component to engineer the point spread function (PSF), such as a cylindrical lens, which generates astigmatism (see BOX 3). d | Z-stack of a fluorescent bead showing the axial variations of an astigmatic PSF. Scale bar: 500 nm. e | 3D dSTORM image obtained by analysis of 2D single-molecule images, displayed here in two dimensions with colour indicating axial (Z) coordinates. PSF calibration and image reconstruction performed with ZOLA-3D (REF.). Part b courtesy of M. Singh.
Fig. 4 |
Fig. 4 |. Live-cell single-molecule localization microscopy.
a | Structural dynamics of a focal adhesion (tdEos-paxillin) reveals its appearance near the cell edge (top) before maturation and motion towards the interior (bottom). Each super-resolution image is reconstructed from 1,000 raw frames. b | Molecular dynamics of the vesicular stomatitis virus glycoprotein (VSVG-tdEos), a transmembrane protein freely diffusing on the plasma membrane. Motion of each protein traced over multiple frames, with different colours representing different molecules (left). Each trajectory can be analysed to create a map of diffusion coefficients (centre). By contrast, molecules within the actin cytoskeleton (actin-tdEos) show directed motion near the cell’s leading edge and diffusive motion towards the interior (right). D, diffusion coefficient. Part a reprinted from REF., Springer Nature Limited. Part b adapted from REF., Springer Nature Limited.
Fig. 5 |
Fig. 5 |. Major discoveries enabled by single-molecule localization microscopy.
a | Stochastic optical reconstruction microscopy (STORM) image of histone H2B in human fibroblast cells with progressively higher zoomed insets. b | Top: direct STORM (dSTORM) image of nuclear pore complexes (NPCs) labelled with antibodies to the nucleoporin Nup133. Three individual NPCs are shown on the right and an average image of 4,171 aligned NPCs on the lower right. Bottom left: coloured circles show radial positions of different nucleoporins in the plane of the nuclear envelope, determined from averaged dSTORM images, with the inferred position of the Y-shaped scaffold complex overlaid. Circle thickness reflects 95% confidence intervals of average radial distances. Bottom centre and bottom right: side and frontal views of the electron microscopy structure (grey), with the radial positions of nucleoporins shown in colour, and two positions of the Y complex consistent with the dSTORM data overlaid. c | Interferometric photoactivated localization microscopy (iPALM) image of a human U2OS cell expressing integrin αν-tdEos (left) and actin-mEos2 (right) with colour-coded zoomed insets of boxed regions. Colours represent the z position relative to the substrate (z = 0 nm). d | 3D STORM image of actin in a neuronal axon with zoomed y/z insets of boxed regions showing actin rings. Part a adapted with permission from REF., Elsevier. Part b reprinted with permission from REF., AAAS. Part c adapted from REF., Springer Nature Limited. Part d reprinted with permission from REF., AAAS.
Fig. 6 |
Fig. 6 |. Limitations of single-molecule localization microscopy techniques.
a | Single-molecule localization microscopy (SMLM) image of microtubules before and after drift correction. Arrows show a fluorescent bead used to estimate the drift. b,c | Artefacts caused by point spread function (PSF) overlaps in simulated images. Ground truth image without localization errors, shown as a scatter plot (part b, left). Corresponding SMLM image for a low density of activated fluorophores (10 localizations per square micrometre (locs μm−2), no PSF overlaps) (part b, middle). Corresponding SMLM image for a high activation density (50 locs μm−2); overlapping PSFs cause artefactual localizations near the intersection of filaments at the centre (part b, right). Simulated molecular clusters, with a 10-fold higher density for the top cluster (part c). Simulated ground truth shown as a scatter plot (part c, left). Corresponding SMLM image without filtering (part c, middle). Corresponding SMLM image after filtering out poor localizations caused by overlapping PSFs (part c, right). After filtering, the high-density cluster is barely visible. d | Artefacts in SMLM images of microtubules resulting from subpixel localization bias. Left: without bias. Right: with bias caused by using localization software with an incorrect PSF model. Because of the bias, the reconstructed image shows a grid pattern. Insets show the entire field of view. The localization bias is readily apparent in the histogram of x coordinates relative to the centre of camera pixels. Drift correction was not applied to these data to better highlight the effect of localization bias.
Fig. 7 |
Fig. 7 |. Multiplexed single-molecule localization microscopy with Exchange-PAINT.
a | Exchange-PAINT implements sequential imaging of multiple targets by DNA point accumulation in nanoscale topography (DNA-PAINT) with different imager strands labelled with the same dye. Sample is labelled with orthogonal docking strands P1, P2, Pn, before the first imager strand species P1* — complementary to docking strand P1 — is introduced and a DNA-PAINT image of P1 is acquired. Next, the P1* imager strands are washed out, imager strands P2* are introduced and a DNA-PAINT image of P2 is acquired. This goes on for n cycles. Each DNA-PAINT image is assigned a distinct pseudocolour and n images are then superposed. b | Pseudocolour DNA-PAINT images of origami structures displaying the digits 0–9. Part a reprinted from REF., Springer Nature Limited. Part b reprinted from REF., Springer Nature Limited.
Fig. 8 |
Fig. 8 |. New directions in single-molecule localization microscopy.
a | MINFLUX excitation concept for precisely probing emitter positions using minimal photon fluxes. A doughnut-shaped excitation beam (green) is moved sequentially to four probing positions r0, r1, r2 and r3 (coloured circles; probing range L) in the vicinity of a single fluorophore (orange star). If the doughnut centre coincides perfectly with the fluorophore position, no photons are emitted. The position of the fluorophore can be calculated with very high precision from the fluorescence photon counts (shown below). b | Example nuclear pore complexes imaged by MINFLUX. c | In expansion microscopy, samples are embedded in a gel that expands upon hydration. Immunolabelling of epitopes can be performed before or after gelation and expansion using linkers that bind to the gel and to a fluorescent dye. Full or partial protein digestion is commonly used to enable isotropic expansion. In order to enable direct stochastic optical reconstruction microscopy (dSTORM) imaging in photoswitching buffer, the sample is re-embedded in an uncharged polyacrylamide gel after expansion. d | Left: 3D post-labelling expansion dSTORM image of a 3.2× expanded and re-embedded sample showing 9-fold symmetry of the procentriole. Scale bar: 500 nm. Right: 3.1-fold expanded and re-embedded tubulin filaments, with magnified view of highlighted region. An xz side-view cross-section of a tubulin filament (bottom right) shows its hollow structure. Scale bars: 500 nm (vertical rectangle), 200 nm (small square). e | Deep learning accelerates single-molecule localization microscopy (SMLM) image acquisition (ANNAPALM). A wide-field image (WF) and a sparse SMLM image obtained from only 300 frames are fed as inputs to an artificial neural network (ANN) that was previously trained on high-quality (long acquisition) SMLM images of microtubules. The ANN outputs a super-resolution image that is in good agreement with an SMLM image obtained from 30,000 frames (‘ground truth’), suggesting that ANNAPALM can reduce the acquisition time 100-fold without compromising spatial resolution. Part a adapted with permission from REF., AAAS. Part b reprinted from REF., Springer Nature Limited. Part d adapted from REF., CC BY 4.0 (https://creativecommons.org/licenses/by/4.0/). Part e adapted from REF., Springer Nature Limited.

References

    1. Abbe E Beiträge zur Theorie des Mikroskops und der mikroskopischen Wahrnehmung [German]. Arch. für Mikroskopische Anatomie 9, 413–468 (1873).
    1. Schermelleh L et al. Super-resolution microscopy demystified. Nat. Cell Biol. 21, 72–84 (2019). - PubMed
    1. Donnert G et al. Macromolecular-scale resolution in biological fluorescence microscopy. Proc. Natl Acad. Sci. USA 103, 11440–11445 (2006). - PMC - PubMed
    1. Gustafsson MGL Surpassing the lateral resolution limit by a factor of two using structured illumination microscopy. J. Microsc. 198, 82–87 (2000). - PubMed
    1. Heintzmann R, Jovin TM & Cremer C Saturated patterned excitation microscopy — a concept for optical resolution improvement. J. Opt. Soc. Am. A Opt Image Sci. Vis. 19, 1599–1609 (2002). - PubMed

LinkOut - more resources