. 2022 Mar:167:107367.
doi: 10.1016/j.csda.2021.107367. Epub 2021 Oct 8.

A study of longitudinal trends in time-frequency transformations of EEG data during a learning experiment

Affiliations

A study of longitudinal trends in time-frequency transformations of EEG data during a learning experiment

Joanna Boland et al. Comput Stat Data Anal. 2022 Mar.

Abstract

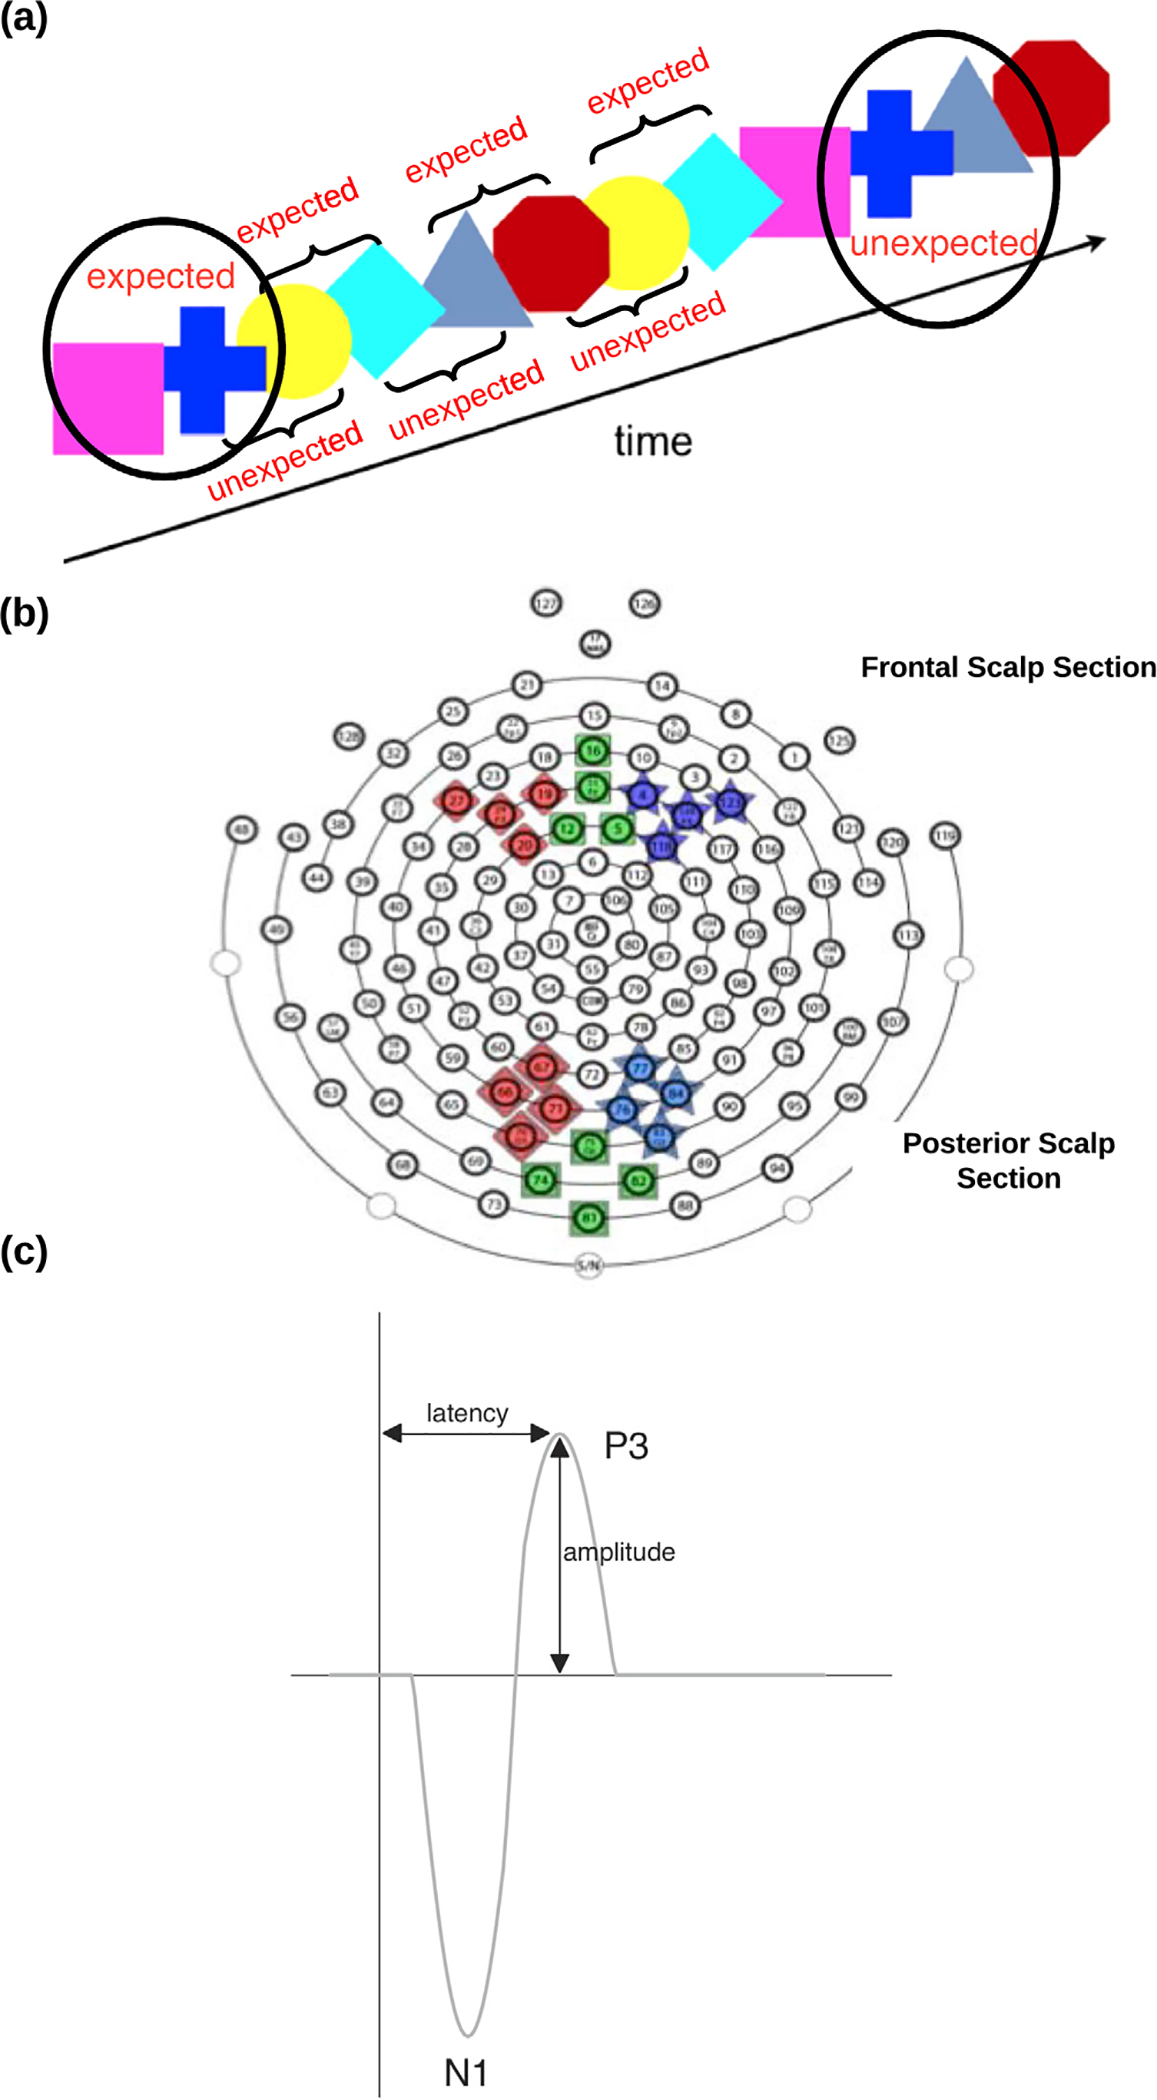
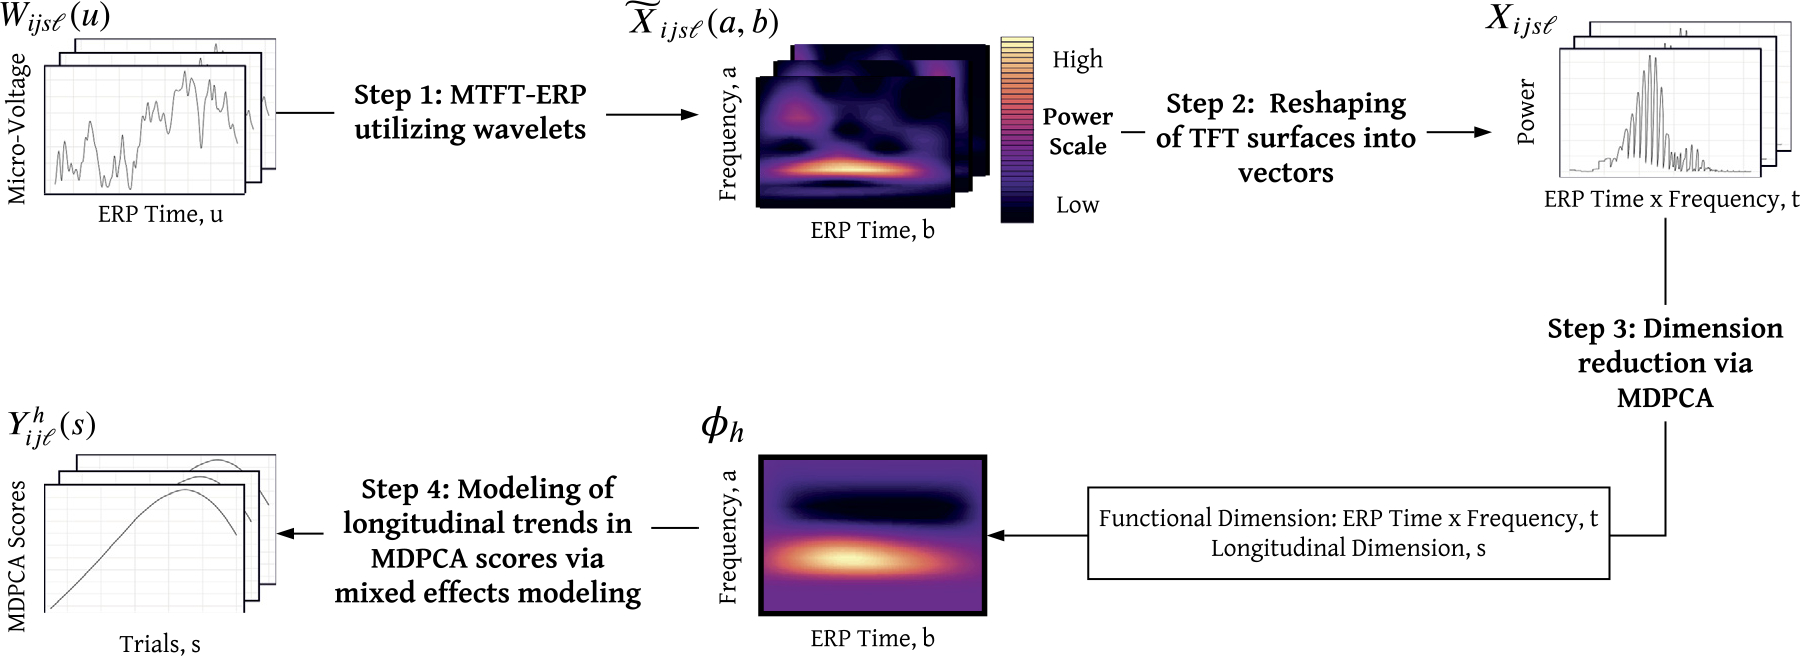
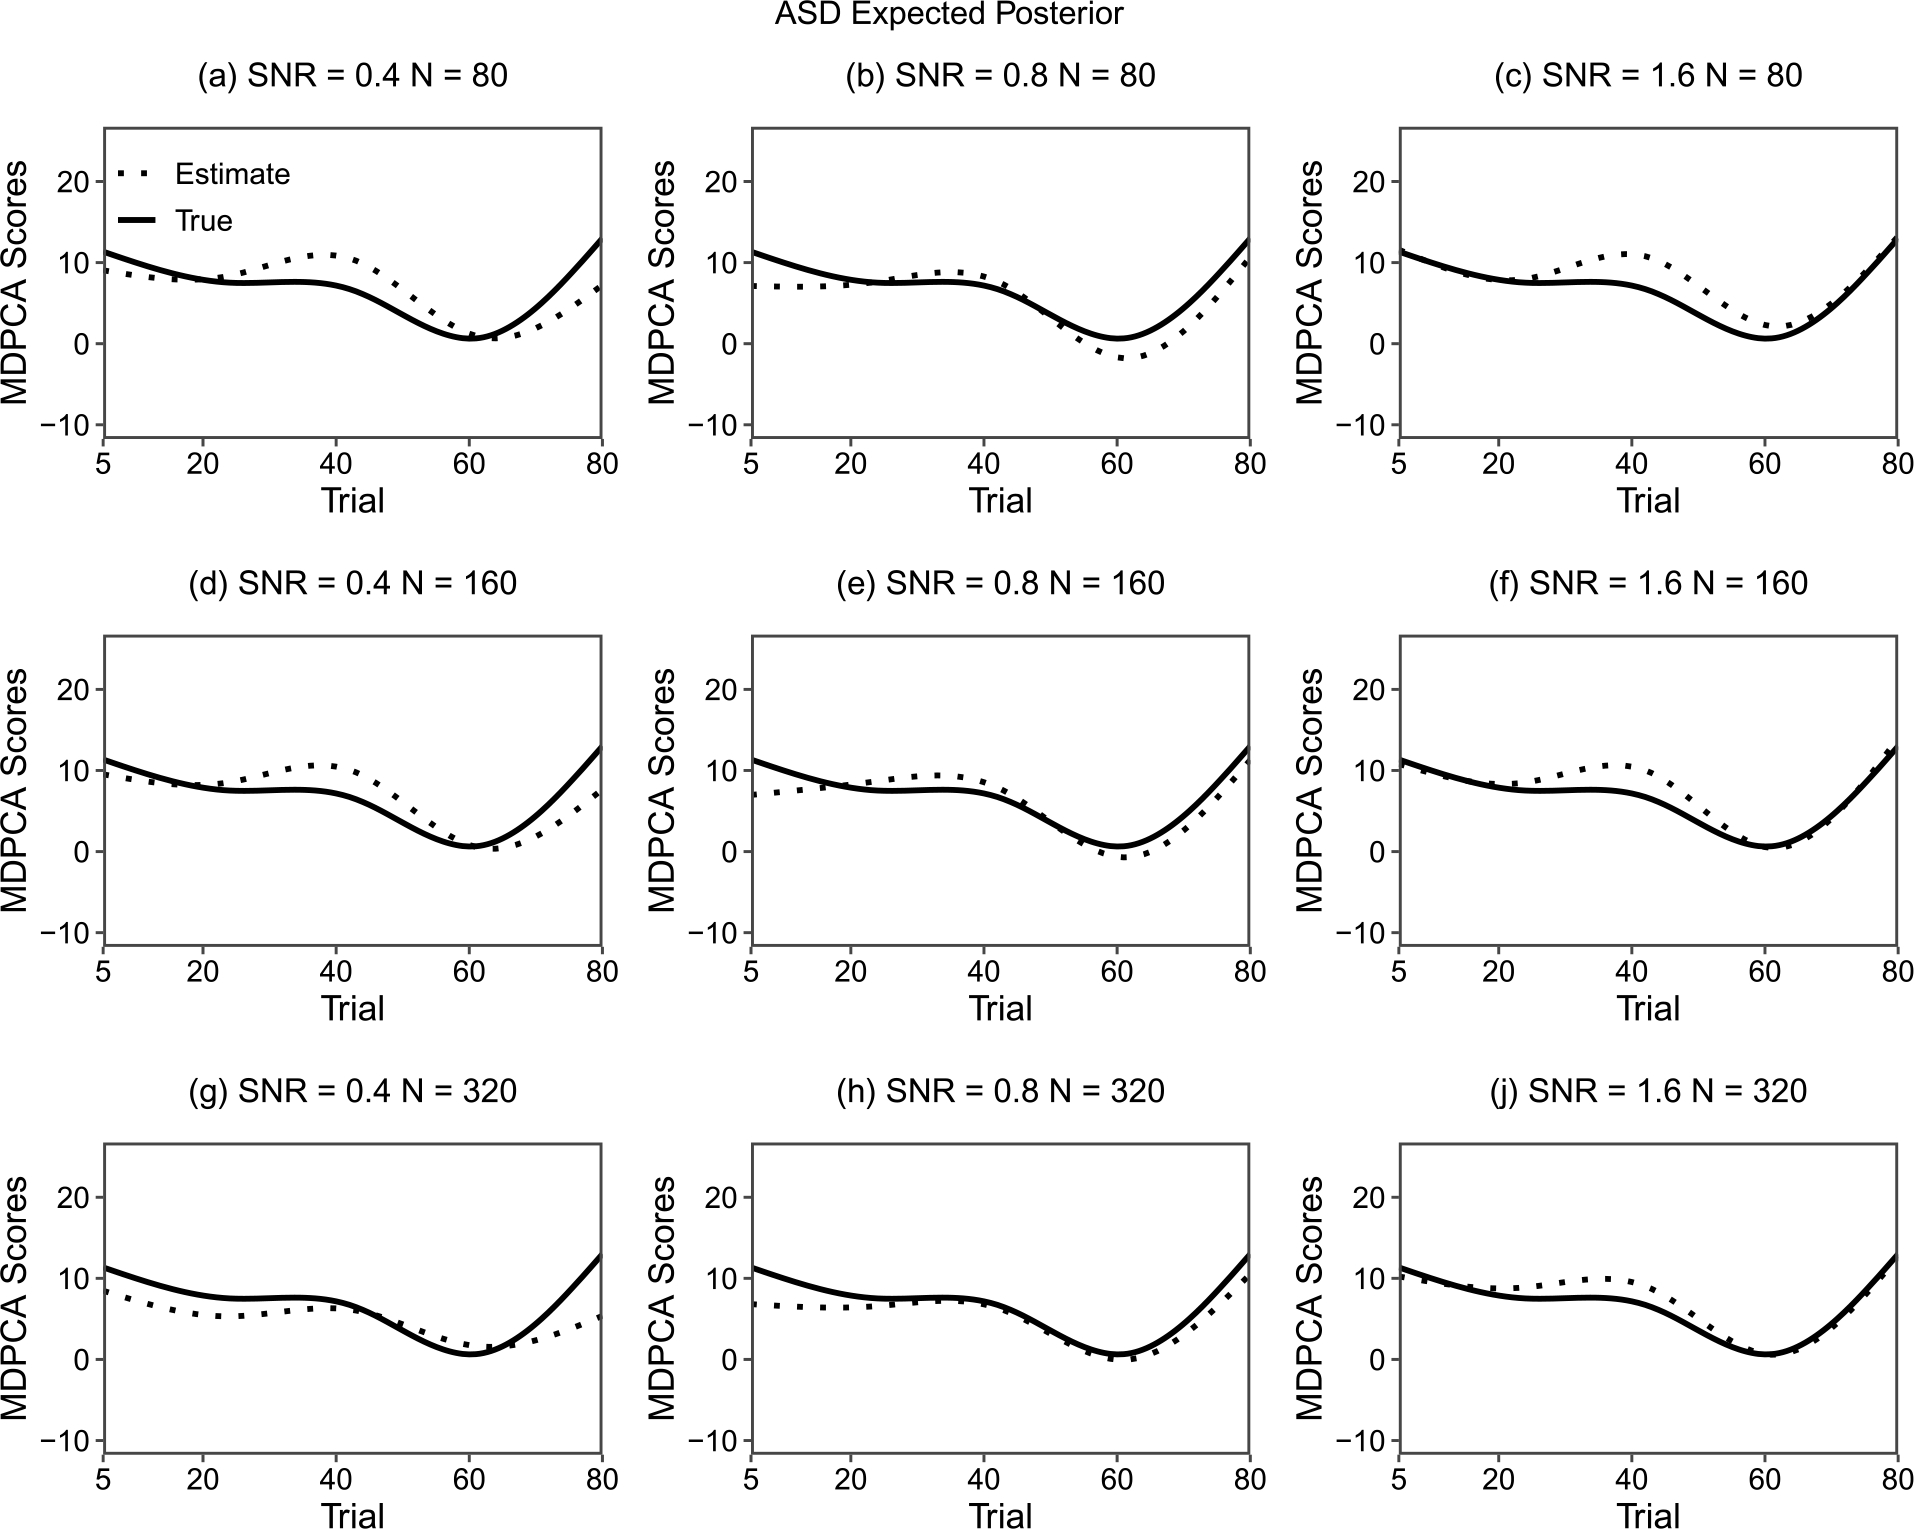
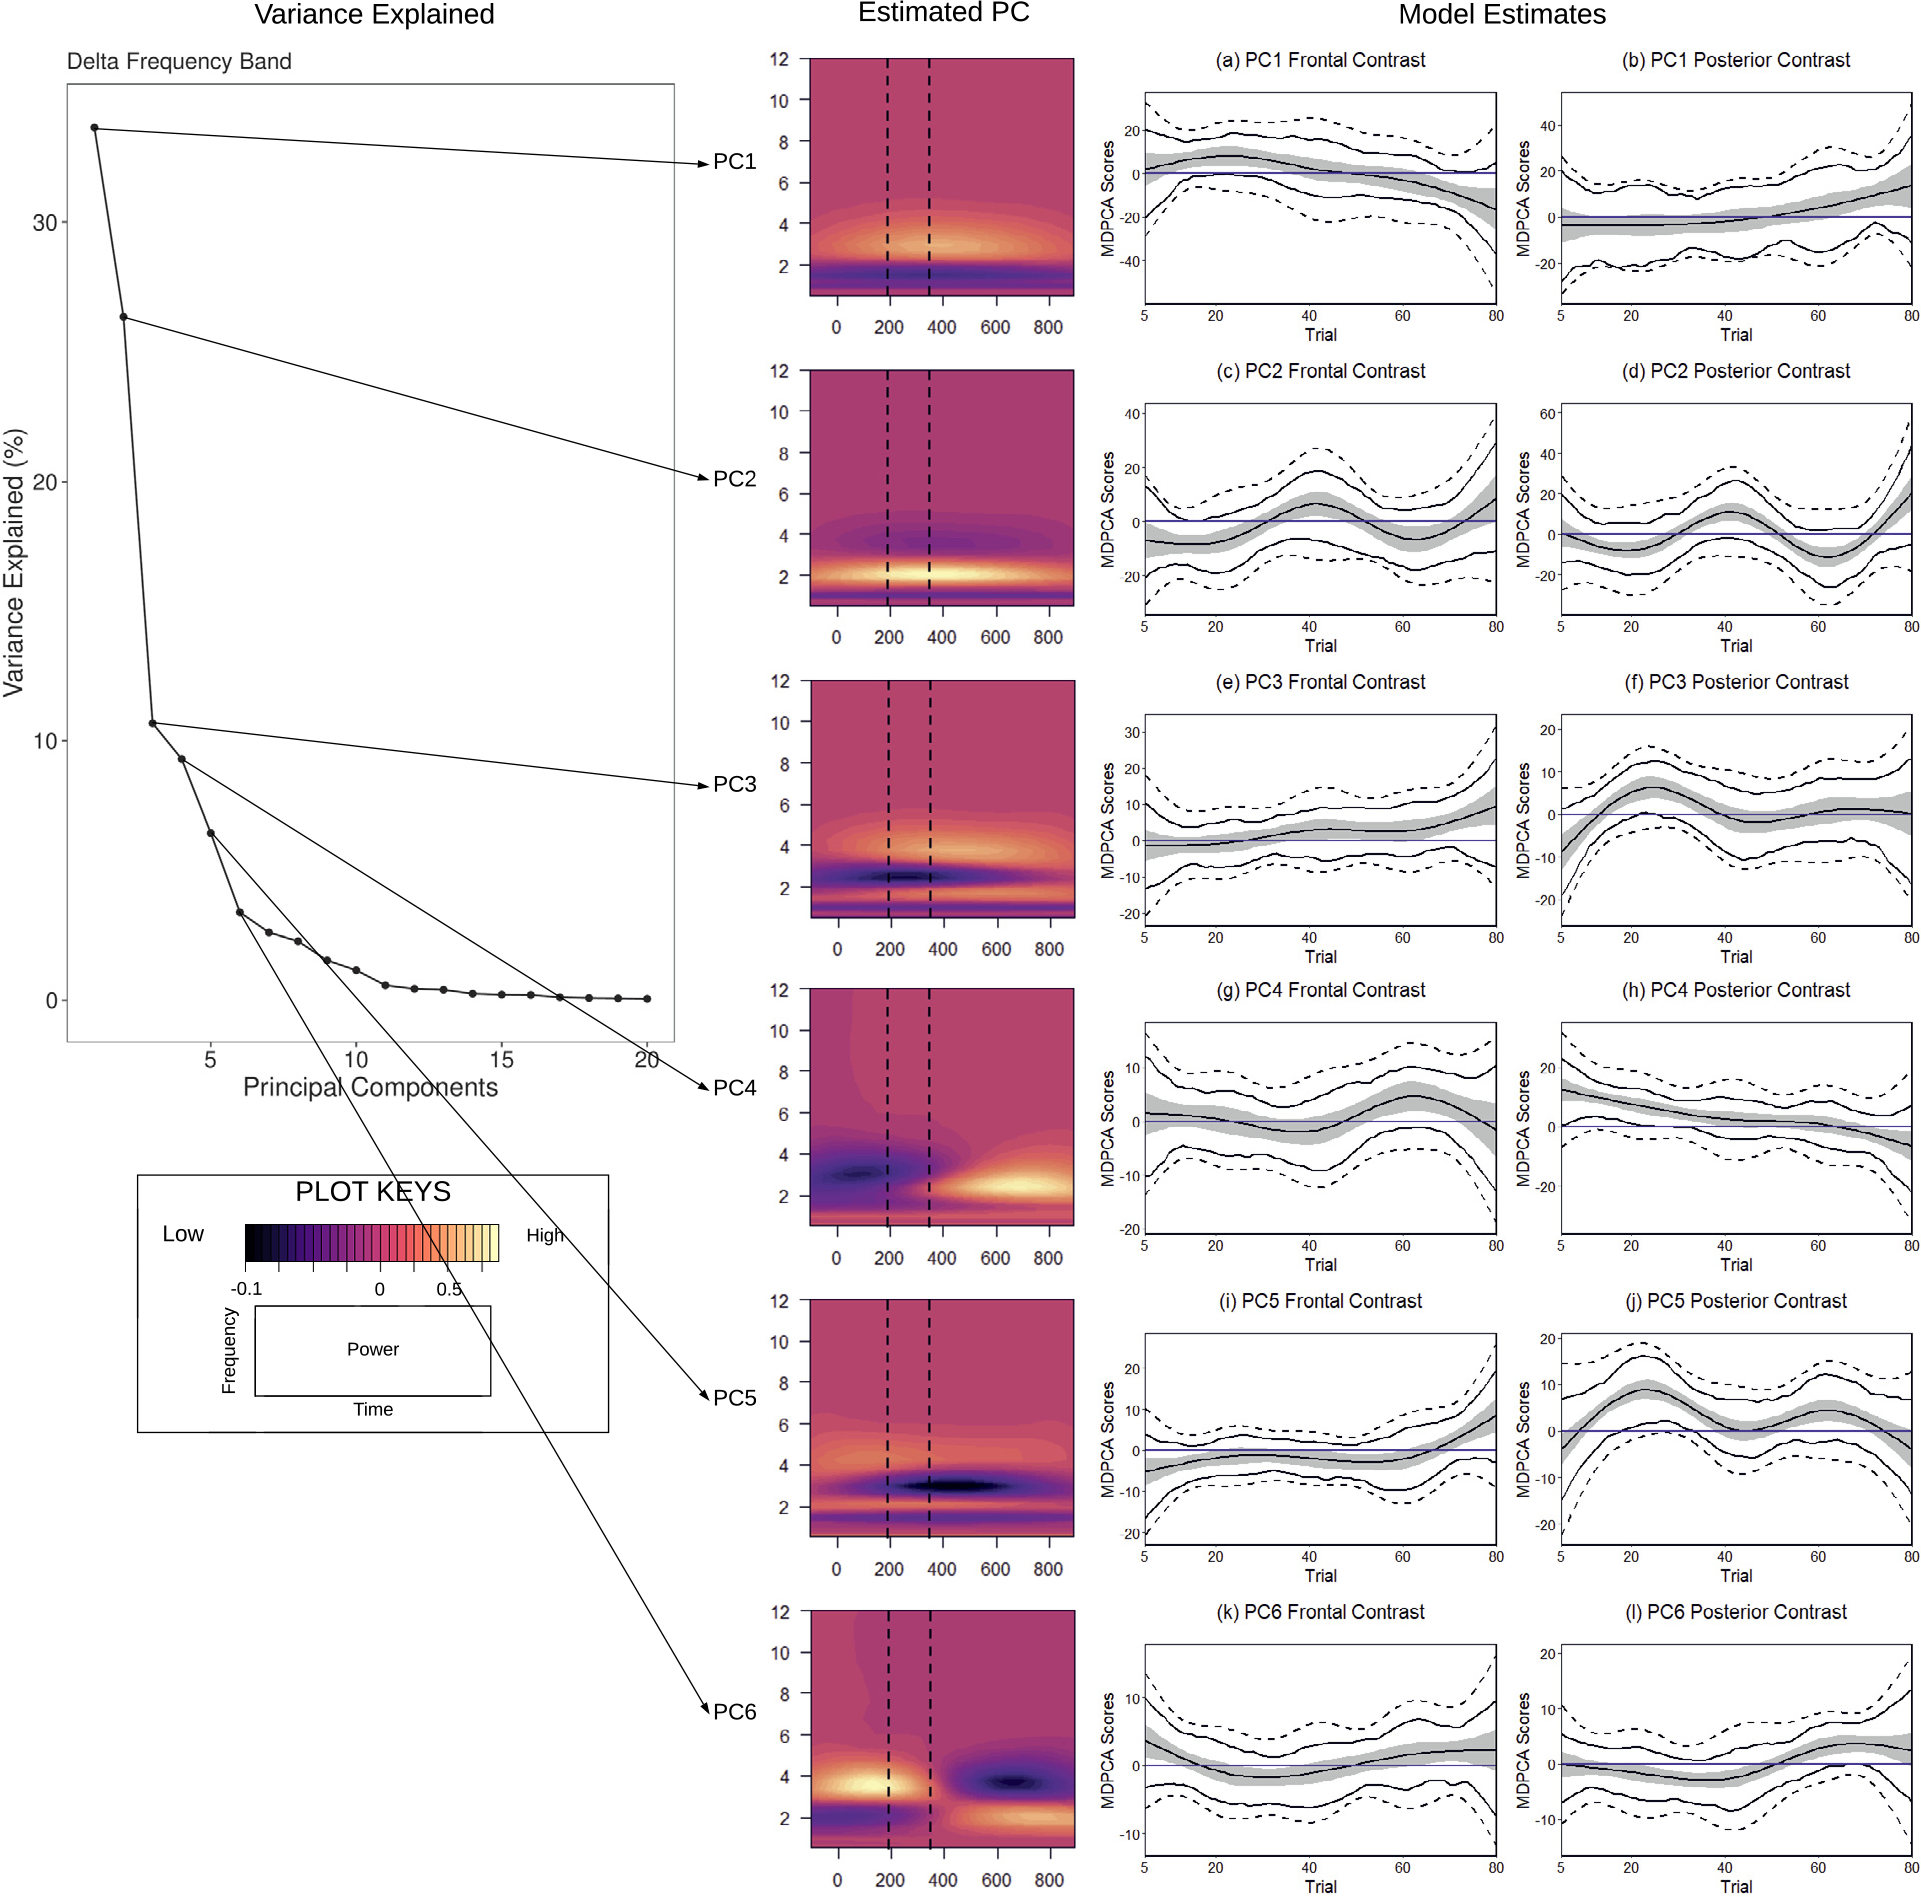
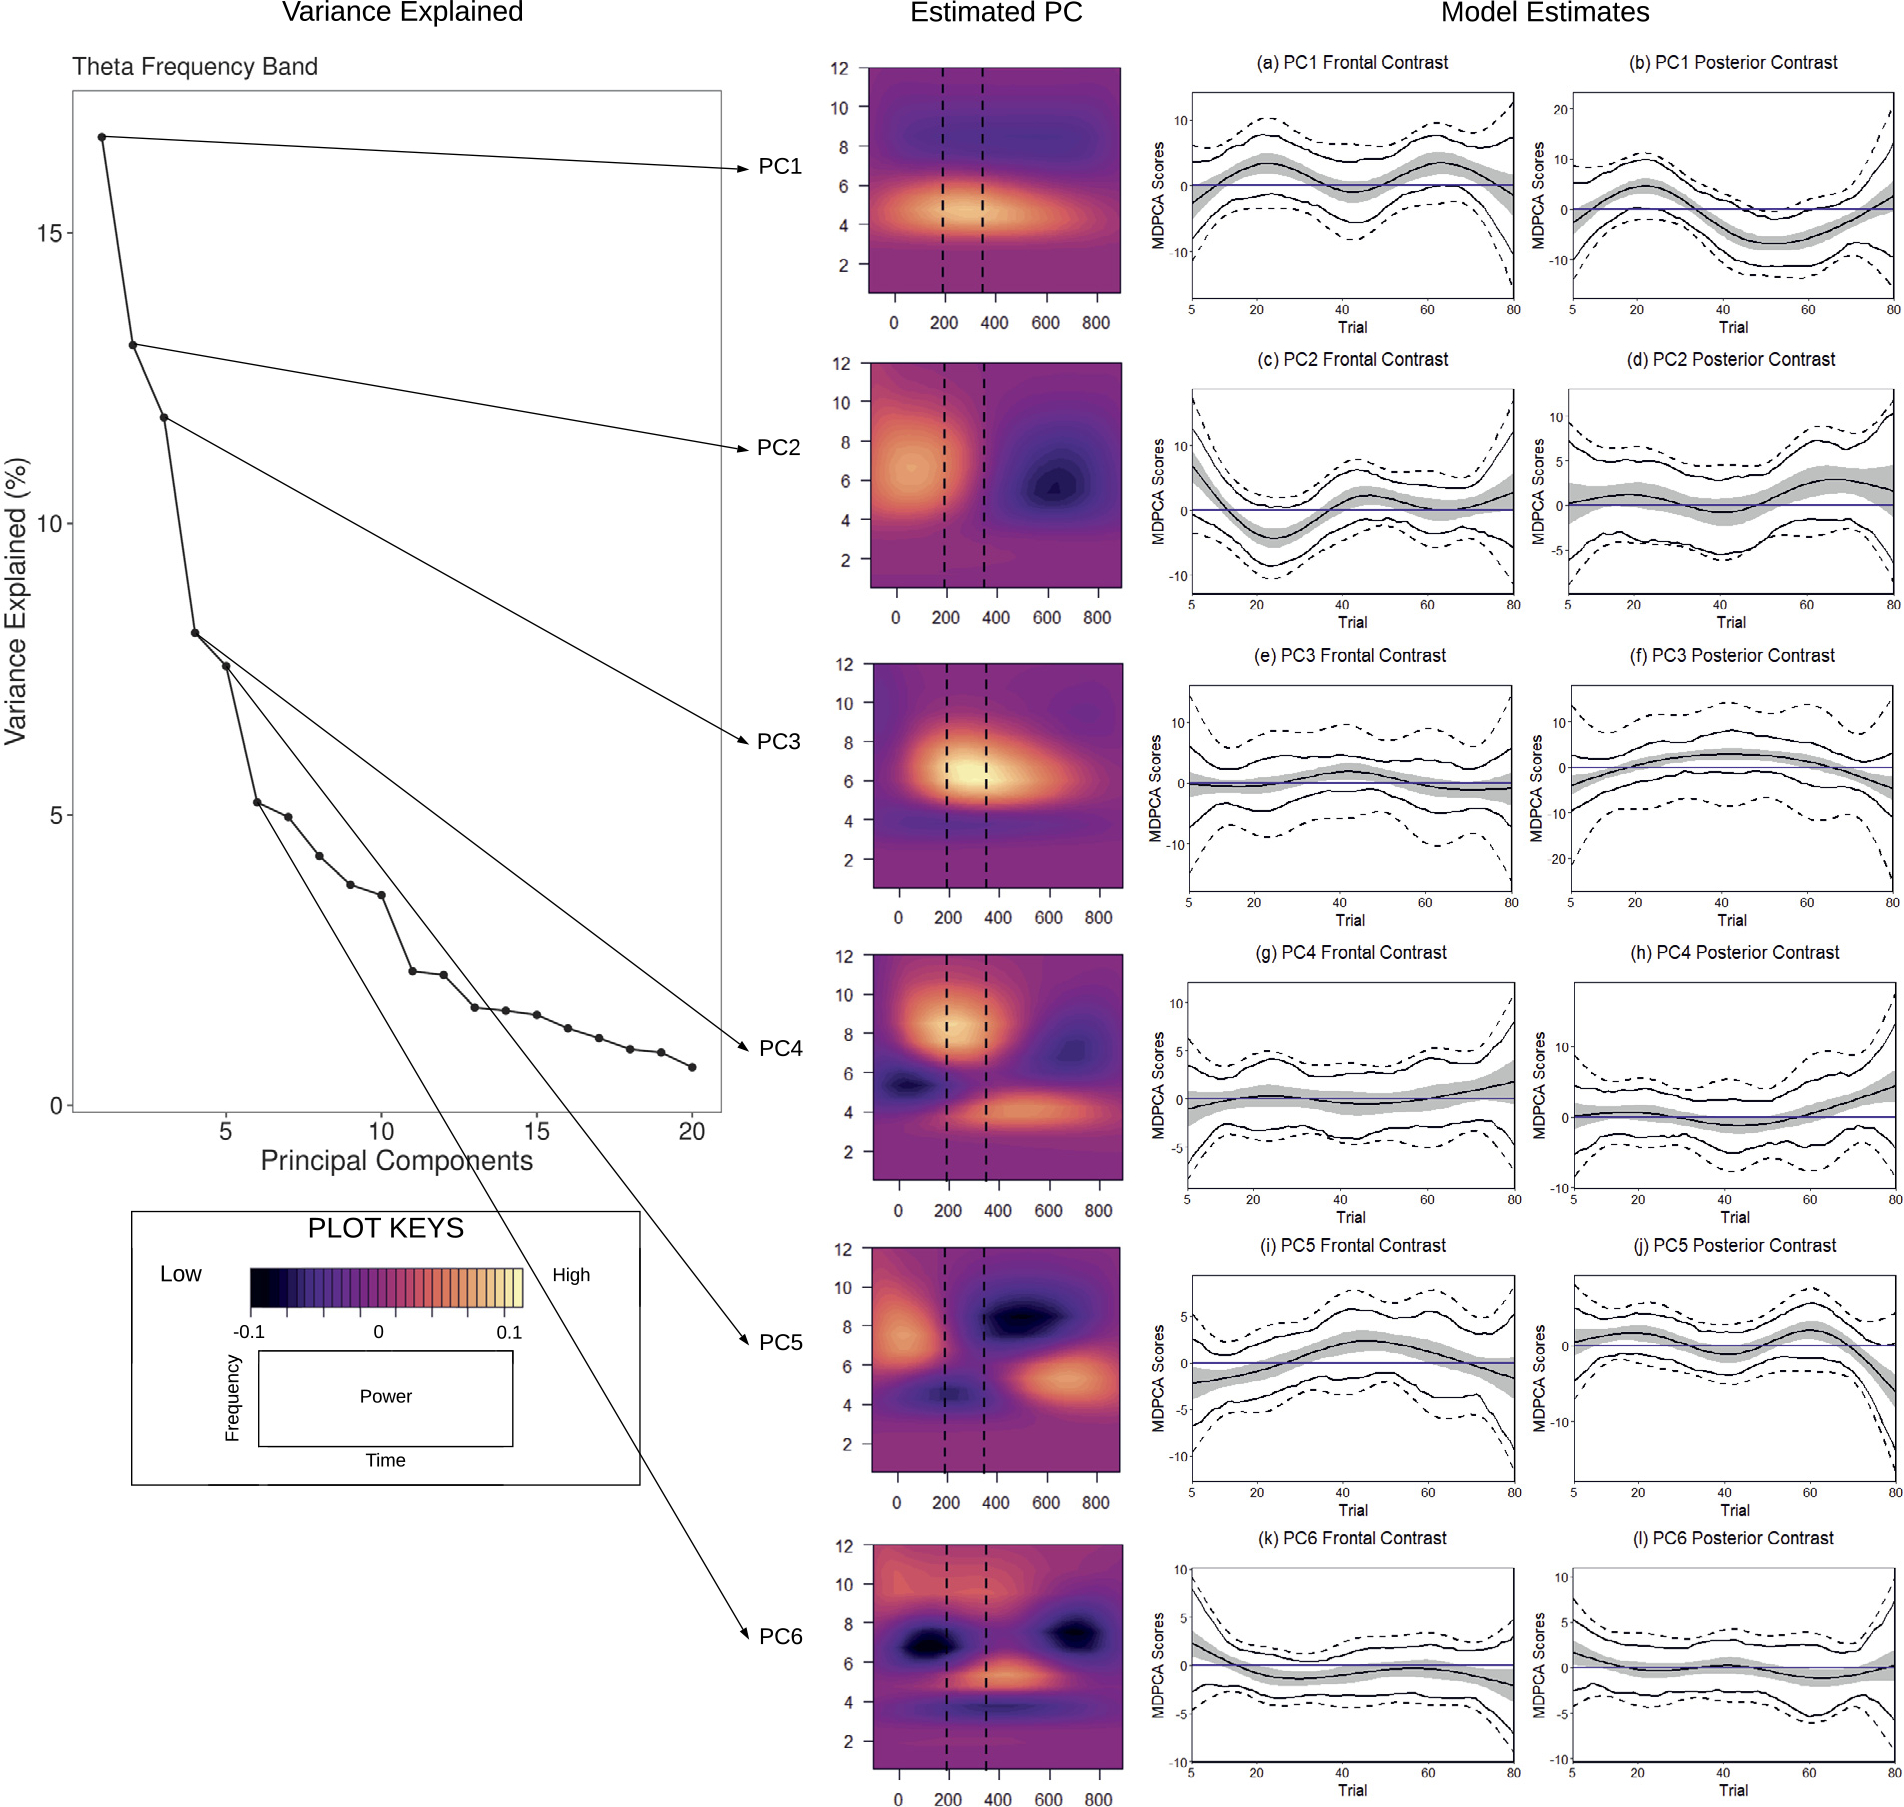
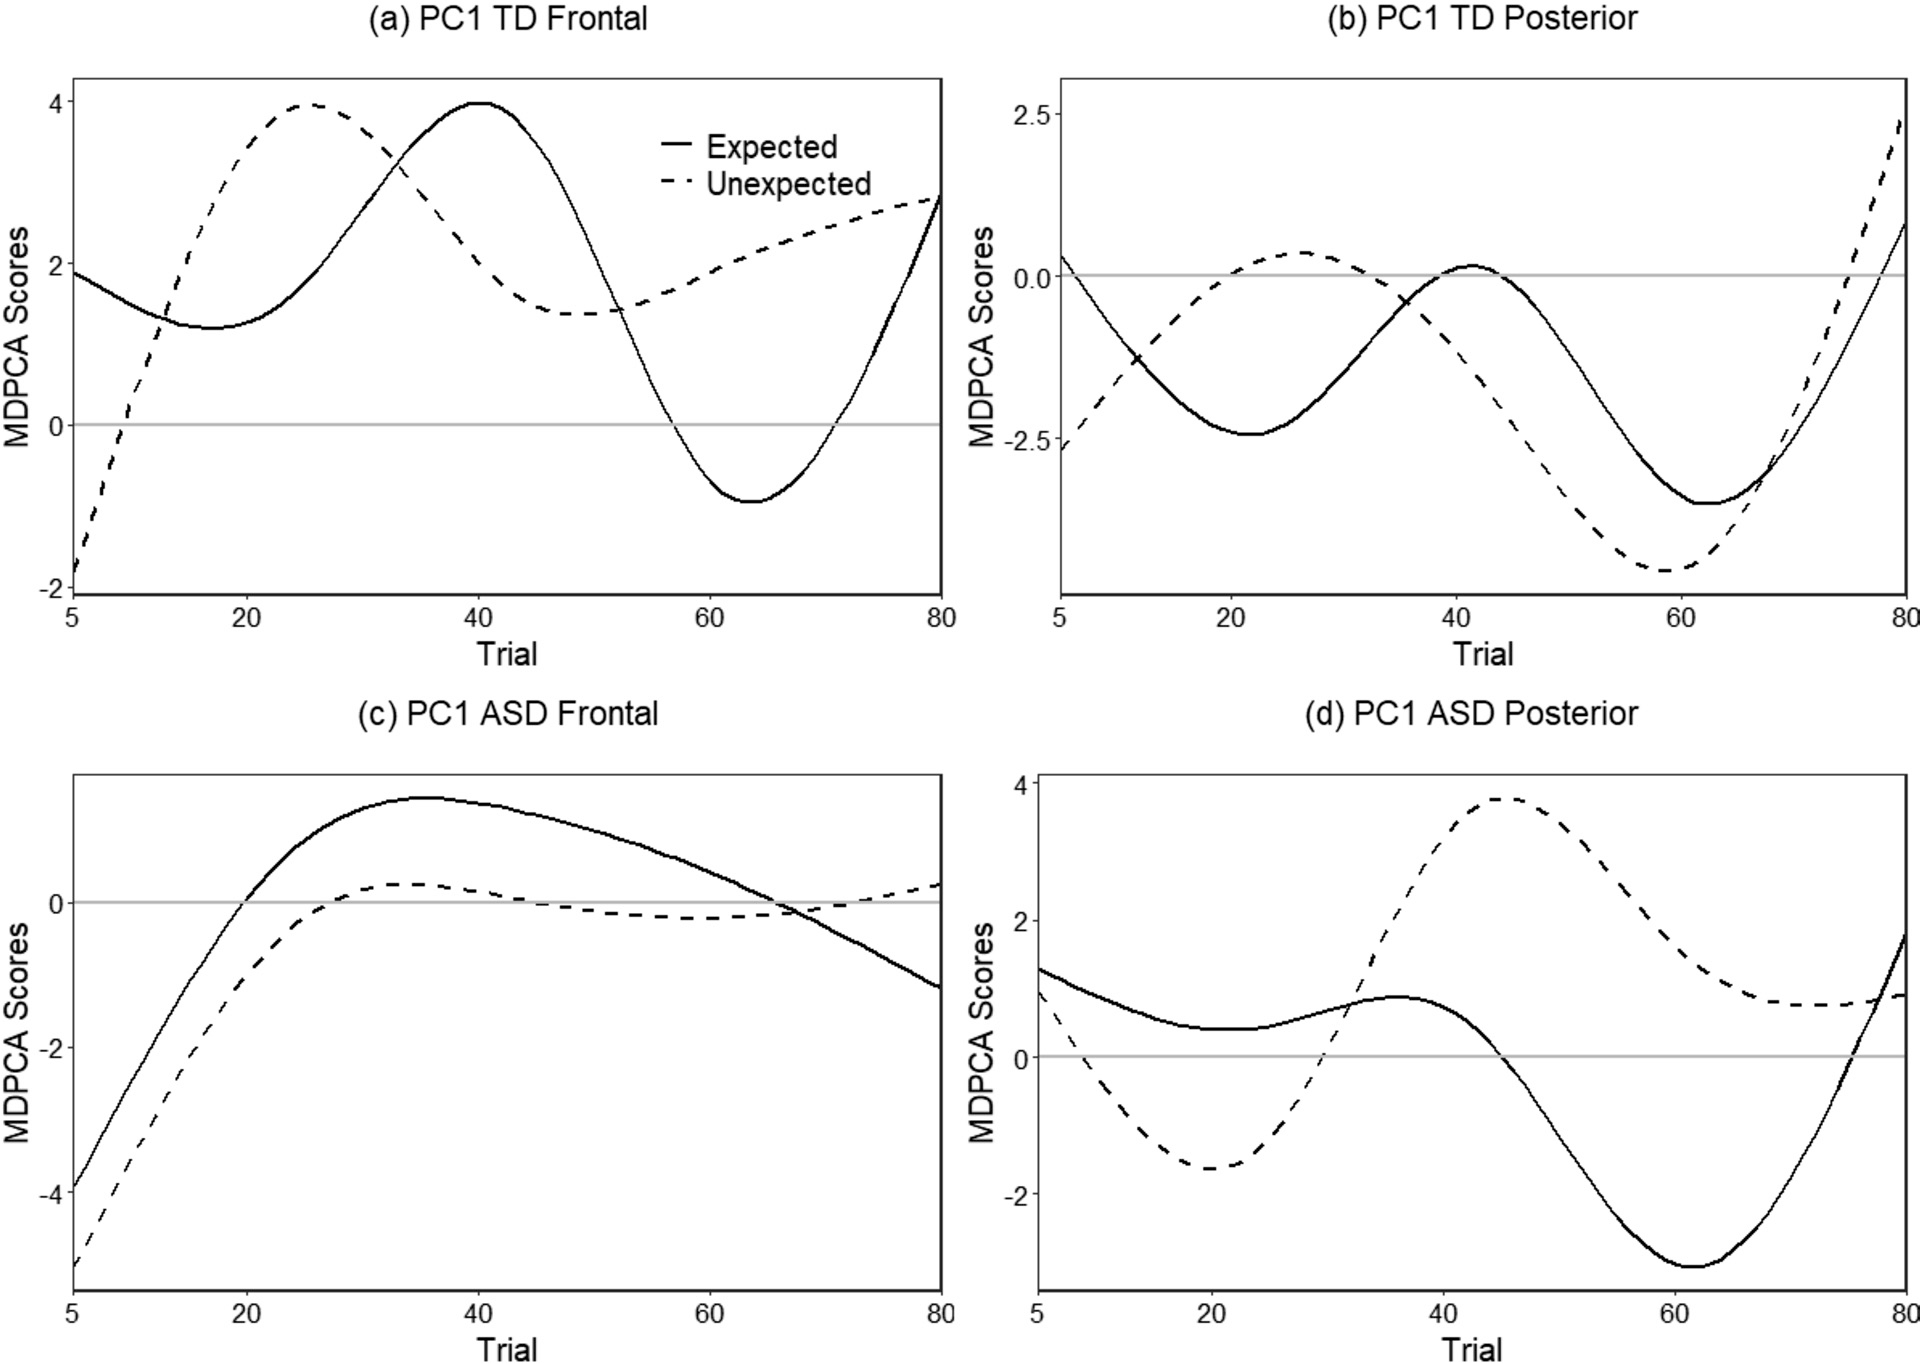
EEG experiments yield high-dimensional event-related potential (ERP) data in response to repeatedly presented stimuli throughout the experiment. Changes in the high-dimensional ERP signal throughout the duration of an experiment (longitudinally) is the main quantity of interest in learning paradigms, where they represent the learning dynamics. Typical analysis, which can be performed in the time or the frequency domain, average the ERP waveform across all trials, leading to the loss of the potentially valuable longitudinal information in the data. Longitudinal time-frequency transformation of ERP (LTFT-ERP) is proposed to retain information from both the time and frequency domains, offering distinct but complementary information on the underlying cognitive processes evoked, while still retaining the longitudinal dynamics in the ERP waveforms. LTFT-ERP begins by time-frequency transformations of the ERP data, collected across subjects, electrodes, conditions and trials throughout the duration of the experiment, followed by a data driven multidimensional principal components analysis (PCA) approach for dimension reduction. Following projection of the data onto leading directions of variation in the time and frequency domains, longitudinal learning dynamics are modeled within a mixed effects modeling framework. Applications to a learning paradigm in autism depict distinct learning patterns throughout the experiment among children diagnosed with Autism Spectrum Disorder and their typically developing peers. LTFT-ERP time-frequency joint transformations are shown to bring an additional level of specificity to interpretations of the longitudinal learning patterns related to underlying cognitive processes, which is lacking in single domain analysis (in the time or the frequency domain only). Simulation studies show the efficacy of the proposed methodology.

Keywords: Event-related potentials; Longitudinal functional data analysis; Mixed effects models; Multidimensional PCA; Wavelets.


Figures

Fig. 1.
Fig. 1.
(a) Visualization of the implicit learning paradigm. The continuous stream of six-colored shapes are organized into three familiar pairs. The “expected” condition is defined as the transition between shapes within a shape pair, and the “unexpected” condition is defined as the transition between shape pairs. (b) The 24 electrodes of interest analyzed in the implicit learning paradigm in six total scalp regions (each containing four electrodes) within two scalp sections (frontal and posterior). (c) A depiction of the ERP phasic components P3 and N1 in the implicit learning paradigm.
Fig. 2.
Fig. 2.
A flowchart of the LTFT-ERP algorithm. For each subject i, electrode j, on trial s and condition ℓ Step 1 transforms the ERP waveform Wijj(u) into the TFT power surface X˜ijs(a,b) using the wavelet transformation. Step 2 reshapes the TFT power surface X˜ijs(a,b) into a vector xijs in t where t denotes the functional dimension of ERP time × frequency. The longitudinal dimension is trials s, where Step 3 performs dimension reduction via MDPCA to target the hth leading eigenvector φh in the functional dimension. The final step models the MDPCA scores as a function of trials (s) via mixed effects modeling.
Fig. 3.
Fig. 3.
True (solid) and estimated (dotted) fixed effects mean trajectories from the run with the median ME value for the MDPCA scores of the subgroup ASD expected posterior, at varying SNRs (rows) and sample sizes (columns).
Fig. 4.
Fig. 4.
Summary of results from the proposed LTFT-ERP algorithm from the delta frequency band. The six estimated leading functional eigenvectors and their corresponding percent of variance explained are depicted. Contrasts for ((ASD expected - ASD unexpected) - (TD expected - TD unexpected)), based on the mixed effects modeling of the MDPCA scores, are also depicted. The contrasts and the associated 95% pointwise and simultaneous bootstrap intervals, based on resampling from subjects with replacement, are given in solid black and dashed black, respectively, while the 95% pointwise confidence intervals based on the mixed effects modeling are shaded in gray. A blue horizontal line at zero is included for ease of interpretation.
Fig. 5.
Fig. 5.
Summary of results from the proposed LTFT-ERP algorithm from the theta frequency band. The six estimated leading functional eigenvectors and their corresponding percent of variance explained are depicted. Contrasts for ((ASD expected - ASD unexpected) - (TD expected - TD unexpected)), based on the mixed effects modeling of the MDPCA scores, are also depicted. The contrasts and the associated 95% pointwise and simultaneous bootstrap intervals, based on resampling from subjects with replacement, are given in solid black and dashed black, respectively, while the 95% pointwise confidence intervals based on the mixed effects modeling are shaded in gray. A blue horizontal line at zero is included for ease of interpretation.
Fig. 6.
Fig. 6.
Estimated mean trajectories of the MDPCA scores for the leading first eigencomponent in the theta frequency band for each group, scalp section, and condition (expected solid and unexpected dashed). A gray horizontal line at zero is included for ease of interpretation.

References

    1. Bernat EM, Williams WJ, Gehring WJ, 2005. Decomposing ERP time-frequency energy using PCA. Clin. Neurophysiol. 116 (6), 1314–1334. 10.1016/j.clinph.2005.01.019. - DOI - PubMed
    1. Bernat EM, Malone SM, Williams WJ, Patrick CJ, Iacono WG, 2007. Decomposing delta, theta, and alpha time-frequency ERP activity from a visual oddball task using PCA. Int. J. Psychophysiol. 64 (1), 62–74. 10.1016/j.ijpsycho.2006.07.015. - DOI - PMC - PubMed
    1. Bugli C, Lambert P, 2006. Functional ANOVA with random functional effects: an application to event-related potentials modelling for electroencephalograms analysis. Stat. Med. 25 (21), 3718–3739. 10.1002/sim.2464. - DOI - PubMed
    1. Chen K, Müller HG, 2012. Modeling repeated functional observations. J. Am. Stat. Assoc. 107 (500), 1599–1609. 10.1080/01621459.2012.734196. - DOI
    1. Chen K, Delicado P, Müller HG, 2017. Modelling function-valued stochastic processes, with applications to fertility dynamics. J. R. Stat. Soc., Ser. B, Stat. Methodol. 79 (1), 177–196. 10.1111/rssb.12160. - DOI