. 2022 May 18:13:878342.
doi: 10.3389/fmicb.2022.878342. eCollection 2022.

Epidemiologic and Genomic Analysis of the Severe Acute Respiratory Syndrome Coronavirus 2 Epidemic in the Nebraska Region of the United States, March 2020-2021

Affiliations

Epidemiologic and Genomic Analysis of the Severe Acute Respiratory Syndrome Coronavirus 2 Epidemic in the Nebraska Region of the United States, March 2020-2021

Jacob A Siedlik et al. Front Microbiol. .

Abstract

COVID-19 emerged at varying intervals in different regions of the United States in 2020. This report details the epidemiologic and genetic evolution of Severe acute respiratory syndrome coronavirus 2 (SARS-CoV-2) during the first year of the epidemic in the state of Nebraska using data collected from the Creighton Catholic Health Initiatives (CHI) health system. Statistical modelling identified age, gender, and previous history of diabetes and/or stroke as significant risk factors associated with mortality in COVID-19 patients. In parallel, the viral genomes of over 1,000 samples were sequenced. The overall rate of viral variation in the population was 0.07 mutations/day. Genetically, the first 9 months of the outbreak, which include the initial outbreak, a small surge in August and a major outbreak in November 2020 were primarily characterized by B.1. lineage viruses. In early 2021, the United Kingdom variant (B.1.1.7 or alpha) quickly became the dominant variant. Notably, surveillance of non-consensus variants detected B.1.1.7 defining mutations months earlier in Fall 2020. This work provides insights into the regional variance and evolution of SARS-CoV-2 in the Nebraska region during the first year of the pandemic.

Keywords: COVID-19; SARS-CoV-2; epidemiology; genetic variation; sequencing; viral evolution.


Conflict of interest statement

The authors declare that the research was conducted in the absence of any commercial or financial relationships that could be construed as a potential conflict of interest.

Figures

Figure 1
Figure 1
Nebraska COVID-19 cases and fatalities March 2020–March 2021. (A) Cases per day and total cases in Nebraska during study period as reported by NE DHHS. (B) Number of monthly positive cases reported by NE DHHS and number of monthly cases in the Catholic Health Initiatives (CHI) dataset used in this study. (C) Number of monthly fatalities due to COVID-19 in Nebraska reported by the CDC and number of monthly fatalities in the CHI dataset used in this study.
Figure 2
Figure 2
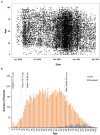
Age Distribution of patients analyzed in clinical outcomes study. (A) Scatterplot of positive COVID-19 test dates by age in the CHI dataset. (B) Histogram plot of all the patients in the data set. Survivors are plotted in orange bars and those that died with blue bars.
Figure 3
Figure 3
Regression analysis of preexisting conditions associated with mortality in COVID-19 positive patients. (A) The deceased population shows an increased tendency toward diabetes and to a lesser extent history of stroke. (B) Logistic regression output. Test/Train model has 88% predictive probability.
Figure 4
Figure 4
COVID-19 fatality and diabetes. (A) Histogram plot of the ages of diabetic COVID-19 patients in dataset. Survivors are plotted with red bars and those that died with green bars. (B) Age distribution of deceased patients bifurcating non-diabetic and diabetic patients.
Figure 5
Figure 5
Study sampling for genome sequencing. (A) Histogram of the number of positive nasal-pharyngeal severe acute respiratory syndrome coronavirus 2 (SARS-CoV-2) positive samples collected during the study period. (B) Histogram of the number of samples sequenced during the study period. The bin depth for both histograms is 10 days.
Figure 6
Figure 6
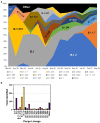
Distribution of PANGO lineages of NE samples. (A) Monthly frequency distribution of the PANGO lineages of the most prevalent lineages observed among sequenced samples. (B) Summary graph of the total number of samples observed from March 2020–March 2021 of indicated PANGO lineages.
Figure 7
Figure 7
Severe acute respiratory syndrome coronavirus 2 variation. Plot shows a heat map of genomic variation relative to the Wuhan-Hu-1 reference genome. Areas of low and high variation are shown as blue and red, respectively. Plot is overlayed with individual dots that denote the locations of high-quality variants (both consensus and minor variants) identified in all sequenced samples as a function of time (y axis). For reference, a to-scale map of the genome is shown below with known proteins labeled. Nsp, nonstructural protein.
Figure 8
Figure 8
Characteristics of SARS-CoV-2 variation in samples. (A) Overall distribution of the number of variants identified in each sample shown as violin plots. Total includes all variants in the dataset, major and minor are defined by frequency ≥0.6 and <0.6, respectively. (B,C) The frequency SARS-CoV-2 variants in samples over time. Plots show the total number of major (b, frequency ≥ 0.6) and minor (c, frequency < 0.6) variants identified in samples from March 1, 2020 to March 31, 2021.
Figure 9
Figure 9
Location of SARS-CoV-2 variation identified in samples. Histograms shows the number of high-quality major (A) and minor (B) variants identified at each genomic position in all the patient samples sequenced. Position location is relative to the Wuhan-Hu-1 reference genome. (A) To-scale map of the genome is shown below with known proteins labeled. Nsp, nonstructural protein.
Figure 10
Figure 10
Tracking of B.1.1.7 mutations. Frequency of B.1.1.7 variants identified in the patient samples beginning from January 1, 2020.

References

    1. Alpert T., Brito A. F., Lasek-Nesselquist E., Rothman J., Valesano A. L., MacKay M. J., et al. . (2021). Early introductions and transmission of SARS-CoV-2 variant B.1.1.7 in the United States. Cell 184, 2595–2604.e13. doi: 10.1016/j.cell.2021.03.061, PMID: - DOI - PMC - PubMed
    1. Alteri C., Cento V., Piralla A., Costabile V., Tallarita M., Colagrossi L., et al. . (2021). Genomic epidemiology of SARS-CoV-2 reveals multiple lineages and early spread of SARS-CoV-2 infections in Lombardy, Italy. Nat. Commun. 12:434. doi: 10.1038/s41467-020-20688-x, PMID: - DOI - PMC - PubMed
    1. Betti M., Bertolotti M., Ferrante D., Roveta A., Pelazza C., Giacchero F., et al. . (2021). Baseline clinical characteristics and prognostic factors in hospitalized COVID-19 patients aged </= 65 years: a retrospective observational study. PLoS One 16:e0248829. doi: 10.1371/journal.pone.0248829, PMID: - DOI - PMC - PubMed
    1. CDC (2021). National Diabetes Statistics Report Website [Online]. Centers for Disease Control and Prevention. Available at: https://www.cdc.gov/diabetes/data/statistics-report/index.html (Accessed December 12, 2021).
    1. Chan J. F.-W., Kok K.-H., Zhu Z., Chu H., To K. K.-W., Yuan S., et al. . (2020). Genomic characterization of the 2019 novel human-pathogenic coronavirus isolated from a patient with atypical pneumonia after visiting Wuhan. Emerg. Microb. Infect. 9, 221–236. doi: 10.1080/22221751.2020.1719902, PMID: - DOI - PMC - PubMed