. 2022 May 19:13:881535.
doi: 10.3389/fmicb.2022.881535. eCollection 2022.

Genome-Wide Mutant Screening in Yeast Reveals that the Cell Wall is a First Shield to Discriminate Light From Heavy Lanthanides

Affiliations

Genome-Wide Mutant Screening in Yeast Reveals that the Cell Wall is a First Shield to Discriminate Light From Heavy Lanthanides

Nicolas Grosjean et al. Front Microbiol. .

Abstract

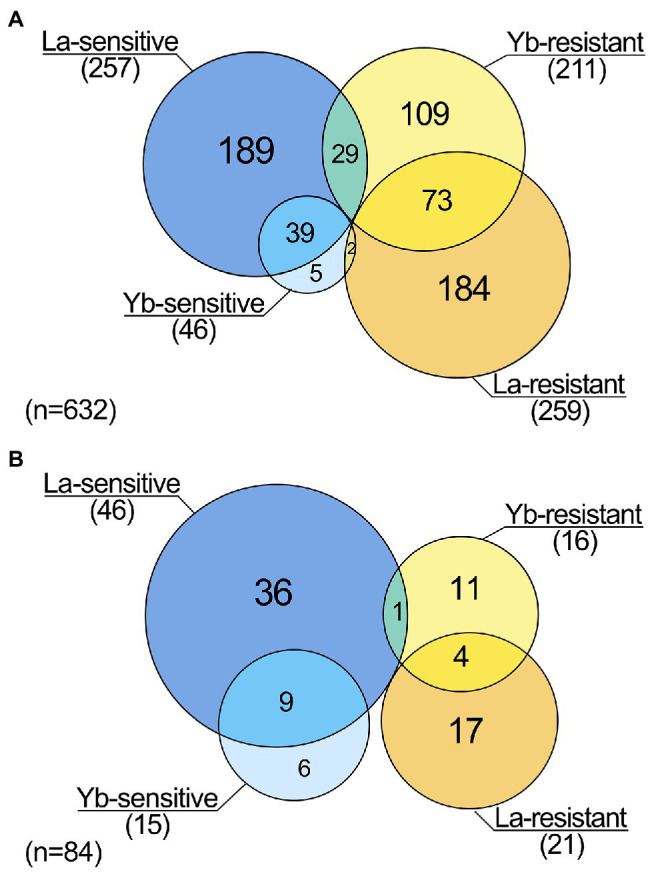
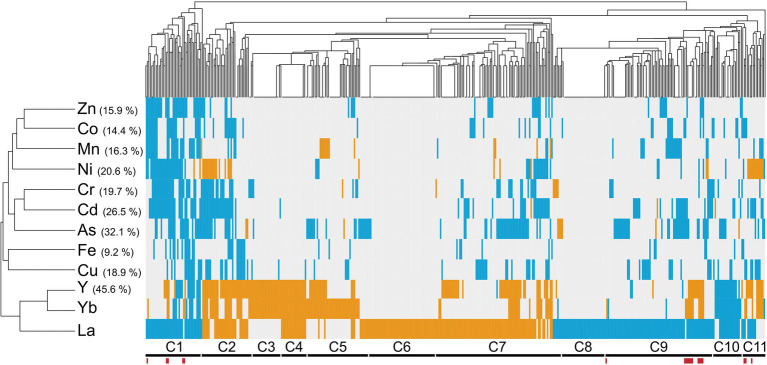
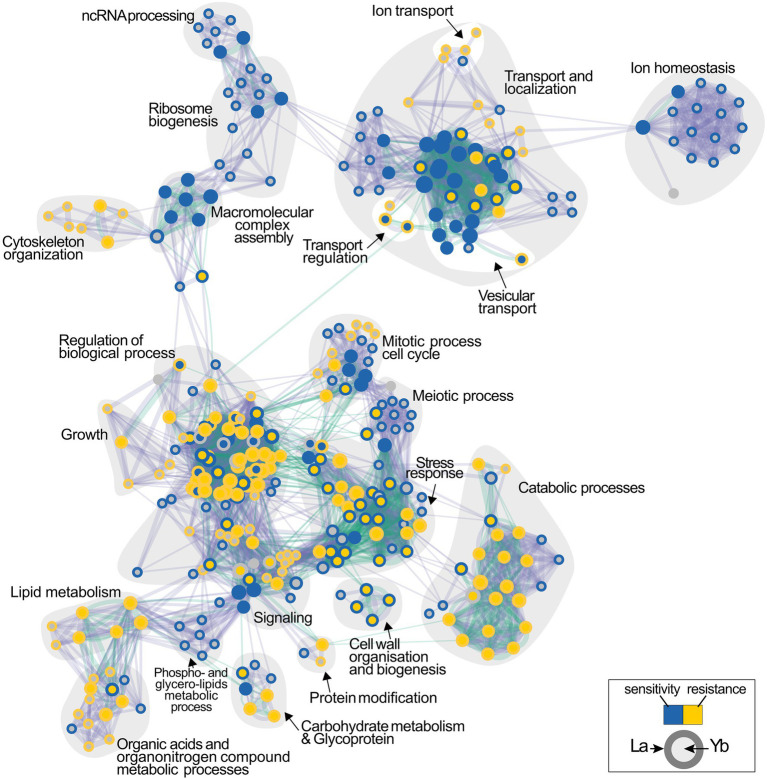
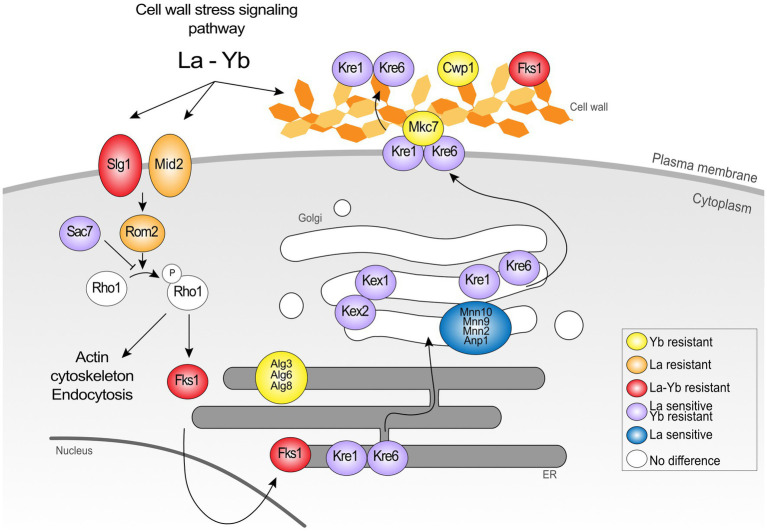
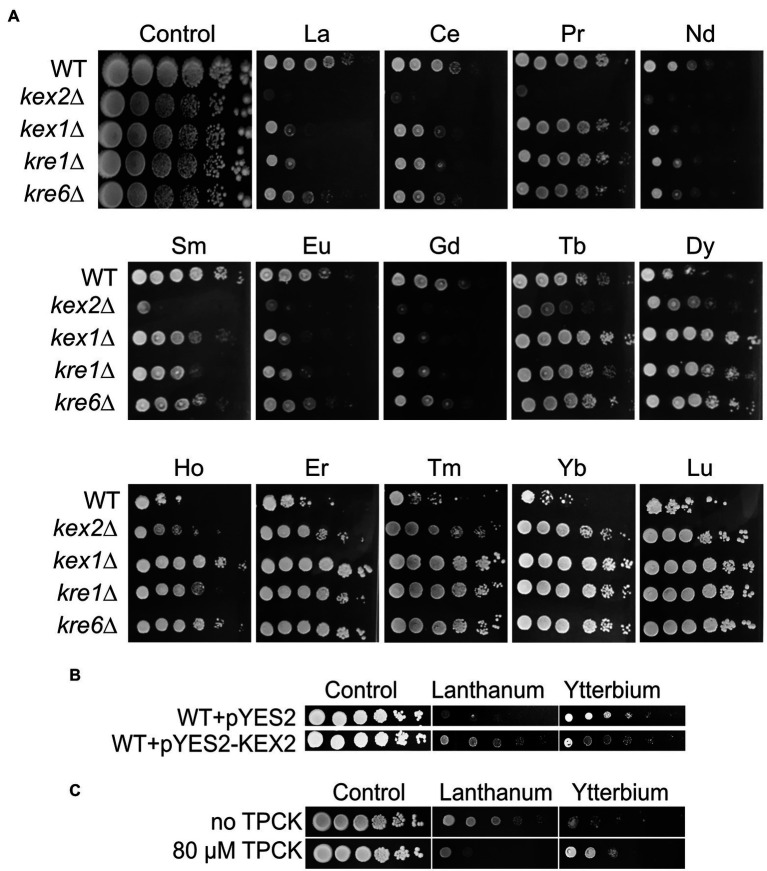
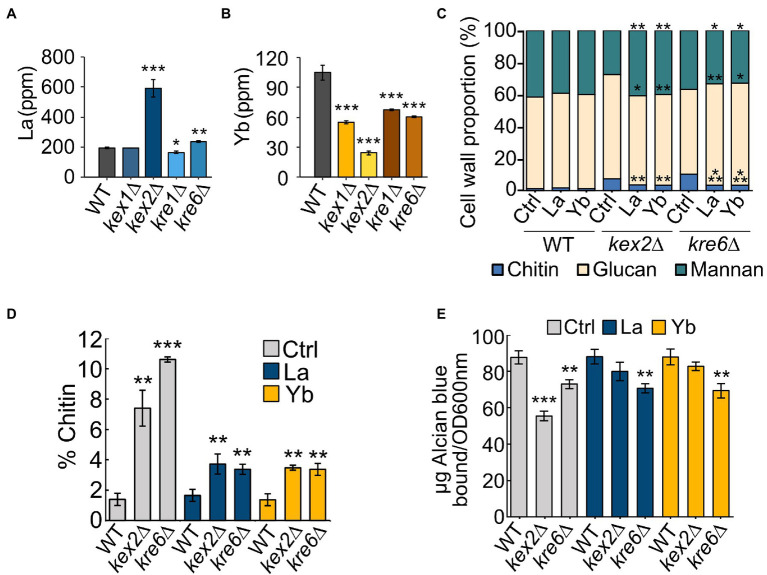
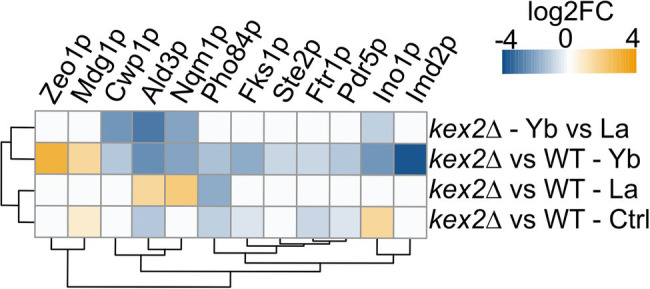
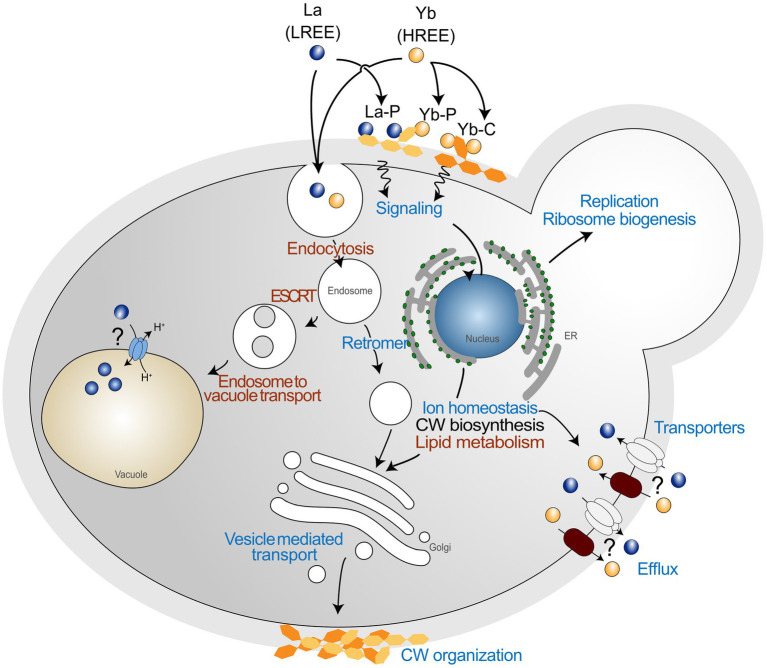
The rapidly expanding utilization of lanthanides (Ln) for the development of new technologies, green energies, and agriculture has raised concerns regarding their impacts on the environment and human health. The absence of characterization of the underlying cellular and molecular mechanisms regarding their toxicity is a caveat in the apprehension of their environmental impacts. We performed genomic phenotyping and molecular physiology analyses of Saccharomyces cerevisiae mutants exposed to La and Yb to uncover genes and pathways affecting Ln resistance and toxicity. Ln responses strongly differed from well-known transition metal and from common responses mediated by oxidative compounds. Shared response pathways to La and Yb exposure were associated to lipid metabolism, ion homeostasis, vesicular trafficking, and endocytosis, which represents a putative way of entry for Ln. Cell wall organization and related signaling pathways allowed for the discrimination of light and heavy Ln. Mutants in cell wall integrity-related proteins (e.g., Kre1p, Kre6p) or in the activation of secretory pathway and cell wall proteins (e.g., Kex2p, Kex1p) were resistant to Yb but sensitive to La. Exposure of WT yeast to the serine protease inhibitor tosyl phenylalanyl chloromethyl ketone mimicked the phenotype of kex2∆ under Ln, strengthening these results. Our data also suggest that the relative proportions of chitin and phosphomannan could modulate the proportion of functional groups (phosphates and carboxylates) to which La and Yb could differentially bind. Moreover, we showed that kex2∆, kex1∆, kre1∆, and kre6∆ strains were all sensitive to light Ln (La to Eu), while being increasingly resistant to heavier Ln. Finally, shotgun proteomic analyses identified modulated proteins in kex2∆ exposed to Ln, among which several plasmalemma ion transporters that were less abundant and that could play a role in Yb uptake. By combining these different approaches, we unraveled that cell wall components not only act in Ln adsorption but are also active signal effectors allowing cells to differentiate light and heavy Ln. This work paves the way for future investigations to the better understanding of Ln toxicity in higher eukaryotes.

Keywords: cell wall; deletome; endocytosis; lanthanum; signaling; ytterbium.


Conflict of interest statement

The authors declare that the research was conducted in the absence of any commercial or financial relationships that could be construed as a potential conflict of interest.

Figures

Figure 1
Figure 1
Lanthanide response patterns obtained from genomic phenotyping of a whole mutant collection of Saccharomyces cerevisiae. (A) Venn diagram highlighting the number of mutants being sensitive or resistant to La and/or to Yb. (B) Venn diagram highlighting the number of mutants displaying an exacerbated phenotype (highly resistant/sensitive) toward La and/or Yb.
Figure 2
Figure 2
Cross-comparison of mutant phenotypes to lanthanides versus other metallic stressors. Hierarchical clustering of lanthanide sensitivity or resistance-conferring mutations with the mutant response profiles obtained for other metallic stressors. References to these studies are provided in Supplementary Table S4. The x-axis corresponds to gene-deleted mutants, and the y-axis indicates the different stressors from previously published genomic phenotyping screens conducted on yeast deletion mutant collections. Mutants exhibiting either an enhanced sensitivity or resistance compared to the WT are shown in blue and orange, respectively. Correlation was used as distance measurement to cluster mutants based on metal susceptibility. Clusters of mutants are mentioned below (C1–C11), with mutants displaying an opposite phenotype between La and Yb exposure indicated by red bars. Values in brackets denote the percentage of mutants that were found common between the present screen (La and Yb) and screens with other elements.
Figure 3
Figure 3
Functional enrichment analysis network of functions involved in the cellular response to lanthanides. Functions whose deletion renders cells either sensitive or resistant to La (outer circle) or Yb (inner circle) are shown in blue and yellow, respectively. Interlines represent gene overlap between two related functions, and edge width is proportional to the number of shared genes. The enrichment map was built using GSEA and visualized by the Enrichment map plug-in in Cytoscape.
Figure 4
Figure 4
Schematic representation of the proteins belonging to the cell wall signaling pathway and cell wall organization in the response to Ln. The data show the dual involvement of the cell wall and signalization in the response to lanthanides.
Figure 5
Figure 5
Growth of Kex and Kre mutants and effects of Kex2p overexpression or TPCK supplementation on yeast growth under Ln exposure. (A) Yeast growth was assessed on YPD medium without lanthanides (control) or supplemented with 4.0 mM La, 3.8 mM Ce, 5.8 mM Pr, 4.2 mM Nd, 3.9 mM Sm, 3.9 mM Eu, 3.8 mM Gd, 3.8 mM Tb, 3.6 mM Dy, 3.9 mM Ho, 3.9 mM Er, 3.6 mM Tm, 3.6 mM Yb, or 3.6 mM Lu, with 10-fold serial dilutions of cultures from left to right in each panel. A representative plate (out of 3 independent experiments) is shown. Plates were incubated for 5 days at 28°C. (B) Overexpression of Kex2p confers resistance to La but sensitivity to Yb. Yeast cells were transformed with the empty plasmid (pYES2) or with the same plasmid harboring KEX2 (pYES2-KEX2). Cells were grown on YPG in the presence of either La (3.8 mM) or Yb (3.2 mM) or in the absence of Ln (control), and 10-fold serial dilutions were plated on YPD media. (C) Drop test of 3-fold serial dilutions of the WT strain exposed to La (3.8 mM) and Yb (3.2 mM) with the addition of the serine protease inhibitor tosyl phenylalanyl chloromethyl ketone (TPCK). Representative pictures (out of 3 independent experiments) are given.
Figure 6
Figure 6
La and Yb concentrations and cell wall composition of WT and mutant strains. (A,B) Cells were grown in modified YNB and exposed to (A) La (50 μM) or (B) Yb (6 μM) for one hour. Data are the means (±SD) of three independent cultures. Significant differences from the wild-type condition are indicated by asterisks (ANOVA, Tukey HSD). (C) Cell wall composition of WT, kex2∆, and kre6∆ in chitin, glucans, and mannans. Significant differences from control conditions in each strain are indicated by asterisks (t-test). (D) Chitin content in the cell wall of WT, kex2∆, and kre6∆ under Ln exposure. Significant differences from the WT strain are indicated by asterisks (t-test). (E) Phosphomannan content using the Alcian blue binding test in each strain. Significant differences from the wild-type strain are indicated by asterisks (t-test). Data are the means (±SD) of three independent cultures. For all experiments: *<0.05, **<0.01, ***<0.001.
Figure 7
Figure 7
Heatmap displaying protein abundance changes in kex2∆ compared to the WT. Please, refer to the Supplementary text for information related to proteomics data acquisition and analysis.
Figure 8
Figure 8
Global pathways in Saccharomyces cerevisiae exposed to lanthanide stress. Schematic representation of general functions identified through mutant collection screening. Common functions between the two lanthanides are shown in red, and functions showing a different behavior are shown in blue. La is representative of LREEs, while Yb is representative of HREEs. La-P and Yb-P represent lanthanum ions bound to phosphate groups, while Yb-C represents ytterbium ions bound to carboxyl groups.

Similar articles

Cited by

References

    1. Aouida M., Pagé N., Leduc A., Page N., Peter M., Ramotar D. (2004). A genome-wide screen in Saccharomyces cerevisiae reveals altered transport as a mechanism of resistance to the anticancer drug bleomycin. Cancer Res. 64, 1102–1109. doi: 10.1158/0008-5472.CAN-03-2729 - DOI - PubMed
    1. Arita A., Zhou X., Ellen T. P., Liu X., Bai J., Rooney J. P., et al. . (2009). A genome-wide deletion mutant screen identifies pathways affected by nickel sulfate in Saccharomyces cerevisiae. BMC Genomics 10, 1–14. doi: 10.1186/1471-2164-10-524, PMID: - DOI - PMC - PubMed
    1. Bennett C. B., Lewis L. K., Karthikeyan G., Lobachev K. S., Jin Y. H., Sterling J. F., et al. . (2001). Genes required for ionizing radiation resistance in yeast. Nat. Genet. 29, 426–434. doi: 10.1038/ng778, PMID: - DOI - PubMed
    1. Bleackley M. R., Young B. P., Loewen C. J. R., Macgillivray R. T. A. (2011). High density array screening to identify the genetic requirements for transition metal tolerance in Saccharomyces cerevisiae. Metallomics 3, 195–205. doi: 10.1039/c0mt00035c - DOI - PubMed
    1. Botstein D., Chervitz S. A., Cherry J. M. (1997). Yeast as a model organism. Science 277, 1259–1260. doi: 10.1126/science.277.5330.1259 - DOI - PMC - PubMed

LinkOut - more resources