. 2021 Jan-Feb;5(1):81-86.
doi: 10.1177/2474126420962020. Epub 2021 Oct 27.

Multimodal Imaging in Ocular Siderosis

Affiliations

Multimodal Imaging in Ocular Siderosis

Anh D Bui et al. J Vitreoretin Dis. 2021 Jan-Feb.

Abstract

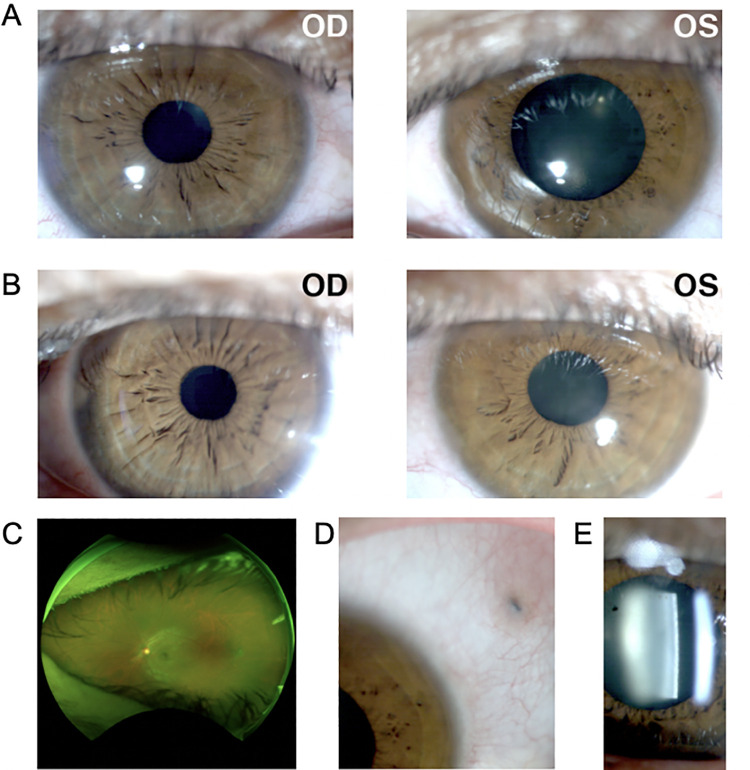
Purpose: This report aims to characterize ocular changes in a case of ocular siderosis with iron toxicity using multimodal imaging and electroretinography.

Methods: A 34-year-old woman presented with ocular siderosis of the left eye following penetrating injury with an iron-containing foreign body. The patient's uncorrected visual acuities were 20/60 and 20/150 in the right and left eye, respectively, with abnormal pupillary function and presence of a cataract in the left eye. She underwent successful intraocular foreign body removal and cataract surgery with no postoperative complications. Cone contrast threshold (CCT), full-field electroretinogram, spectral-domain optical coherence tomography (OCT), and OCT angiography (OCTA) were used to characterize ocular alterations preoperatively and postoperatively.

Results: CCT color vision testing showed abnormal color vision, and OCTA revealed increased vascular flow density associated with the foreign body.

Conclusions: CCT color vision testing, OCTA, OCT, and full-field electroretinogram can characterize retinal changes in cases of ocular siderosis.

Keywords: OCT angiography; cular siderosis; full-field electroretinogram; intraocular foreign body; iron toxicity; optical coherence tomography.


Conflict of interest statement

Declaration of Conflicting Interests The author(s) declared no potential conflicts of interest with respect to the research, authorship, and/or publication of this article.

Figures

Figure 1.
Figure 1.
Intraocular foreign body and pupillary changes. (A) Prepilocarpine and (B) postpilocarpine test in the right (OD) and left (OS) eyes. (C) Color fundus photograph and (D) external photograph of the left eye, showing the intraocular foreign body located in the superotemporal pars plana. (E) Slitlamp photograph showing mottling and pigmentation of the left anterior lens capsule.
Figure 2.
Figure 2.
Iron-induced retinotoxicity on full-field electroretinogram and optical coherence tomography (OCT) imaging. (A) OCT angiography demonstrating a 38% increased parafoveal vascular flow density in the left eye compared with the right eye. (B) Spectral-domain OCT imaging revealing mild macular thickening in the left eye. (C) Full-field electroretinogram showing a reduction of the b-wave amplitude in the left eye compared with the right eye. (D) Spectral-domain OCT cross-sectional images were unremarkable. OD indicates right eye; OS, left eye.
Figure 3.
Figure 3.
ColorDx Cone contrast threshold (CCT) HD color vision testing. (A) CCT testing 1 month after intraocular foreign body (IOFB) removal showing markedly reduced green and blue discrimination in the left eye compared with the right eye. (B) CCT testing 3 months after IOFB removal and 1.5 months after cataract extraction showing normal blue discrimination but reduced red and green discrimination in the left eye. (C) CCT testing 17 months after IOFB removal and 15.5 months after cataract extraction showing normalized red and blue discrimination but persistently decreased green discrimination in the left eye. L indicates retinal L-cone; M, retinal M-cone; OD, right eye; OS, left eye; S, retinal S-cone.
Figure 4.
Figure 4.
Analysis of iron intraocular foreign body. (A) Histological examination with Prussian blue staining demonstrating widespread deposition of iron in the lens’ epithelial cells of the anterior capsule. (B) Scanning electron microscopy of the metallic foreign body. (C) Energy x-ray spectroscopy analysis confirming the presence of iron along with trace amounts of manganese, silicon, and phosphorus.
Figure 5.
Figure 5.
Postsurgical imaging on full-field electroretinogram (ERG) and optical coherence tomography (OCT). (A) OCT angiography demonstrating comparable parafoveal vascular flow density in the left eye compared with the right eye. (B) Spectral-domain OCT imaging revealing comparable macular thickness between the left eye and right eye. (C) Full-field ERG showing normal b-wave amplitude in the left eye, which had improved compared with prior to removal of the intraocular foreign body. LE indicates left eye; OD, right eye; OS, left eye; RE, right eye; 50ms/Div, 50 milliseconds per division.

References

    1. Xie H, Chen S. Ocular siderosis. Eye Sci. 2013;28(2):108–112. - PubMed
    1. Hwang TS, Gao SS, Liu L, et al. Automated quantification of capillary nonperfusion using optical coherence tomography angiography in diabetic retinopathy. JAMA Ophthalmol. 2016;134(4):367–373. doi:10.1001/jamaophthalmol.2015.5658 - PMC - PubMed
    1. Song D, Dunaief JL. Retinal iron homeostasis in health and disease. Front Aging Neurosci. 2013;5:24. doi:10.3389/fnagi.2013.00024 - PMC - PubMed
    1. Alldredge CD, Schlieve CR, Miller NR, Levin LA. Pathophysiology of the optic neuropathy associated with Friedreich ataxia. Arch Ophthalmol. 2003;121(11):1582–1585. doi:10.1001/archopht.121.11.1582 - PubMed
    1. Hope-Ross M, Mahon GJ, Johnston PB. Ocular siderosis. Eye (Lond). 1993;7(Pt 3):419–425. doi:10.1038/eye.1993.83 - PubMed