

Distinct Roles of Adenosine Deaminase Isoenzymes ADA1 and ADA2: A Pan-Cancer Analysis
- PMID: 35663977
- PMCID: PMC9157497
- DOI: 10.3389/fimmu.2022.903461
Distinct Roles of Adenosine Deaminase Isoenzymes ADA1 and ADA2: A Pan-Cancer Analysis
Abstract
Objective: Adenosine deaminase (ADA) plays an important role in immune response, which includes two isoenzymes: ADA1 and ADA2. This study aims to explore the roles of ADA1 and ADA2 in cancers.
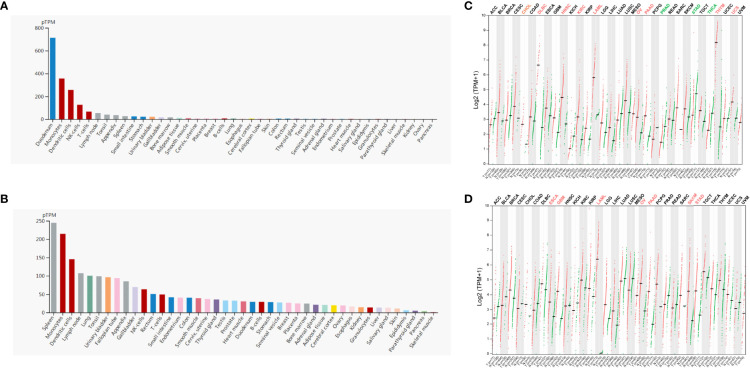
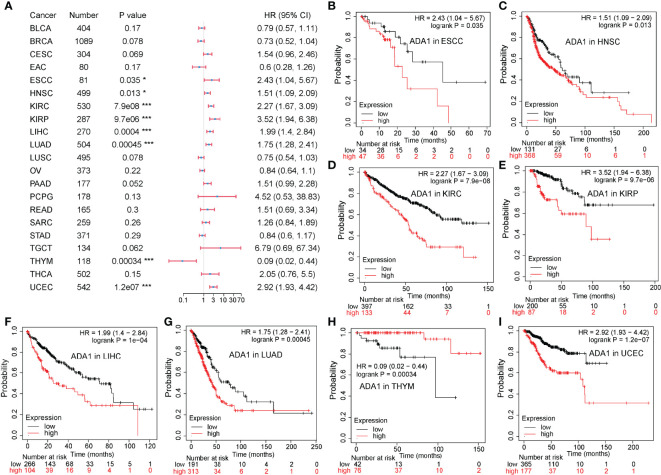
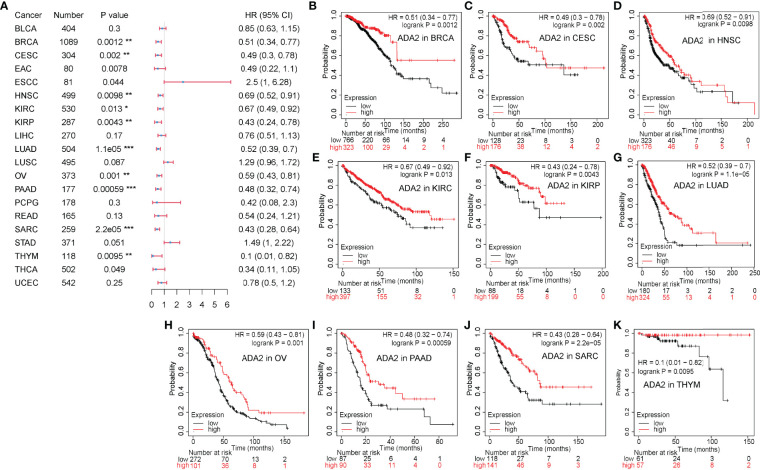
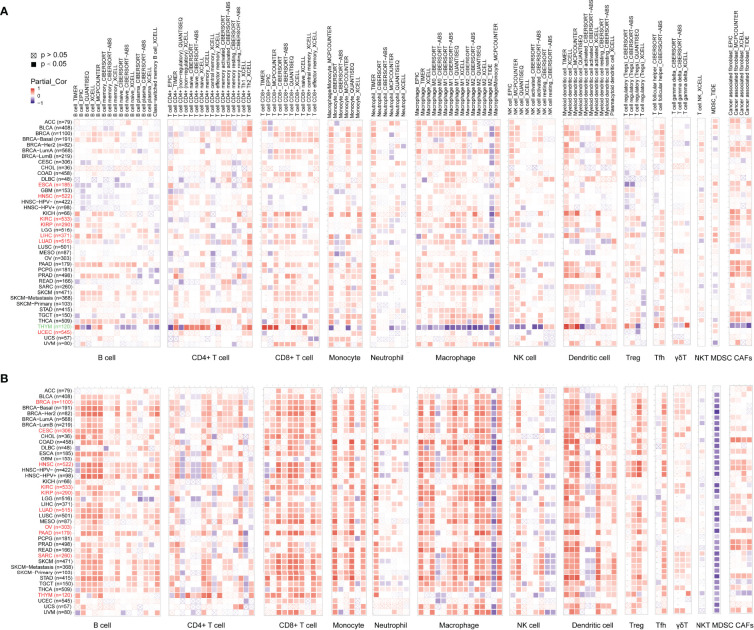
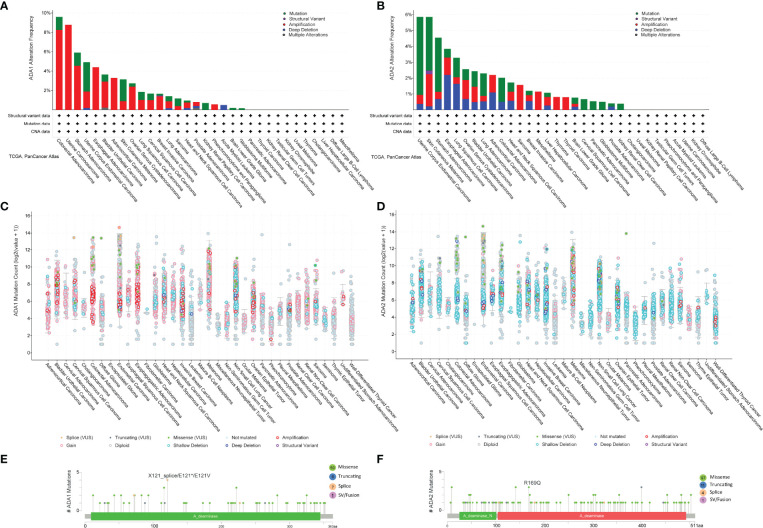
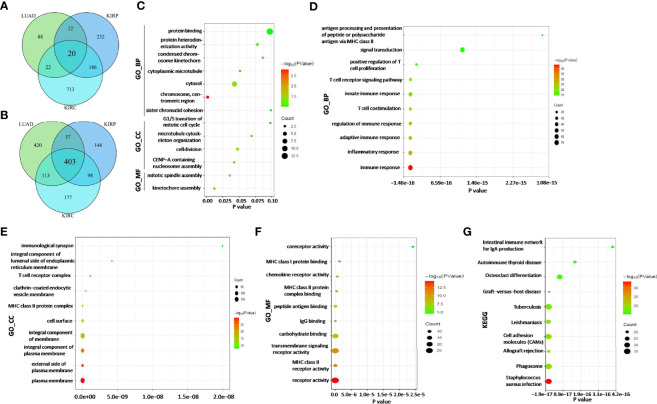
Methods: Human Protein Atlas (HPA) and Gene Expression Profiling Interactive Analysis (GEPIA2) databases were used to analyze the mRNA expression of ADA1 and ADA2 in human normal cells and tumor tissues. The enzyme assay was used to detect the ADA1 and ADA2 activities in serum from cancer patients. The Kaplan-Meier (KM) plotter was used to analyze the prognostic value of ADA1 and ADA2. TIMER2.0 was used to explore how ADA1 and ADA2 correlate with immune infiltration and immune checkpoints. cBioPortal database was used to investigate the mutations of ADA1 and ADA2. LinkedOmics was used to screen the ADA1 and ADA2 expression-related genes.
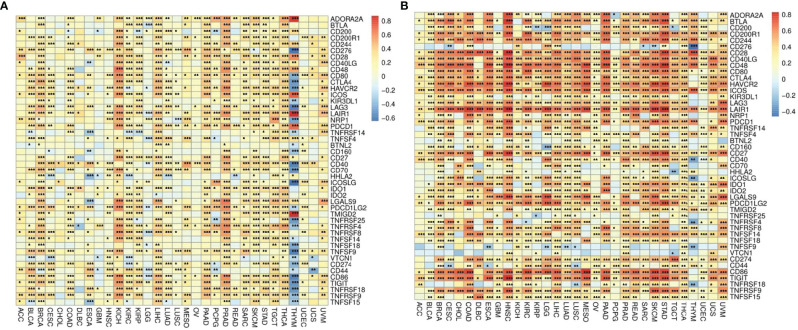
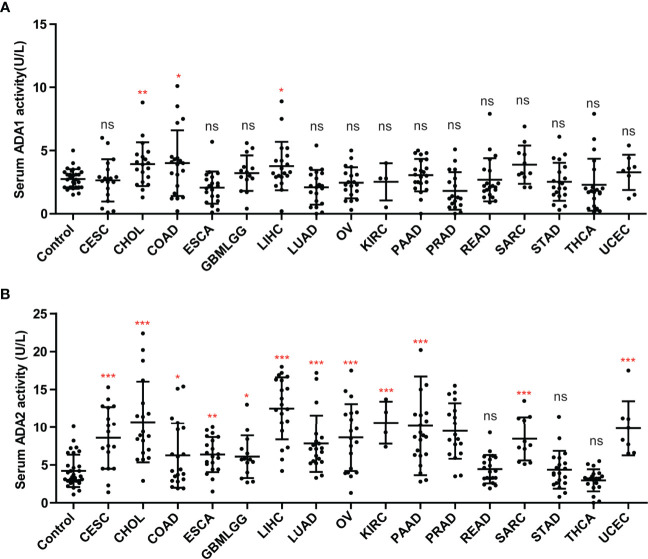
Results: ADA1 was significantly increased in several tumor tissues, including cholangiocarcinoma (CHOL), lymphoid neoplasm diffuse large B-cell lymphoma (DLBC), head and neck squamous cell carcinoma (HNSC), kidney renal clear cell carcinoma (KIRC), ovarian serous cystadenocarcinoma (OV), pancreatic adenocarcinoma (PAAD), thymoma (THYM), and uterine carcinosarcoma (UCS). ADA2 expression was significantly increased in esophageal carcinoma (ESCA), glioblastoma multiforme (GBM), acute myeloid leukemia (LAML), OV, PAAD, skin cutaneous melanoma (SKCM), and stomach adenocarcinoma (STAD). There were no significant changes in serum ADA1 activities in most cancers, while serum ADA2 activities were increased in most cancers. For prognosis, high ADA1 expression was associated with the poor survival in several cancers, including esophageal squamous cell carcinoma (ESCC), HNSC, KIRC, kidney renal papillary cell carcinoma (KIRP), liver hepatocellular carcinoma (LIHC), lung adenocarcinoma (LUAD), and uterine corpus endometrial carcinoma (UCEC). However, high ADA2 expression showed a favorable prognosis in breast invasive carcinoma (BRCA), cervical squamous cell carcinoma and endocervical adenocarcinoma (CESC), HNSC, KIRC, KIRP, LUAD, OV, PAAD, sarcoma, and THYM. ADA1 showed a moderate positive correlation with multiple infiltrating immune cells in most cancers. ADA2 was positively correlated with B cells, CD8 T cells, monocytes/macrophages, and dendritic cells (DCs) and was strongly negatively correlated with myeloid-derived suppressor cells. Function analysis showed that ADA1 expression-related genes were mainly enriched in cell division biological progression. However, ADA2-related genes were mainly associated with immune response.
Conclusion: As isoenzymes, ADA1 and ADA2 showed opposite prognostic values and different correlative patterns with immune infiltrating. These data demonstrated the distinct roles of ADA1 and ADA2 in cancer. ADA2 might act as a protective factor in cancer.
Keywords: ADA1; ADA2; cancer; immune infiltration; prognosis.
Copyright © 2022 Gao, Yang, Liu, Wang, Guo, Zhang and Dong.
Conflict of interest statement
The authors declare that the research was conducted in the absence of any commercial or financial relationships that could be construed as a potential conflict of interest.
Figures
Similar articles
-
APOBEC3C is a novel target for the immune treatment of lower-grade gliomas.Neurol Res. 2024 Mar;46(3):227-242. doi: 10.1080/01616412.2023.2287340. Epub 2024 Jan 22. Neurol Res. 2024. PMID: 38007705
-
Identification of SHCBP1 as a potential biomarker involving diagnosis, prognosis, and tumor immune microenvironment across multiple cancers.Comput Struct Biotechnol J. 2022 Jun 18;20:3106-3119. doi: 10.1016/j.csbj.2022.06.039. eCollection 2022. Comput Struct Biotechnol J. 2022. PMID: 35782736 Free PMC article.
-
Comprehensive analysis of tumor necrosis factor-α-inducible protein 8-like 2 (TIPE2): A potential novel pan-cancer immune checkpoint.Comput Struct Biotechnol J. 2022 Sep 17;20:5226-5234. doi: 10.1016/j.csbj.2022.09.021. eCollection 2022. Comput Struct Biotechnol J. 2022. PMID: 36187930 Free PMC article.
-
The cancer driver genes IDH1/2, JARID1C/ KDM5C, and UTX/ KDM6A: crosstalk between histone demethylation and hypoxic reprogramming in cancer metabolism.Exp Mol Med. 2019 Jun 20;51(6):1-17. doi: 10.1038/s12276-019-0230-6. Exp Mol Med. 2019. PMID: 31221981 Free PMC article. Review.
-
Good or not good: Role of miR-18a in cancer biology.Rep Pract Oncol Radiother. 2020 Sep-Oct;25(5):808-819. doi: 10.1016/j.rpor.2020.07.006. Epub 2020 Aug 12. Rep Pract Oncol Radiother. 2020. PMID: 32884453 Free PMC article. Review.
Cited by
-
Adenosine deaminase 2 regulates the activation of the toll-like receptor 9 in response to nucleic acids.Front Med. 2024 Oct;18(5):814-830. doi: 10.1007/s11684-024-1067-5. Epub 2024 Jul 30. Front Med. 2024. PMID: 39078537
-
Adenosine deaminase promotes goose astrovirus genotype II replication in GEF cells.Poult Sci. 2025 Jul;104(7):105176. doi: 10.1016/j.psj.2025.105176. Epub 2025 Apr 17. Poult Sci. 2025. PMID: 40305933 Free PMC article.
-
Unveiling histotype-specific biomarkers in ovarian carcinoma using proteomics.Mol Ther Oncol. 2025 Jul 16;33(3):201019. doi: 10.1016/j.omton.2025.201019. eCollection 2025 Sep 18. Mol Ther Oncol. 2025. PMID: 40778374 Free PMC article.
-
Role of adenosine deaminase in prostate cancer progression.Am J Clin Exp Urol. 2023 Dec 15;11(6):594-612. eCollection 2023. Am J Clin Exp Urol. 2023. PMID: 38148936 Free PMC article.
-
Cathepsin L promotes oesophageal squamous cell carcinoma development and may be associated with tumour-associated macrophages.Heliyon. 2024 Apr 6;10(7):e29273. doi: 10.1016/j.heliyon.2024.e29273. eCollection 2024 Apr 15. Heliyon. 2024. PMID: 38601581 Free PMC article.
References
Publication types
MeSH terms
Substances
LinkOut - more resources
Full Text Sources
Medical
Research Materials