

Fibroblast activation protein α activatable theranostic pro-photosensitizer for accurate tumor imaging and highly-specific photodynamic therapy
- PMID: 35664057
- PMCID: PMC9131278
- DOI: 10.7150/thno.70308
Fibroblast activation protein α activatable theranostic pro-photosensitizer for accurate tumor imaging and highly-specific photodynamic therapy
Abstract
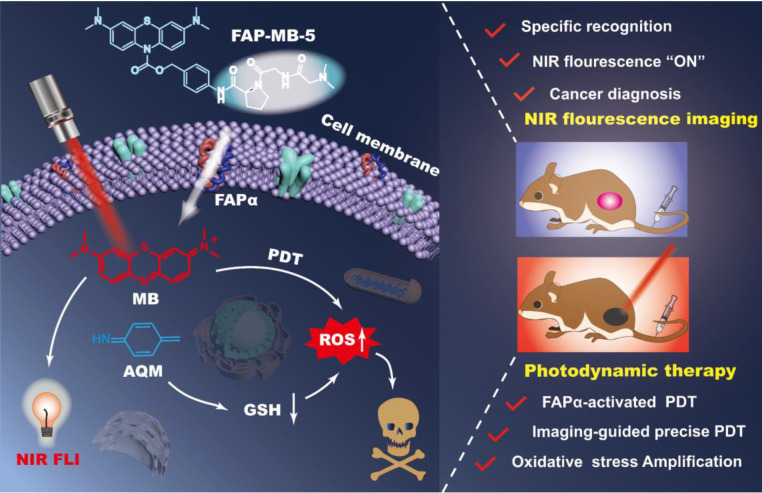
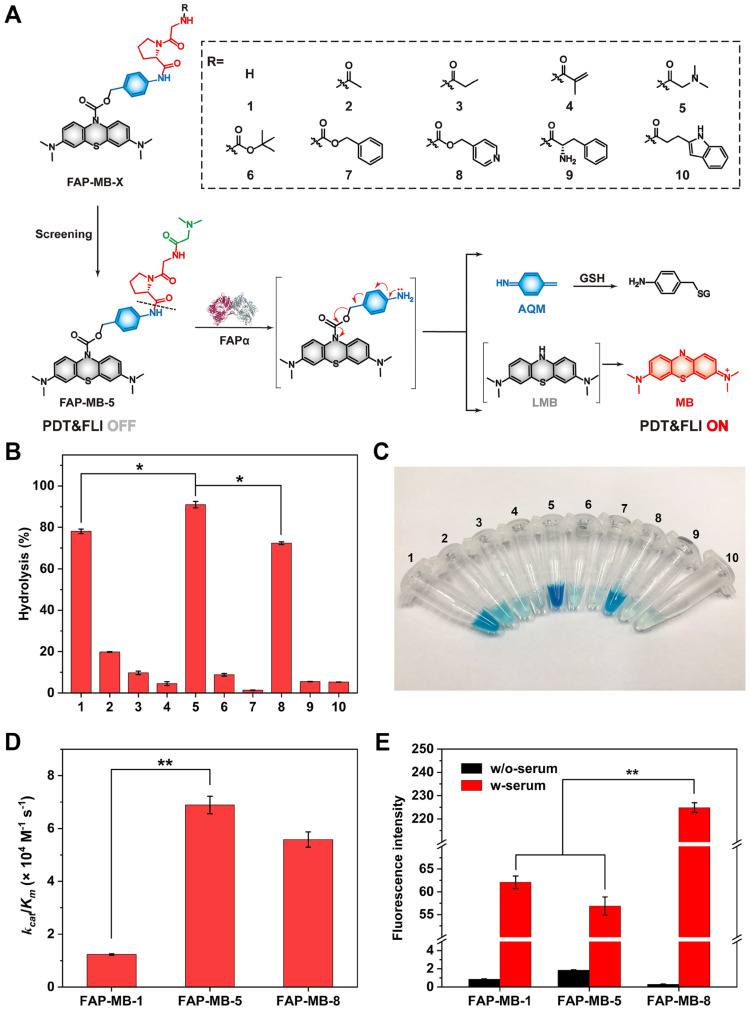
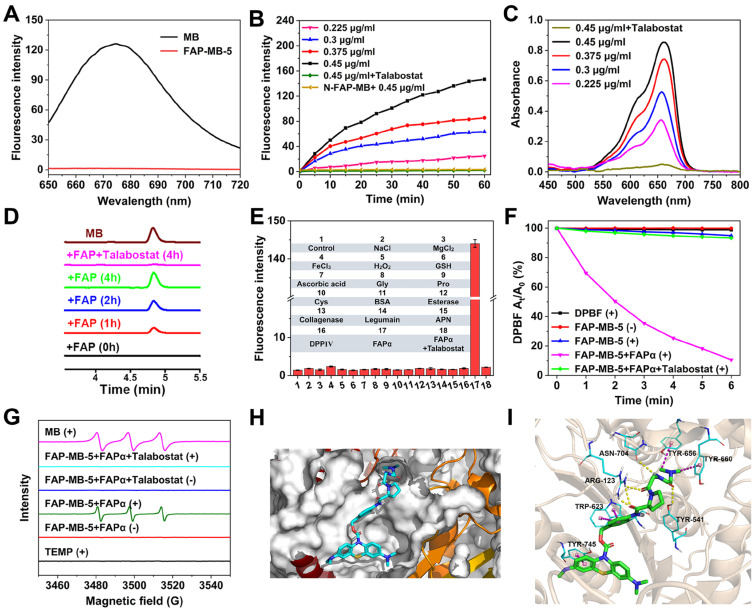
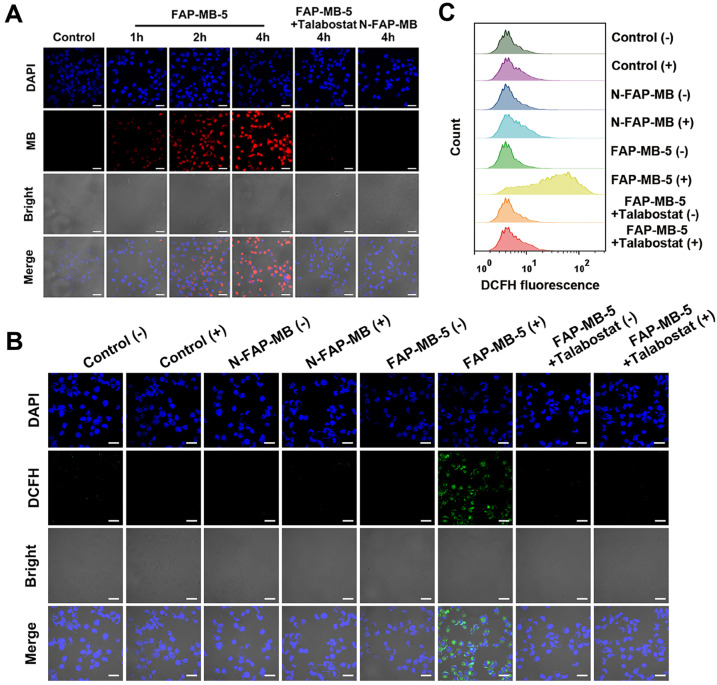
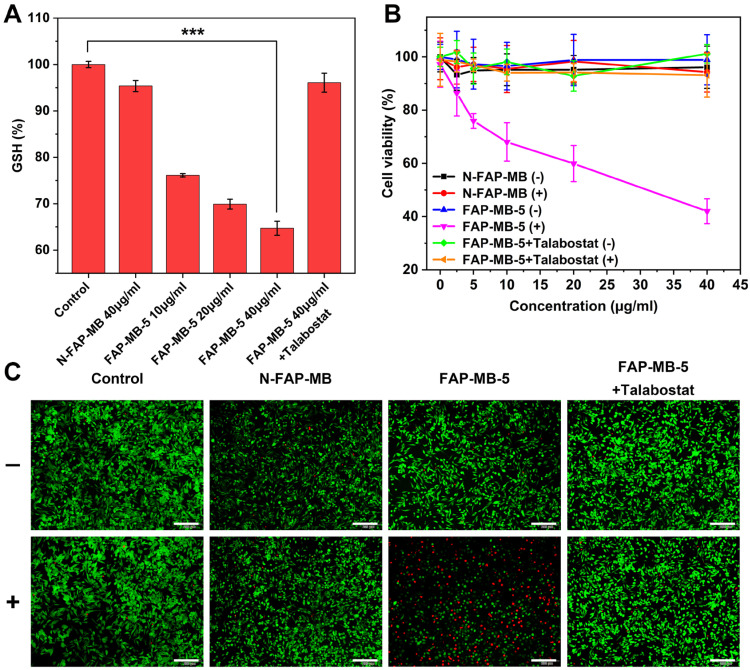
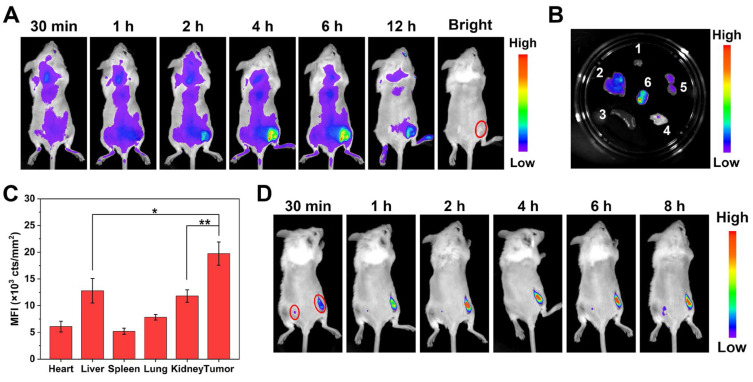
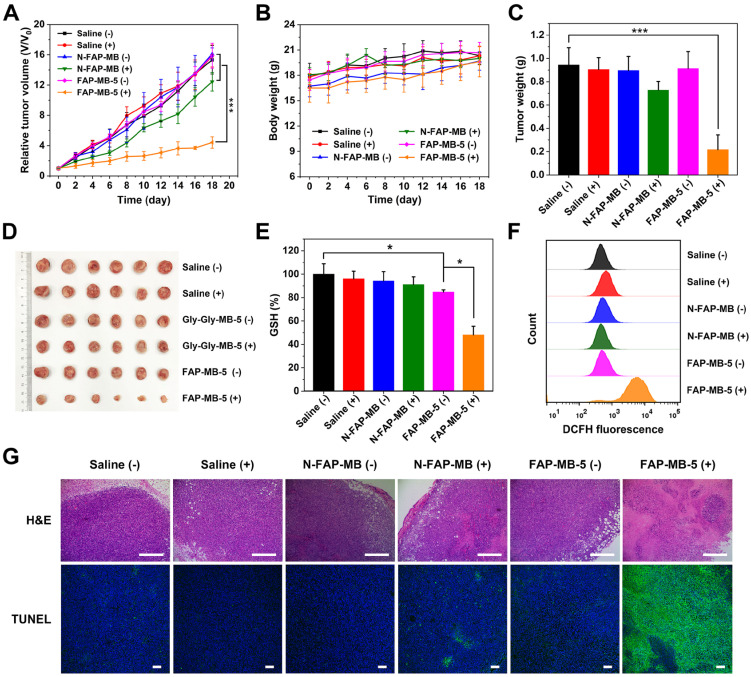
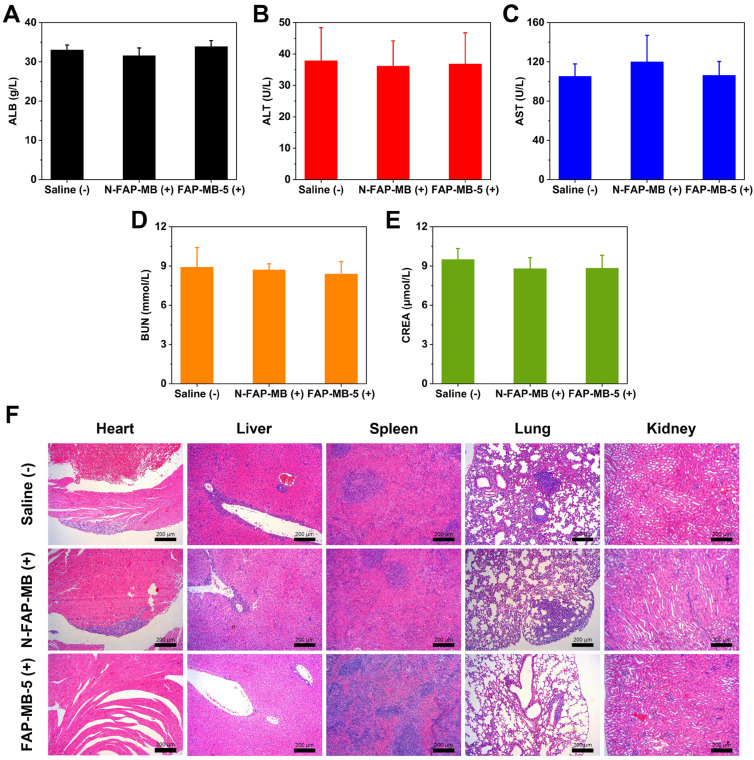
The development of activatable photosensitizers (aPSs) responding to tumor-specific biomarkers for precision photodynamic therapy (PDT) is urgently required. Due to the unique proteolytic activity and highly restricted distribution of tumor-specific enzymes, enzyme activatable photosensitizers display superior selectivity. Methods: Herein, a series of novel Fibroblast Activation Protein α (FAPα) activatable theranostic pro-photosensitizers were designed by conjugating the different N-terminal blocked FAPα-sensitive dipeptide substrates with a clinical PS, methylene blue (MB), through a self-immolative linker, which resulting in the annihilation of the photoactivity (fluorescence and phototoxicity). The best FAPα-responsive pro-photosensitizer was screened out through hydrolytic efficiency and blood stability. Subsequently, a series of in vitro and in vivo experiments were carried out to investigate the FAPα responsiveness and enhanced PDT efficacy. Results: The pro-photosensitizers could be effectively activated by tumor-specific FAPα in the tumor sites. After response to FAPα, the "uncaged" MB can recover its fluorescence and phototoxicity for tumor imaging and cytotoxic singlet oxygen (1O2) generation, eventually achieving accurate imaging-guided PDT. Simultaneously, the generated azaquinone methide (AQM) could serve as a glutathione (GSH) scavenger to rapidly and irreversibly weaken intracellular antioxidant capacity, realizing synergistic oxidative stress amplification and enhanced PDT effect. Conclusion: This novel FAPα activatable theranostic pro-photosensitizers allow for accurate tumor imaging and admirable PDT efficacy with minimal systemic side effects, offering great potential in clinical precision antitumor application.
Keywords: Fibroblast activation protein α; activatable photosensitizer; oxidative stress amplification; photodynamic therapy; tumor imaging.
© The author(s).
Conflict of interest statement
Competing Interests: The authors have declared that no competing interest exists.
Figures
Similar articles
-
H2O2-responsive biodegradable nanomedicine for cancer-selective dual-modal imaging guided precise photodynamic therapy.Biomaterials. 2019 Jul;207:39-48. doi: 10.1016/j.biomaterials.2019.03.042. Epub 2019 Mar 30. Biomaterials. 2019. PMID: 30953845
-
GSH-Activatable NIR Nanoplatform with Mitochondria Targeting for Enhancing Tumor-Specific Therapy.ACS Appl Mater Interfaces. 2019 Dec 4;11(48):44961-44969. doi: 10.1021/acsami.9b15996. Epub 2019 Nov 20. ACS Appl Mater Interfaces. 2019. PMID: 31692323
-
Recent Advances in Photosensitizers as Multifunctional Theranostic Agents for Imaging-Guided Photodynamic Therapy of Cancer.Theranostics. 2021 Aug 26;11(18):9054-9088. doi: 10.7150/thno.62479. eCollection 2021. Theranostics. 2021. PMID: 34522227 Free PMC article. Review.
-
An Activatable Theranostic Nanoprobe for Dual-Modal Imaging-Guided Photodynamic Therapy with Self-Reporting of Sensitizer Activation and Therapeutic Effect.ACS Nano. 2021 Mar 23;15(3):5366-5383. doi: 10.1021/acsnano.0c10916. Epub 2021 Mar 11. ACS Nano. 2021. PMID: 33705106
-
Activatable Phototheranostic Materials for Imaging-Guided Cancer Therapy.ACS Appl Mater Interfaces. 2020 Feb 5;12(5):5286-5299. doi: 10.1021/acsami.9b15064. Epub 2019 Dec 4. ACS Appl Mater Interfaces. 2020. PMID: 31730329 Review.
Cited by
-
FAP-Targeted Nanoparticle-based Imaging in Cancer: A Systematic Review.J Biomed Phys Eng. 2024 Aug 1;14(4):323-334. doi: 10.31661/jbpe.v0i0.2404-1754. eCollection 2024 Aug. J Biomed Phys Eng. 2024. PMID: 39175559 Free PMC article. Review.
-
Tuning singlet oxygen generation with caged organic photosensitizers.Nat Commun. 2024 Sep 3;15(1):7689. doi: 10.1038/s41467-024-51872-y. Nat Commun. 2024. PMID: 39227575 Free PMC article.
-
Mitochondrion-Targeted NIR Therapeutic Agent Suppresses Melanoma by Inducing Apoptosis and Cell Cycle Arrest via E2F/Cyclin/CDK Pathway.Pharmaceuticals (Basel). 2022 Dec 19;15(12):1589. doi: 10.3390/ph15121589. Pharmaceuticals (Basel). 2022. PMID: 36559040 Free PMC article.
-
Revolutionizing cancer treatment: nanotechnology-enabled photodynamic therapy and immunotherapy with advanced photosensitizers.Front Immunol. 2023 Oct 4;14:1219785. doi: 10.3389/fimmu.2023.1219785. eCollection 2023. Front Immunol. 2023. PMID: 37860012 Free PMC article. Review.
-
Fibroblast Activation Protein Is Expressed by Altered Osteoprogenitors and Associated to Disease Burden in Fibrous Dysplasia.Cells. 2024 Aug 27;13(17):1434. doi: 10.3390/cells13171434. Cells. 2024. PMID: 39273006 Free PMC article.
References
-
- Siegel RL, Miller KD, Jemal A. Cancer statistics, 2020. CA Cancer J Clin. 2020;70:7–30. - PubMed
-
- Dolmans DE, Fukumura D, Jain RK. Photodynamic therapy for cancer. Nat Rev Cancer. 2003;3:380–7. - PubMed
-
- Tian J, Huang B, Nawaz MH, Zhang W. Recent advances of multi-dimensional porphyrin-based functional materials in photodynamic therapy. Coordination Chemistry Reviews. 2020;420:213410.
-
- Robertson CA, Evans DH, Abraharnse H. Photodynamic therapy (PDT): A short review on cellular mechanisms and cancer research applications for PDT. Journal of Photochemistry and Photobiology B-Biology. 2009;96:1–8. - PubMed
-
- Huang X, Chen T, Mu N, Lam HW, Sun C, Yue L. et al. Supramolecular micelles as multifunctional theranostic agents for synergistic photodynamic therapy and hypoxia-activated chemotherapy. Acta Biomater. 2021;131:483–92. - PubMed
Publication types
MeSH terms
Substances
LinkOut - more resources
Full Text Sources
Medical
Miscellaneous
