. 2022 May 9;12(8):3847-3861.
doi: 10.7150/thno.71100. eCollection 2022.

PTBP1 knockdown promotes neural differentiation of glioblastoma cells through UNC5B receptor

Affiliations

PTBP1 knockdown promotes neural differentiation of glioblastoma cells through UNC5B receptor

Kankai Wang et al. Theranostics. .

Abstract

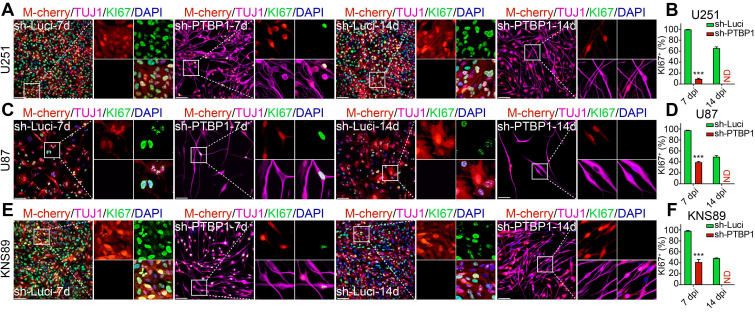
Rationale: Cell reprogramming technology is utilized to prevent cancer progression by transforming cells into terminally differentiated, non-proliferating states. Polypyrimidine tract binding protein 1 (PTBP1) is an RNA binding protein required for the growth of neurons and may directly transform multiple normal human cells into functioning neurons in vitro and in vivo when expressed at low levels. As a result, we identified it as a key to inhibiting cancer cell proliferation by boosting glioblastoma cell neural differentiation. Methods: Immunocytofluorescence (ICF) targeting TUJ1, MAP2, KI67, and EdU were utilized to evaluate glioblastoma cell reprogramming under PTBP1 knockdown or other conditions. PTBP1 and other target genes were detected using Western blotting and qRT-PCR. Activating protein phosphatase 2A (PP2A) and RhoA were detected using specific kits. CCK8 assays were employed to detect cell viability. Bioluminescence, immunohistofluorescence (IHF), and Kaplan-Meier survival analyses were utilized to demonstrate the in vivo reprogramming efficiency of PTBP1 knockdown in U87 murine glioblastoma model. In this study, RNA-seq technology was used to examine the intrinsic pathway. Results: The expression of TUJ1 and MAP2 neural markers, as well as the absence of KI67 and EdU proliferative markers in U251, U87, and KNS89 cells, indicated that glioblastoma cell reprogramming was successful. In vivo, U87 growth generated xenografts was substantially shrank due to PTBP1 knockdown induced neural differentiation, and these tumor-bearing mice had a prolonged survival time. Following RNA-seq, ten potential downstream genes were eliminated. Lentiviral interference and inhibitors blocking tests demonstrated that UNC5B receptor and its downstream signaling were essential in the neural differentiation process mediated by PTBP1 knockdown in glioblastoma cells. Conclusions: Our results indicate that PTBP1 knockdown promotes neural differentiation of glioblastoma cells via UNC5B receptor, consequently suppressing cancer cell proliferation in vitro and in vivo, providing a promising and feasible approach for glioblastoma treatment.

Keywords: PTBP1; cell reprogramming; glioblastoma; neural differentiation; proliferation.


Conflict of interest statement

Competing Interests: The authors have declared that no competing interest exists.

Figures

Figure 1
Figure 1
PTBP1 knockdown reprograms glioblastoma cells into a neural differentiation state. (A) Knockdown efficiency of three different sh-PTBP1 lentiviruses detected by qRT-PCR (n = 3). (B) Western blot analysis of PTBP1 protein in sh-Luci and sh-PTBP1-3 U251 cells (n = 3). GAPDH was used as an internal reference protein. (C) The scheme of cell reprogramming. More than 90% of U251 (D, G), U87 (E, H), KNS89 (F, I) cells expressed neuron markers (TUJ1 and MAP2) at 14 dpi (9 random fields from triplicate samples were captured for quantification; 829 U251, 204 U87 and 540 KNS89 cells (M-cherry+) were tracked per field in sh-Luci group; 164 U251, 20 U87 and 166 KNS89 cells (M-cherry+) were tracked per field in sh-PTBP1 group). The data are presented as mean ± SD. **P < 0.01, ***P < 0.001 vs. sh-Luci group. GM: glioblastoma cell medium; ND: not detected; NM: neuronal induction medium. Scale: 100 µm.
Figure 2
Figure 2
PTBP1 knockdown-mediated reprogramming silences the proliferative marker KI67 in glioblastoma cells. Immunocytofluorescent analysis of U251 (A-B), U87 (C-D), and KNS89 (E-F) cell proliferation at 7 and 14 dpi using KI67 detection (9 random fields from triplicate samples were captured for quantification; KI67+ (%) = KI67+ M-cherry+/M-cherry+; 546-851 U251, 114-205 U87 and 421-692 KNS89 cells (M-cherry+) were tracked per field in sh-Luci group; 159-172 U251, 17-21 U87 and 122-167 KNS89 cells (M-cherry+) were tracked per field in sh-PTBP1 group). The data are presented as mean ± SD. *** P < 0.001 vs. sh-Luci group. Dpi (d): days post infection; ND: not detected. Scale: 100 µm.
Figure 3
Figure 3
PTBP1 knockdown suppresses the proliferative marker EdU in glioblastoma cells. (A) The experimental design for labeling EdU in glioblastoma cells. EdU detection of U251 (B-C), U87 (D-E), and KNS89 (F-G) cell proliferation at 7 and 14 dpi (9 random fields from triplicate samples were captured for quantification; EdU+ (%) = EdU+ M-cherry+/M-cherry+; 565-831 U251, 121-211 U87 and 440-684 KNS89 cells (M-cherry+) were tracked per field in sh-Luci group; 161-185 U251, 20-24 U87 and 130-159 KNS89 cells (M-cherry+) were tracked per field in sh-PTBP1 group). The data are presented as mean ± SD. ***P < 0.001 vs. sh-Luci group. Dpi (d): days post infection; GM: glioblastoma cell medium; ND: not detected; NM: neuronal induction medium. Scale: 100 µm.
Figure 4
Figure 4
The xenografts derived from PTBP1 knockdown U87 cells shrink significantly. (A) The experimental protocol for orthotopic cell transplantation and EdU pretreatment prior to sacrifice. (B-C) In vivo bioluminescent images and the quantification of U87-derived xenografts (n = 5). (D) Post-imaging Kaplan-Meier survival analysis of transplanted mice (n = 5, P = 0.0027 using log-rank test). (E, J) Immunohistofluorescent analysis of tumor formation in mice implanted with sh-Luci and sh-PTBP1 infected U87 cells (n = 5). Tumor mass (outlined by dashed lines) was quantified based on the area occupying ipsilateral brain. (F, K) 79.87% of U87 cells expressed immature neuronal marker DCX 28 days after implantation (DCX+ (%) = DCX+ M-cherry+/M-cherry+; 1,458 M-cherry+ cells were tracked per field in sh-Luci group; 713 M-cherry+ cells were tracked per field in sh-PTBP1 group). (G, L) Lack of KI67 marker of PTBP1 knockdown U87 cells in xenografts (KI67+ (%) = KI67+ M-cherry+/M-cherry+; 1,533 M-cherry+ cells were tracked per field in sh-Luci group; 693 M-cherry+ cells were tracked per field in sh-PTBP1 group). (H, M) Lack of EdU marker of PTBP1 knockdown U87 cells in xenografts (EdU+ (%) = EdU+ M-cherry+/M-cherry+; 1,597 M-cherry+ cells were tracked per field in sh-Luci group; 322 M-cherry+ cells were tracked per field in sh-PTBP1 group). (I, N) 95.71% and 87.91% of U87 cells expressed neuronal marker TUJ1 and MAP2 42 days after implantation (1,586 M-cherry+ cells were tracked per field in sh-Luci group; 355 M-cherry+ cells were tracked per field in sh-PTBP1 group). Forty-five random fields from a series of every tenth coronal brain section of five nude mice were collected for quantification in immunohistofluorescent analysis. The data are presented as mean ± SD. ***P < 0.001 vs. sh-Luci group. GM: glioblastoma cell medium; ND: not detected. Scale: 100 µm.
Figure 5
Figure 5
Analysis of RNA sequencing. (A) A heatmap shows the expression of 577 distinct genes in sh-Luci-3d, sh-PTBP1-3d, and sh-PTBP1-7d U251 cells (n = 3). The volcano map and pathway enrichment analysis of distinct expression genes between sh-PTBP1-3d and sh-PTBP1-7d U251 cells are shown in B and C. (D) The log10 (FPKM) value of ten candidate genes' roles in glioblastoma cell reprogramming (n = 3). (E) To knock down these ten candidates, two sh-RNAs were generated for each gene and validated using qRT-PCR (n = 3). The data are presented as mean ± SD. *P < 0.05, **P < 0.01, ***P < 0.001 vs. sh-PTBP1-3d or sh-Luci group. Dpi (d): days post infection; NS: no significance.
Figure 6
Figure 6
UNC5B receptor is a key in reprogramming generated by PTBP1 knockdown. (A-C) KI67 and TUJ1 staining revealed the reprogramming efficiency of particular lentiviruses-infected U251 cells (9 random fields from triplicate samples were captured for quantification; TUJ1+ (%) = TUJ1+ M-cherry+/M-cherry+; KI67+ (%) = KI67+ M-cherry+/M-cherry+; M-cherry+ cells = 128-566 for each condition). (D, E) Western blot analysis of UNC5B protein in U251 cells infected with sh-Luci and sh-PTBP1 for 3 and 7 days. (n = 3). (F, G) The change of UNC5B protein expression under the state of PTBP1 overexpression. (n = 3). GAPDH was used as an internal reference protein. The data are presented as mean ± SD. ***P < 0.001, ###P < 0.001 vs. sh-PTBP1, sh-Luci, sh-Luci-3d or control vector group. Dpi (d): days post infection; ND: not detected; NS (ns): no significance; OE: overexpression. Scale: 100 µm.
Figure 7
Figure 7
A DAPK1 inhibitor prevents the PTBP1 knockdown induced reprogramming. (A-E) Western blot study of NTN1, DAPK1, P-DAPK1(Ser308), P-P53(ser20), and caspase 3(p17) protein in U251 cells infected with sh-Luci and sh-PTBP1 for 3 and 7 days. (n = 3). As an internal reference protein, GAPDH was used. (F) Activity of PP2A during reprogramming. (n = 3). (G-I) TUJ1 and KI67 positive rates of six distinct groups constituted of lentivirus (sh-Luci or sh-PTBP1) and TC-DAPK6 (vehicle, 100 nM, 250 nM, and 500 nM; nine random fields from triplicate samples were recorded for quantification; TUJ1+ (%) = TUJ1+ M-cherry+/M-cherry+; KI67+ (%) = KI67+ M-cherry+/M-cherry+; M-cherry+ cells = 156-553 for each condition). The data are presented as mean ± SD. *P < 0.05, *** P < 0.001 vs. sh-Luci-3d or sh-PTBP1 + vehicle group. Dpi (d): days post infection; ND: not detected; NS: no significance. Scale: 100 µm.
Figure 8
Figure 8
A RhoA inhibitor prevents the PTBP1 knockdown induced reprogramming. (A-C) Western blot study of NTN4 and RGMA protein in U251 cells infected with sh-Luci and sh-PTBP1 for 3 and 7 days. (n = 3). GAPDH was used as an internal reference protein. (D) RhoA activity measured by G-LISA. (n = 3). (E-G) TUJ1 and KI67 positive rates of five distinct groups constituted of lentivirus (sh-Luci or sh-PTBP1) and Rhosin (vehicle, 10 µM, and 30 µM; nine random fields from triplicate samples were recorded for quantification; TUJ1+ (%) = TUJ1+ M-cherry+/M-cherry+; KI67+ (%) = KI67+ M-cherry+/M-cherry+; M-cherry+ cells = 286-538 for each condition). (H) Pathways involved in PTBP1 knockdown-induced reprogramming. The data are presented as mean ± SD. **P < 0.01, *** P < 0.001 vs. sh-Luci-3d or sh-PTBP1 + vehicle group. Dpi (d): days post infection; ND: not detected; NS: no significance. Scale: 100 µm.

References

    1. Louis DN, Perry A, Wesseling P, Brat DJ, Cree IA, Figarella-Branger D. et al. The 2021 who classification of tumors of the central nervous system: A summary. Neuro Oncol. 2021;23:1231–51. - PMC - PubMed
    1. Molinaro AM, Taylor JW, Wiencke JK, Wrensch MR. Genetic and molecular epidemiology of adult diffuse glioma. Nat Rev Neurol. 2019;15:405–17. - PMC - PubMed
    1. Ostrom QT, Patil N, Cioffi G, Waite K, Kruchko C, Barnholtz-Sloan JS. Cbtrus statistical report: Primary brain and other central nervous system tumors diagnosed in the united states in 2013-2017. Neuro Oncol. 2020;22:iv1–iv96. - PMC - PubMed
    1. Tan AC, Ashley DM, López GY, Malinzak M, Friedman HS, Khasraw M. Management of glioblastoma: State of the art and future directions. CA Cancer J Clin. 2020;70:299–312. - PubMed
    1. Chiocca EA, Gelb AB, Chen CC, Rao G, Reardon DA, Wen PY, Combined immunotherapy with controlled interleukin-12 gene therapy and immune checkpoint blockade in recurrent glioblastoma: An open-label, multi-institutional phase 1 trial. Neuro Oncol. 2021. - PMC - PubMed

Publication types

MeSH terms