. 2022 May 1;12(8):3776-3793.
doi: 10.7150/thno.69494. eCollection 2022.

Crosstalk between macrophage-derived PGE2 and tumor UHRF1 drives hepatocellular carcinoma progression

Affiliations

Crosstalk between macrophage-derived PGE2 and tumor UHRF1 drives hepatocellular carcinoma progression

Jian Zhang et al. Theranostics. .

Abstract

Background: Tumor-associated macrophages (TAMs) and dysregulated tumor epigenetics contribute to hepatocellular carcinoma (HCC) progression. However, the mechanistic interactions between TAMs and tumor epigenetics remain poorly understood. Methods: Immunohistochemistry and multiplexed fluorescence staining were performed to evaluate the correlation between TAMs numbers and UHRF1 expression in human HCC tissues. PGE2 neutralizing antibody and COX-2 inhibitor were used to analyze the regulation of TAMs isolated from HCC tissues on UHRF1 expression. Multiple microRNA prediction programs were employed to identify microRNAs that target UHRF1 3'UTR. Luciferase reporter assay was applied to evaluate the regulation of miR-520d on UHRF1 expression. Chromatin immunoprecipitation (ChIP) assays were performed to assess the abundance of H3K9me2 in the KLF6 promoter and DNMT1 in the CSF1 promoter regulated by UHRF1. The functional roles of TAM-mediated oncogenic network in HCC progression were verified by in vitro colony formation assays, in vivo xenograft experiments and analysis of clinical samples. Results: Here, we find that TAMs induce and maintain high levels of HCC UHRF1, an oncogenic epigenetic regulator. Mechanistically, TAM-derived PGE2 stimulates UHRF1 expression by repressing miR-520d that targets the 3'-UTR of UHRF1 mRNA. In consequence, upregulated UHRF1 methylates H3K9 to diminish tumor KLF6 expression, a tumor inhibitory transcriptional factor that directly transcribes miR-520d. PGE2 reduces KLF6 occupancy in the promoter of miR-520d, dampens miR-520d expression, and sustains robust UHRF1 expression. Moreover, UHRF1 promotes CSF1 expression by inducing DNA hypomethylation of the CSF1 promoter and supports TAM accumulation. Conclusions: Capitalizing on studies on HCC cells and tissues, animal models, and clinical information, we reveal a previously unappreciated TAM-mediated oncogenic network via multiple reciprocal enforcing molecular nodes. Targeting this network may be an approach to treat HCC patients.

Keywords: TAMs; UHRF1; crosstalk; epigenetic regulator; hepatocellular carcinoma; miRNA.


Conflict of interest statement

Competing Interests: The authors have declared that no competing interest exists.

Figures

Figure 1
Figure 1
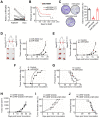
TAMs secrete PGE2 to promote UHRF1 expression in HCC cells. (A) Left: The representative images of CD68 and UHRF1 immunohistochemical staining in human HCC tissues (Group 1); bottom panel: enlargement of the black-line boxed regions. Scale bar, 50 µm. Right: Relationship between tumor UHRF1 expression and CD68+ macrophages in human HCC tissues. Low CD68, n = 27; High CD68, n = 26. *P = 0.003, versus Low CD68. Median, 25/75% quartiles (boxes), and Min.-Max. values (whisker) are shown. Student's t-test. (B, C) Uhrf1 mRNA (B) and protein levels (C) in murine HCC H22 xenograft tumors in the mice without (Control) or with macrophage depletion (MΦ dep.). In C, representative blot images (two mice per group) are shown. n = 3, *P = 0.0002. Student's t-test. (D, E) UHRF1 mRNA (D) and protein levels (E) in HepG2 cells after being incubated with the culture medium (Medium) and the supernatants of macrophages isolated from healthy volunteers (Healthy MΦ sup.) or the supernatants of human HCC TAMs (TAM sup.) for 24 hours. In D, n = 3, *P = 0.0065, versus Medium. One-way ANOVA with Dunnett's multiple comparisons test. (F, G) UHRF1 mRNA (F) and protein levels (G) in HepG2 cells after being incubated with TNF-α (10 ng/mL), IFN-γ (10 ng/mL), PGE2 (200 ng/mL), IL-6 (20 ng/mL), or IL-1β (10 ng/mL) for 24 hours. In F, n = 3, *P = 7×10⁻⁶, PGE2 versus Control; n = 3, *P = 0.00126, IL-6 versus Control. One-way ANOVA with Dunnett's multiple comparisons test. (H, I) UHRF1 mRNA (H) and protein levels (I) in HepG2 cells incubated with 0, 100, 200 or 400 ng/mL of PGE2 in culture medium. In H, n = 3, *P = 0.0025 and 0.0011 for PGE2 200 and 400 ng/mL versus PGE2 0 ng/mL, respectively. One-way ANOVA with Dunnett's multiple comparisons test. (J) PGE2 concentrations in the supernatants of macrophages isolated from healthy volunteers (Healthy MΦ) or in the supernatants of human HCC TAMs (TAMs). Cells were cultured with RPMI medium for 24 hours prior to measurement. n = 3, *P = 0.0039. Student's t-test. (K) UHRF1 expression in HepG2 cells cultured with human HCC TAM supernatants with anti-PGE2 mAb or isotype (TAM sup.). (L) UHRF1 expression in HepG2 cells growing in the lower chamber of a transwell co-culture system with fresh medium (Medium), macrophages isolated from healthy volunteers (Healthy MΦ), human HCC TAMs (TAMs), or celecoxib-pretreated HCC TAMs (CXB-pretreated TMAs) in the upper chamber of the transwell system.
Figure 2
Figure 2
TAM-derived PGE2 upregulates UHRF1 through inhibiting miR-520d. (A) The activity of UHRF1 3'UTR reporter in HepG2 cells after being incubated with PGE2 (200 ng/mL) for 24 hours. n = 3, *P = 0.0037. Student's t-test. (B) The expression ratios of candidate microRNA levels in HCC tissues relative to their levels in the paired adjacent normal tissues. Median, 25/75% quartiles (boxes), and Min.-Max. values (whisker) are shown. 100 HCC patients from GSE20596. (C) Left: The activity of UHRF1 3'UTR reporter in HepG2 cells transfected with the expression plasmids of miR-520d, miR-302a, or nonsense control miRNA (Control). *P = 0.0025, versus Control. One-way ANOVA with Dunnett's multiple comparisons test. Right: The activity of UHRF1 3'UTR reporter in HepG2 cells transfected with the expression plasmids of miR-520d mimics (miR-520d inhibitor) or nonsense control miRNA inhibitor (NC inhibitor). n = 3, *P =0.0001. Student's t-test. (D) Left: UHRF1 protein levels in HepG2 cells transfected with the expression plasmids of miR-520d or nonsense control miRNA (Control). Right: UHRF1 protein levels in HEK293T cells transfected with the expression plasmids of miR-520d mimics (miR-520d inhibitor) or nonsense control miRNA inhibitor (NC inhibitor). (E) The predicted binding site (bold uppercase) of miR-520d in UHRF1 3'UTR and the designed mutations (bold lowercase) at the binding site. (F) Left: The activity of mutated UHRF1 3'UTR reporter in HepG2 cells transfected with the plasmids expressing miR-520d or nonsense control miRNA (Control). n = 3, P = 0.4935, Student's t-test. Right: The activity of mutated UHRF1 3'UTR reporter in HepG2 cells transfected with the plasmids expressing miR-520d mimics (miR-520d inhibitor) or nonsense control miRNA inhibitor (NC inhibitor). n = 3, P = 0.637, Student's t-test. (G) UHRF1 protein levels in HepG2 cells stably expressing miR-520d, miR-520d mutant (miR-520d mut), or nonsense control miRNA (Control) without or with PGE2 (200 ng/mL) treatment for 24 hours. (H) MiR-520d levels in HepG2 cells after being incubated with 0, 100, 200, 400 ng/mL of PGE2 for 24 hours. n = 3, *P = 5.16 × 10⁻⁴, 4.6 × 10⁻⁵, 1.1 × 10⁻⁵ for PGE2 100, 200, 400 ng/mL versus PGE2 0 ng/mL, respectively. One-way ANOVA with Dunnett's multiple comparisons test. (I) MiR-520d levels in HepG2 cells after being incubated with fresh medium (Medium), TAM supernatants (TAM sup.), or TAM supernatants mixed with anti-PGE2 mAb (2 µg/mL) (TAM sup. + anti-PGE2) for 24 hours. n = 3, *P = 0.001679, versus Medium. One-way ANOVA with Dunnett's multiple comparisons test. (J) MiR-520d levels in HepG2 cells incubated with fresh medium (Medium), TAM supernatants (TAM sup.) or the supernatants of celecoxib-pretreated TAMs (CXB-pretreated TAM sup.) for 24 hours. n = 3, *P = 0.007407, versus Medium. One-way ANOVA with Dunnett's multiple comparisons test. (K) MiR-520d levels in HepG2 xenograft tumors in nude mice without (Control) or with macrophage depletion (MΦ-dep.). n = 3 per group, *P = 9.52 x 10⁻⁵. Student's t-test.
Figure 3
Figure 3
MiR-520d targets UHRF1 to control HCC progression. (A) MiR-520d levels in HCC tissues and their paired adjacent normal tissues. n = 18 patients, *P = 0.0365. Student's t-test. (B) Kaplan-Meier overall survival stratified by miR-520d levels in human HCC tissues (GSE10694). n = 25 for miR-520d LOW; n = 26, miR-520d HIGH. *P = 0.031. Log-rank (Mantel-Cox) test. (C) Left: Images of colony formation assays using HepG2 cells stably expressing miR-520d, miR-520d mutant (miR-520d mut), or nonsense miRNA control (Control). Scale bar, 4 mm. Right: Quantification of colony formation rate. n = 3, *P = 1.2 x 10⁻⁴, versus Control. One-way ANOVA with Dunnett's multiple comparisons test. (D) Growth of HepG2 xenograft tumors stably expressing miR-520d or miR-520d mutant (miR-520d mut). These two types of cells were subcutaneously inoculated into the left and right posterior flanks of the same NCG mice, respectively. n = 3, *P = 0.0369. Student's t-test. (E) Effect of miR-520d on tumor growth. HepG2 cells stably expressing miR-520d or nonsense miRNA control (Control) were inoculated into the left and right posterior flank of the same NCG mice, respectively. n = 3, *P = 0.0162. Student's t-test. (F, G) Tumor formation rate (F) and survival of nude mice (G). Mice were subcutaneously inoculated with 107 HepG2 cells stably expressing miR-520d or nonsense miRNA control (Control). n = 8 per group, *P = 0.038, Log-rank Mantel-Cox test. (H-J) Role of UHRF1 in tumor growth (H), tumor formation rate (I) and mouse survival (J). Nude mice were inoculated with 107 HepG2 cells stably expressing UHRF1 coding sequence along with nonsense miRNA control (UHRF1 CDS) or miR-520d (UHRF1 CDS + miR-520d). n = 8 per group, P > 0.05.
Figure 4
Figure 4
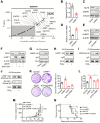
UHRF1 inhibits KLF6 through H3K9 methylation to promote HCC progression. (A) Pearson correlation analysis on UHRF1 with 49 putative transcription factors using the data from GSE6764. Unshaded area covers the genes (black dots indicated by arrows) with statistical significance (r > -0.2, P < 0.05). *P(KLF6) = 0.002906. Pearson product-moment correlation coefficient. (B, C) KLF6 mRNA (B) and protein levels (C) in L02 cells (human immortalized normal liver cell line) overexpressing UHRF1 or control vector (Vector). In B, n = 3, *P = 0.0043. Student's t-test. (D, E) KLF6 mRNA (D) and protein levels (E) in HepG2 cells overexpressing shUHRF1 or nonsense control shRNA (shNC). In D, n = 3, *P = 0.0023. Student's t-test. (F) KLF6 protein levels in HepG2 or UHRF1-overexpressing HepG2 cells treated without or with BIX01294 for 24 hours. (G) UHRF1 occupancy on the KLF6 promoter in HepG2 cells transfected with UHRF1 or control vector (Vector). (H, I) UHRF1 (H) and H3K9me2 (I) abundance on the KLF6 promoter in HepG2 cells incubated without or with PGE2 (200 ng/mL) for 24 hours. (J) Re-ChIP assays with the antibodies against UHRF1 and H3K9me2 to analyze their co-localization on the KLF6 promoter in HepG2 cells that were incubated without or with PGE2 (200 ng/mL) for 24 hours prior to use. (K) Left: Images of colony formation assays using 104 HepG2 cells stably expressing empty vector (Control), UHRF1, KLF6, or both (KLF6 + UHRF1). Scale bar, 4 mm. Right: Quantification of colony formation rates. n = 3, *P = 0.00706, versus Control. One-way ANOVA with Dunnett's multiple comparisons test. (L) Sphere formation of 2,000 HepG2 cells stably expressing empty vector (Control), UHRF1, KLF6, or both (KLF6 + UHRF1) after being cultured for 2 weeks. n = 3, *P = 0.002, UHRF1 versus Control; *P = 0.049, UHRF1 versus KLF6 + UHRF1. One-way ANOVA with Dunnett's multiple comparisons tests. (M, N) Tumor growth (M) and overall survival (N) of nude mice inoculated with 107 HepG2 cells stably expressing control vector (Control), shUHRF1, shKLF6, or both (shUHRF1+ shKLF6). n = 8 per group. In M, *P = 0.006536, shUHRF1 versus Control. One-way ANOVA with Dunnett's multiple comparisons test.
Figure 5
Figure 5
KLF6 and miR-520d form a molecular network in HCC. (A) The activity of the miR-520d promoter in HepG2 cells after being incubated without or with PGE2 (200 ng/mL) for 24 hours. n = 3, *P = 0.0326. Student's t-test. (B) ChIP assays showing occupancy of endogenous KLF6 on the miR-520d promoter in HepG2 cells after being incubated without or with PGE2 (200 ng/mL) for 24 hours. (C) ChIP assays showing occupancy of exogenous KLF6 on the miR-520d promoter in HepG2 cells after being incubated without or with PGE2 (200 ng/mL) for 24 hours. Flag-KLF6, KLF6 protein fused with a Flag tag at N-terminus. (D) MiR-520d levels in HepG2 cells stably expressing empty vector (Vector) or KLF6. n = 3, *P = 0.0008. Student's t-test. (E) The activity of the miR-520d promoter in HepG2 cells stably expressing empty vector (Vector) or KLF6. n = 3, *P = 0.000339. Student's t-test. (F) ChIP assays showing KLF6 occupancy on the “GC box” (Region A) of the miR-520d promoter in HepG2 cells stably expressing empty vector or KLF6. (G) The reporter activities of the miR-520d promoter (WT) or the mutated miR-520d promoter (Mutant) where the GGGCGG (Region A) sequence was altered (see Supplementary Fig. S5B) in HepG2 cells stably expressing empty vector (Vector) or KLF6. n = 3, *P = 8.05 x 10⁻⁵. Student's t-test.
Figure 6
Figure 6
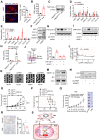
TAMs promote HCC progression via the UHRF1 and CSF1 network. (A) Left: Immunofluorescent staining of CD68+ TAMs (red) in xenograft H22 tumors expressing nonsense control shRNA (shNC) or shUhrf1. The nuclei (blue) were stained by DAPI. Scale bar, 50 µm. Right: CD68 positive cells per field. Six randomly selected microscopic fields per sample. n = 6 samples per group, *P = 0.0007. Student's t-test. (B, C) PGE2 secretion (B) and COX-2 expression (C) in human HCC TAMs. TAMs were incubated with the supernatants of HepG2 cells expressing control vector (HepG2Ctrl sup.) or UHRF1 (HepG2UHRF1 sup.) for 24 hours. n = 3, *P = 0.0031. Student's t-test. (D, E) The relevant mRNA levels in HepG2 cells stably expressing nonsense control shRNA (shNC) and shUHRF1 (D), or expressing empty vector (Vector) and UHRF1 (E). n = 3, *P < 0.05, versus corresponding control (shNC or Vector). Student's t-test. (F) CSF1 and CCL14 protein levels in HepG2 cells stably expressing empty vector (Vector) or UHRF1. (G) COX-2 protein levels in TAMs incubated with the supernatants from HepG2 cells or UHRF1-overexpressing HepG2 cells. HepG2 cells were treated without or with CSF1 neutralizing antibody (anti-CSF1, 2 μg/mL) for 24 hours. (H) PGE2 secretion from human HCC TAMs. TAMs were incubated with the supernatants from HepG2 cells or UHRF1-overexpressing HepG2 cells that were treated without or with anti-CSF1 (2 µg/mL) for 48 hours. Isotype IgG as an antibody control. n = 3, *P = 0.03117. Student's t-test. (I) COX-2 protein levels in human HCC TAMs incubated with the supernatants from HepG2 cells or UHRF1-overexpressing HepG2 cells that were treated without or with siRNA against CSF1 (siCSF1) for 48 hours. (J) Left: Schematics showing transwell assays analyzing human HCC TAMs. Human TAMs were seeded in the upper chamber. HepG2 cells (HepG2Ctrl) or UHRF1-overexpressing HepG2 cells (HepG2UHRF1) were seeded in the lower chamber. TAMs were cultured in the medium without or with anti-CSF1 (2 μg/mL). Isotype IgG as an antibody control. Right: Percentages of migrated TAMs relative to total TAMs. n = 3 with replicates. *P = 1.39 × 10⁻⁴, versus Control (HepG2Ctrl in medium without anti-CSF1). One-way ANOVA with Dunnett's multiple comparisons test. (K) DNA methylation of CpG islands in the CSF1 promoter in HepG2 cells stably expressing control vector (Vector), UHRF1, shNC or shUHRF1. Closed circles indicate methylated CpGs. Open circles represent unmethylated CpGs. Percentage of DNA methylation (methylated CpGs/ total CpGs) is given at the bottom of each panel. (L) Pearson correlation between UHRF1 mRNA levels and CSF1 promoter methylation levels in human HCC tissues. 16 HCC patients. (M) ChIP assay showing DNMT1 abundance on the CSF1 promoter in HepG2 cells stably expressing shNC or shUHRF1. (N) CSF1 protein levels in HepG2 cells and shUHRF1-expressing HepG2 cells that were transfected without or with siRNA against DNMT1 (siDNMT1). (O, P) Tumor growth (O) and overall survival (P) of the mice. Mice were subcutaneously inoculated with H22 cells stably expressing shUhrf1 (H22shUhrf1) or shNC (H22shNC). Half of the mice in each group were intraperitoneally injected with Clodronate liposomes to deplete macrophages (H22shUhrf1 + MΦ-dep., and H22shNC + MΦ-dep.). n = 4 per group. In O, *P = 0.0006, H22shNC + MΦ-dep. versus H22shNC; P = 0.0740 (N.S.), H22shUhrf1 + MΦ-dep. versus H22shUhrf1; Student's t-test. In P, *P = 0.0169, H22shNC + MΦ-dep. versus H22shNC; P = 0.1753, H22shUhrf1 + MΦ-dep. versus H22shUhrf1; Log-rank (Mantel-Cox) test. (Q) Effect of celecoxib on tumor growth. H22 cells were inoculated into the left posterior flank of the Balb/c mice. The tumor bearing mice were then treated with daily oral administration of celecoxib (CXB, 150 mg/kg, n = 6) or solvent (Control, n = 6). Left panel: once tumors started growing, their sizes were measured twice weekly and tumor volume was calculated. Right panel: photographs of isolated tumors from each group. *P = 0.042. Student's t-test. (R) UHRF1 staining analysis of tissue sections from celecoxib(CXB)-treated and solvent(Control)-treated H22 tumor bearing mice (n = 6 per group). Scale bar, 1 cm. *P = 0.022. Student's t-test. (S) Schematic model showing the interactions between TAMs and HCC cells. TAMs produce and release PGE2 into the tumor microenvironment. (I) PGE2 inhibits miR-520 transcription by dissociating KLF6 from the miR-520 promoter. (II) Reduced miR-520 permits UHRF1 upregulation. (III) High-level UHRF1 epigenetically suppresses KLF6 expression via H3K9 hypermethylation. (IV) Dampened KLF6 lowers miR-520, thus allowing further elevation of UHRF1 protein level. (V) Concurrently, high-level UHRF1 epigenetically promotes CSF1 expression via DNA hypomethylation. (VI) CSF1 secreted from HCC cells promotes COX-2 expression in TAMs, leading to macrophage tumor infiltration and activation. The upregulated COX-2 in TAMs stimulates additional PGE2 production.

References

    1. Torre LA, Bray F, Siegel RL, Ferlay J, Lortet-Tieulent J, Jemal A. Global cancer statistics, 2012. CA: a cancer journal for clinicians. 2015;65:87–108. - PubMed
    1. Galun E. Liver inflammation and cancer: The role of tissue microenvironment in generating the tumor-promoting niche (TPN) in the development of hepatocellular carcinoma. Hepatology. 2016;63:354–6. - PubMed
    1. Kornblihtt AR. Epigenetics at the base of alternative splicing changes that promote colorectal cancer. The Journal of clinical investigation. 2017;127:3281–3. - PMC - PubMed
    1. Qian BZ, Pollard JW. Macrophage diversity enhances tumor progression and metastasis. Cell. 2010;141:39–51. - PMC - PubMed
    1. Zou W. Immunosuppressive networks in the tumour environment and their therapeutic relevance. Nature reviews Cancer. 2005;5:263–74. - PubMed

Publication types