. 2022 Apr 24;12(8):3584-3600.
doi: 10.7150/thno.72192. eCollection 2022.

TRIB1 regulates tumor growth via controlling tumor-associated macrophage phenotypes and is associated with breast cancer survival and treatment response

Affiliations

TRIB1 regulates tumor growth via controlling tumor-associated macrophage phenotypes and is associated with breast cancer survival and treatment response

Taewoo Kim et al. Theranostics. .

Abstract

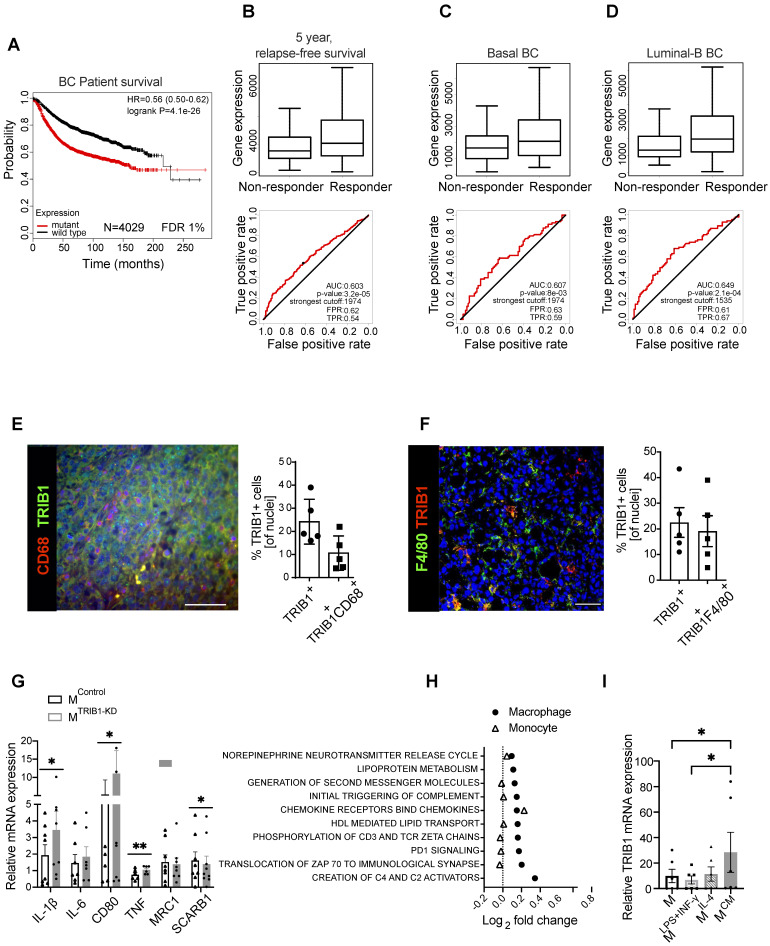
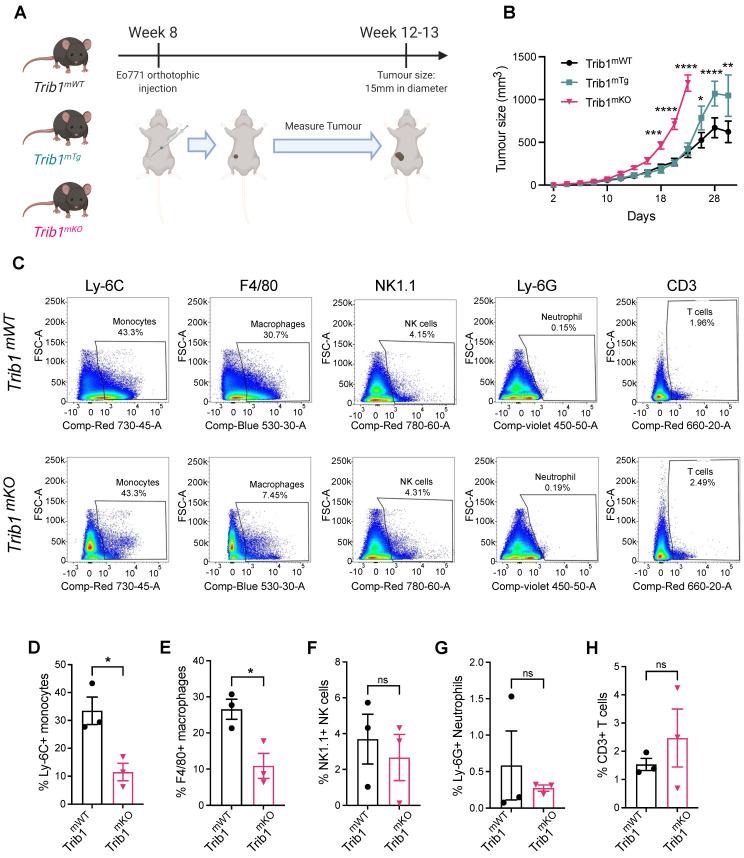
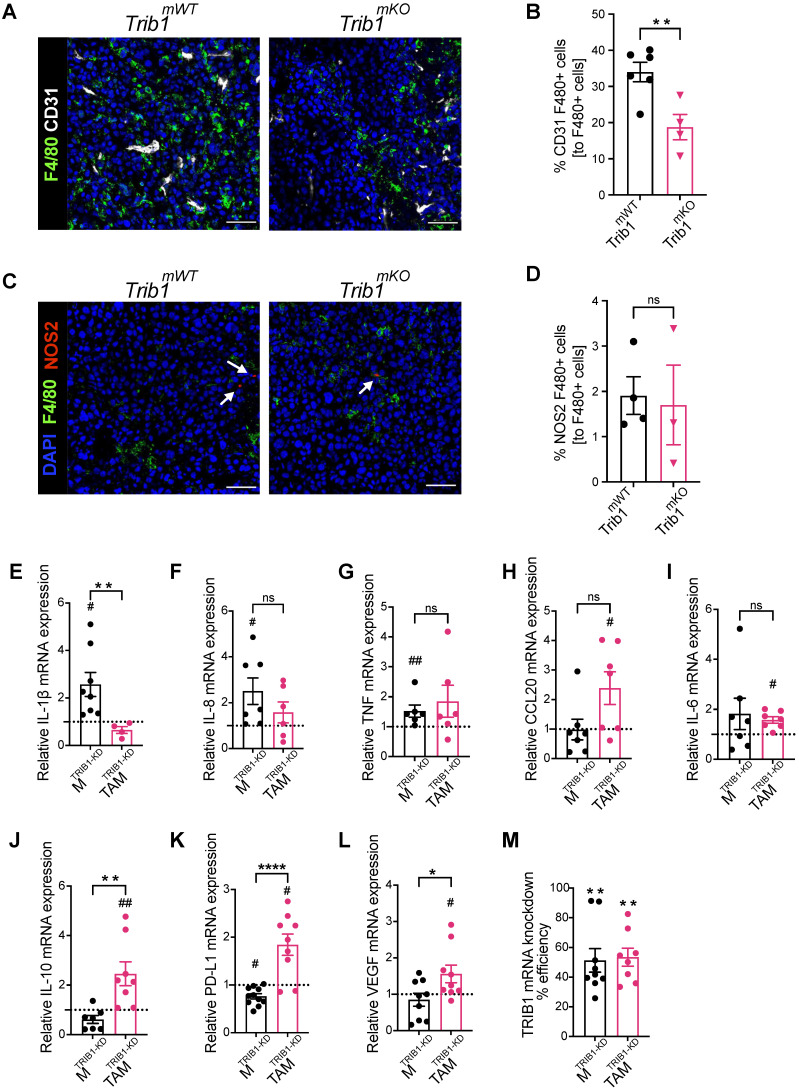
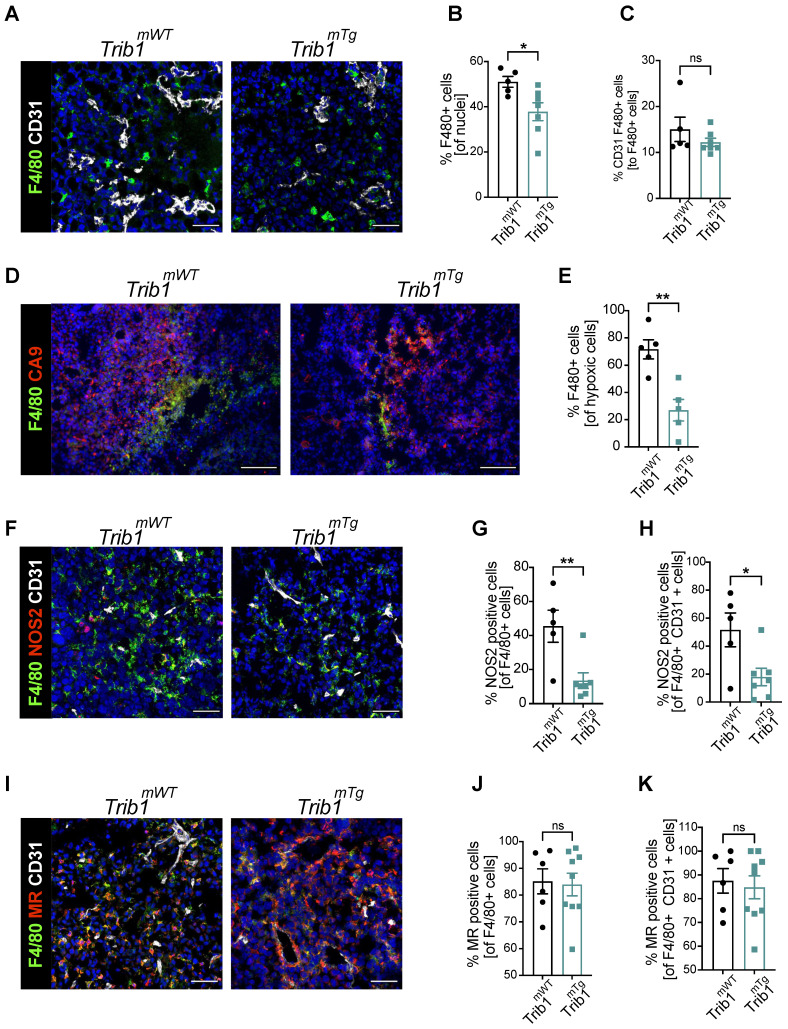
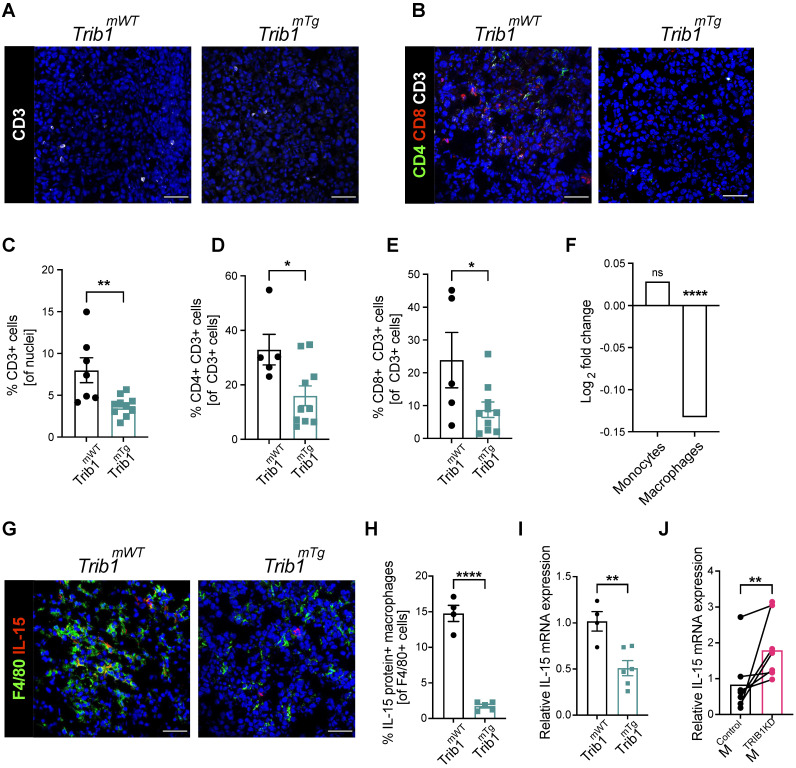
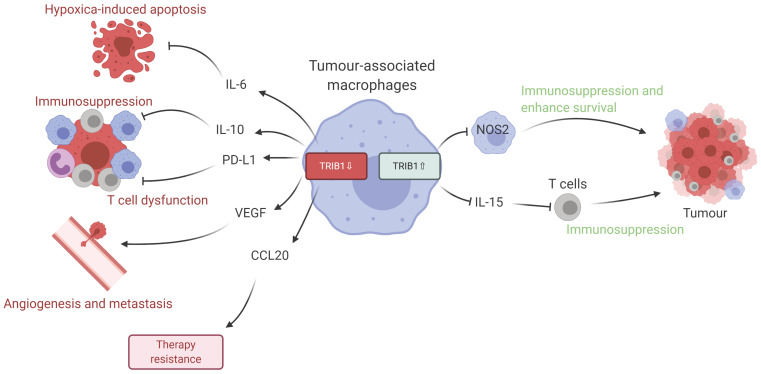
Molecular mechanisms that regulate tumor-associated macrophage (TAM) phenotype and function are incompletely understood. The pseudokinase TRIB1 has been reported as a regulator of macrophage phenotypes, both in mouse and human systems. Methods: Bioinformatic analysis was used to investigate the link between TRIB1 expression in breast cancer and therapeutic response to chemotherapy. In vivo models of breast cancer included immune-competent mice to characterize the consequences of altered (reduced or elevated) myeloid Trib1 expression on tumor growth and composition of stromal immune cell populations. Results: TRIB1 was highly expressed by TAMs in breast cancer and high TRIB1 expression correlated with response to chemotherapy and patient survival. Both overexpression and knockout of myeloid Trib1 promote mouse breast tumor growth, albeit through different molecular mechanisms. Myeloid Trib1 deficiency led to an early acceleration of tumor growth, paired with a selective reduction in perivascular macrophage numbers in vivo and enhanced oncogenic cytokine expression in vitro. In contrast, elevated levels of Trib1 in myeloid cells led to an increased late-stage mammary tumor volume, coupled with a reduction of NOS2 expressing macrophages and an overall reduction of macrophages in hypoxic tumor regions. In addition, we show that myeloid Trib1 is a previously unknown, negative regulator of the anti-tumor cytokine IL-15, and that increased myeloid Trib1 expression leads to reduced IL-15 levels in mammary tumors, with a consequent reduction in the number of T-cells that are key to anti-tumor immune responses. Conclusions: Together, these results define a key role for TRIB1 in chemotherapy responses for human breast cancer and provide a mechanistic understanding for the importance of the control of myeloid TRIB1 expression in the development of this disease.

Keywords: Breast cancer; TRIB1; interleukin 15; response to chemotherapy; tribbles; tumor associated macrophages.


Conflict of interest statement

Competing Interests: The authors have declared that no competing interest exists.

Figures

Figure 1
Figure 1
TRIB1 is associated with overall BC survival and 5-years relapse-free cancer survival after chemotherapy and is a highly expressed protein in Tumor-Associated Macrophages. (A) TRIB1 mutation-harboring tumors are associated with a poor long-term BC survival. Kapplan-Maier survival plot, Hazard Ratio (HR) and log rank p value are displayed. Red line represents patients harboring the transcriptomic fingerprint of TRIB1 somatic mutants vs. wild type TRIB represented by a black line. (B) TRIB1 expression in 5-year relapse-free BC survival after anthracycline-based chemotherapy. Note that enhanced TRIB1 expression correlates with a higher 5-year relapse-free BC survival after anthracycline-based chemotherapy. Receiver Operating characteristic (ROC) curves are shown. Area under the curve (AUC), p value, false positive rate (FPR) and true positive rate (TPR). (B) All breast cancer patients, (C) basal-like and (D) luminal-B subtypes. (E) Representative image of macrophages in human breast cancer marked with CD68 (red) and TRIB1 (green) (Scale: 100 µm). Quantification of TRIB1 expressing cells and CD68+ cells in the TMA from “E” relative to total cell counts. Data presented as mean±SD. Cells in 5 random fields of views for each tumor were manually quantified using ImageJ. (F) Representative image of TRIB1 (red) and F4/80 (green) fluorescence staining of primary murine breast tumors from wild-type (C57/BL6) animals (Scale: 50 µm). Quantification of TRIB1 expressing cells and F4/80+ cells in the TME from “F” relative to total cell counts (n=5 mice/group). Data presented as mean±SEM. Cells in 5 random fields of views for each animal were manually quantified using ImageJ. (G) Human MDMs isolated from healthy donors were transfected with either control (MControl) or TRIB1 siRNA for 48 hours (MTRIB1-KD). Results of paired t-tests are presented; mean±SEM is plotted; *p < 0.05, **p < 0.01 (n= 6-9 donor/group). (H) Pathway analysis of TRIB1 associated genes in monocytes and MDMs in participants of the Cardiogenics Transcriptomic Study. MDM (n= 596) and monocytes (n= 758) were ranked according to TRIB1 RNA levels and genes that were differentially expressed between the top vs. bottom 25% of the rankings were analyzed with QuSAGE. The 10 most significantly enriched pathways in MDMs are presented. (I) TRIB1 RNA levels of human MDMs unstimulated (M) and stimulated with LPS and INF-γ (MLPS+INF-γ), IL-4 (MIL-4), and CM (MCM) for 24 hours. Results of Friedman test and Dunn's multiple comparison tests are presented; mean±SEM is plotted; *p < 0.05 (n = 6 donors/group).
Figure 2
Figure 2
Reduced myeloid Trib1 expression accelerates breast tumor growth and inhibits myeloid cell infiltration into the TME. (A) Development of BC models with altered myeloid Trib1 expression: Murine BC E0771 cells were injected to the mammary fat pad of myeloid-specific Trib1 knockout (Trib1mKO) and transgenic (Trib1mTg) mice and their respective wild-type (Trib1mWT) litter-mate controls at the age of 8 weeks. Data was accumulated from > 5 independent experiments, each containing several littermates, including both wild type and mTrib1-altered mice. (B) mTrib1-altered mice developing mammary tumor were routinely monitored and tumor volume was calculated. Trib1mTg and Trib1mKO and their litter-mate controls were sacrificed when the tumor reached 15mm in diameter (Trib1mKO = 22 days; Trib1mTg = 30 days) and results analyzed by two-way ANOVA; mean±SEM i is plotted; *p < 0.05, **p < 0.01, ***p < 0.001, ****p < 0.0001 (Trib1mKO n = 5 mice/group; Trib1mTg n = 12 mice/group, Trib1wt n = 20 mice/group). (C) Post-mortem analysis of immune cell content in Trib1mKO and respective Trib1mWT tumors by flow cytometry. Cell markers Ly-6C, F4/80, NK1.1, Ly-6G, CD3 were used to measure the proportion of immune cells (D-H) Quantification of immune cell content in Trib1mKO and respective Trib1mWT tumors. Results of Welch's t-test are presented; mean±SEM is plotted; *p < 0.05 (n = 3 mice/group).
Figure 3
Figure 3
Myeloid Trib1 knockout inhibits perivascular TAM infiltration, and TRIB1 knockdown in TAMs enhances oncogenic cytokine expression. (A) Representative images of CD31 (white) and F4/80 (green) fluorescence staining in Trib1mKO and respective Trib1mWT tumors (Scale: 50 µm); (B) Quantification of perivascular TAMs (F4/80+ CD31+) in Trib1mKO tumors relative to the total number of F4/80+ TAMs. Cell numbers were quantified manually from 5 randomly taken field of views using ImageJ. Results of unpaired t-test are presented; mean±SEM is plotted; **p < 0.01 (n = 4-6 mice/group); (C) NOS2 (red) and F4/80 (green) fluorescence staining in Trib1mKO and respective Trib1mWT tumors (Scale: 50 µm). NOS2 (red) staining is marked with white arrows. (D) Quantification of pro-inflammatory TAMs (F4/80+ NOS2+) in Trib1mKO tumors relative to the total number of F4/80+ TAMs. Cell numbers were quantified manually from 5 randomly taken field of views using ImageJ. Results of unpaired t-test are presented; mean±SEM is plotted (n = 3-4 mice/group). (E-M) Human MDMs isolated and differentiated from blood were transfected with either non-targeting control or TRIB1 siRNA for 48 hours and either left unpolarized or polarized to TAMs using the CM for 24 hours. (E-L) Expression values of TRIB1 knockdown M and TAMs were initially compared to their controls (shown as fold difference to the dotted line), followed by analysis of difference between MTRIB1-KD and TAMTRIB1-KD. (M) The efficiency of TRIB1 siRNA transfection 48 hours after TRIB1 siRNA transfection (MTRIB1-KD) and TAM polarization (TAMTRIB1-KD) were assessed. Results of paired and unpaired t-tests are presented; mean±SEM is plotted; *p < 0.05, **p < 0.01, ****p < 0.0001 represent p-values between MTRIB1-KD vs. TAMTRIB1-KD whilst #p < 0.05 ##p < 0.005 represent p-values of MTRIB1-KD and TAMTRIB1-KD to their respective control (MControl and TAMControl) (n = 4-9 donor/group).
Figure 4
Figure 4
Overexpression of myeloid Trib1 reduces hypoxic TAM numbers in the TME and inhibits TAM polarization towards a pro-inflammatory phenotype. Post-mortem analysis of TAMs and their subtypes based on the location and phenotypes using immunofluorescence staining. (A) Representative images of perivascular TAM CD31 (white) and F4/80 (green) (Scale: 50 µm), (D) hypoxic TAM CA9 (red) and F4/80 (green) (Scale: 100 µm), (F) pro-inflammatory TAM CD31 (white), NOS2 (red), and F4/80 (green) (Scale: 50 µm), and (I) anti-inflammatory TAM CD31 (white), MR (red), and F4/80 (green) (Scale: 50 µm) in Trib1mWT and Trib1mTg tumors. Cells were quantified manually from 4-5 randomly taken fields of view using ImageJ. Percentage of TAMs and TAMs classified based on their location (vessels and hypoxia) were Trib1 overexpression inhibited TAMs, both perivascular and hypoxic TAMs, pro-inflammatory TAMs and pro-inflammatory TAMs in the vessels in tumors compared to WT (B, C, E, G, H respectively). Percentage of anti-inflammatory TAMs did not alter in Trib1mTg (J, K). Results of unpaired t-test are presented; mean±SEM is plotted; *p < 0.05 **p < 0.01 (n = 5-9 mice/group).
Figure 5
Figure 5
Myeloid Trib1 overexpression impairs IL-15 expression and significantly reduces T-cells in the TME. (A-B) Representative images of CD3 (white) staining in Trib1mTg and respective Trib1mWT tumors (Scale: 50 µm); and CD3 (white), CD4 (green), and CD8 (red) fluorescence staining in Trib1mTg and respective Trib1mWT tumors (Scale: 50 µm). Cells were quantified manually from 4-5 randomly taken field of views using ImageJ. (C) Quantification of T-cells (n = 7-10 mice/group), and (D, E) CD4+ naïve and CD8+ cytotoxic T-cells (n = 5-11 mice/group) in Trib1mTg and respective Trib1mWT tumors. Results of unpaired t-test is presented; mean±SEM is plotted; *p < 0.05, **p < 0.01. (F) IL-15 expression in human monocytes and MDMs from participants of the Cardiogenics Transcriptomic Study. MDM (n= 596) and monocytes (n = 758) were ranked according to TRIB1 RNA levels and IL-15 expressed between the top vs. bottom 25% of the samples were plotted. Results of FDR adjusted p-values are presented as ****p < 0.0001. (G) Representative images of IL-15 (red) and F4/80 (green) fluorescence staining in Trib1mTg and respective Trib1mWT tumors (Scale: 50 µm). Cells were quantified manually from 4 randomly taken field of views using ImageJ. (H) Quantification of TAMs expressing IL-15 in Trib1mTg and respective Trib1mWT TME relative to the total number of TAMs. Results of unpaired t-test is presented; mean±SEM is plotted; ****p < 0.0001 (n = 4-5 mice/group). (I) Mouse BMDMs isolated from Trib1mWT and Trib1mTg animals were analyzed with RT-qPCR. RNA level of Il-15 in mouse BMDMs. Results of unpaired t-test is presented; mean±SEM is plotted; **p < 0.01 (n = 4-6 mice/group). (J) Human MDMs isolated and differentiated from blood were transfected with either control or TRIB1 siRNA for 48 hours and IL-15 RNA expression was analyzed. Results of paired t-test is presented; mean is plotted; **p < 0.01 (n= 6 donor/group).
Figure 6
Figure 6
Schematic representation of TRIB1 mediated TAM regulation. Alteration of TRIB1 distinctly regulates TAMs to enhance tumor growth. Reduction of TRIB1 accelerates oncogenic cytokine IL-6, IL-10, CCL20, PD-L1, and VEGF expressions in TAMs which take part in the inhibition of cell apoptosis, immune cell dysfunction, angiogenesis, and develop resistance to therapies. Whilst the overexpression inhibits pro-inflammatory TAM in the TME to suppress the immune response and enhance cancer cell survival. TRIB1 conversely influence IL-15 expression, which reduces T cell infiltration and potentially disrupts T cell-induced immune responses.

References

    1. Torre LA, Bray F, Siegel RL, Ferlay J, Lortet-Tieulent J, Jemal A. Global cancer statistics, 2012. CA Cancer J Clin. 2015;65:87–108. - PubMed
    1. Feng Y, Spezia M, Huang S, Yuan C, Zeng Z, Zhang L. et al. Breast cancer development and progression: Risk factors, cancer stem cells, signaling pathways, genomics, and molecular pathogenesis. Genes Dis. 2018;5:77–106. - PMC - PubMed
    1. Sin WC, Lim CL. Breast cancer stem cells-from origins to targeted therapy. Stem Cell Investig. 2017;4:96. - PMC - PubMed
    1. Chen F, Zhuang X, Lin L, Yu P, Wang Y, Shi Y. et al. New horizons in tumor microenvironment biology: challenges and opportunities. Bmc Medicine. 2015;13:45. - PMC - PubMed
    1. Guo Q, Jin Z, Yuan Y, Liu R, Xu T, Wei H. et al. New Mechanisms of Tumor-Associated Macrophages on Promoting Tumor Progression: Recent Research Advances and Potential Targets for Tumor Immunotherapy. Journal of immunology research. 2016;2016:9720912. - PMC - PubMed

Publication types