

Reduction in thermal stress of marine copepods after physiological acclimation
- PMID: 35664084
- PMCID: PMC9155217
- DOI: 10.1093/plankt/fbac017
Reduction in thermal stress of marine copepods after physiological acclimation
Abstract
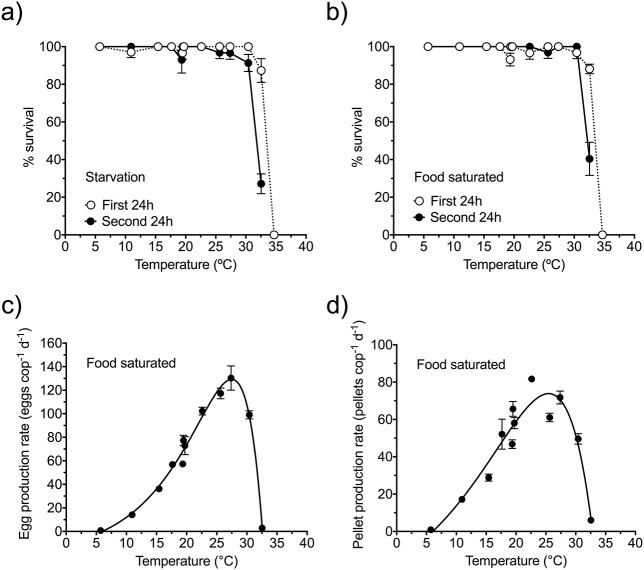
We studied the phenotypic response to temperature of the marine copepod Paracartia grani at the organismal and cellular levels. First, the acute (2 days) survival, feeding and reproductive performances at 6-35°C were determined. Survival was very high up to ca. 30°C and then dropped, whereas feeding and fecundity peaked at 23-27°C. An acclimation response developed after longer exposures (7 days), resulting in a decline of the biological rate processes. As a consequence, Q10 coefficients dropped from 2.6 to 1.6, and from 2.7 to 1.7 for ingestion and egg production, respectively. Due to the similarity in feeding and egg production thermal responses, gross-growth efficiencies did not vary with temperature. Respiration rates were less sensitive (lower Q10) and showed an opposite pattern, probably influenced by starvation during the incubations. The acclimation response observed in the organismal rate processes was accompanied by changes in body stoichiometry and in the antioxidant defense and cell-repair mechanisms. Predictions of direct effects of temperature on copepod performance should consider the reduction of Q10 coefficients due to the acclimation response. Copepod population dynamic models often use high Q10 values and may overestimate thermal effects.
Keywords: Paracartia grani; Q10; oxidative stress; temperature; thermal performance curves.
© The Author(s) 2022. Published by Oxford University Press.
Figures


References
-
- Acheampong, E., Hense, I. and St. John, M. A. (2014) A model for the description of feeding regulation by mesozooplankton under different conditions of temperature and prey nutritional status. Ecol. Model., 272, 84–97.
-
- Alcaraz, M., Felipe, J., Grote, U., Arashkevich, E. and Nikishina, A. (2014) Life in a warming ocean: thermal thresholds and metabolic balance of arctic zooplankton. J. Plankton Res., 36, 3–10.
-
- Almeda, R., Alcaraz, M., Calbet, A. and Saiz, E. (2011) Metabolic rates and carbon budget of early developmental stages of the marine cyclopoid copepod Oithona davisae. Limnol. Oceanogr., 56, 403–414.
-
- Anraku, M. (1964) Influence of the Cape Cod Canal on the hydrography and on the copepods in Buzzards Bay and Cape Cod Bay, Massachusetts. II. Respiration and feeding. Limnol. Oceanogr., 9, 195–206.
-
- Bagnyukova, T. V., Lushchak, O. V., Storey, K. B. and Lushchak, V. I. (2007) Oxidative stress and antioxidant defense responses by goldfish tissues to acute change of temperature from 3 to 23°C. J. Therm. Biol., 32, 227–234.
LinkOut - more resources
Full Text Sources
Research Materials
