

Relationship Between Lipid Profiles and Hypertension: A Cross-Sectional Study of 62,957 Chinese Adult Males
- PMID: 35664125
- PMCID: PMC9159857
- DOI: 10.3389/fpubh.2022.895499
Relationship Between Lipid Profiles and Hypertension: A Cross-Sectional Study of 62,957 Chinese Adult Males
Abstract
Background: Patterns of dyslipidemia and incidence of hypertension have been rarely reported in Asian populations with inconsistent findings. To accumulate further evidence in Asian populations, the study aimed to investigate the relationship between lipid profiles and hypertension in Chinese adult males.
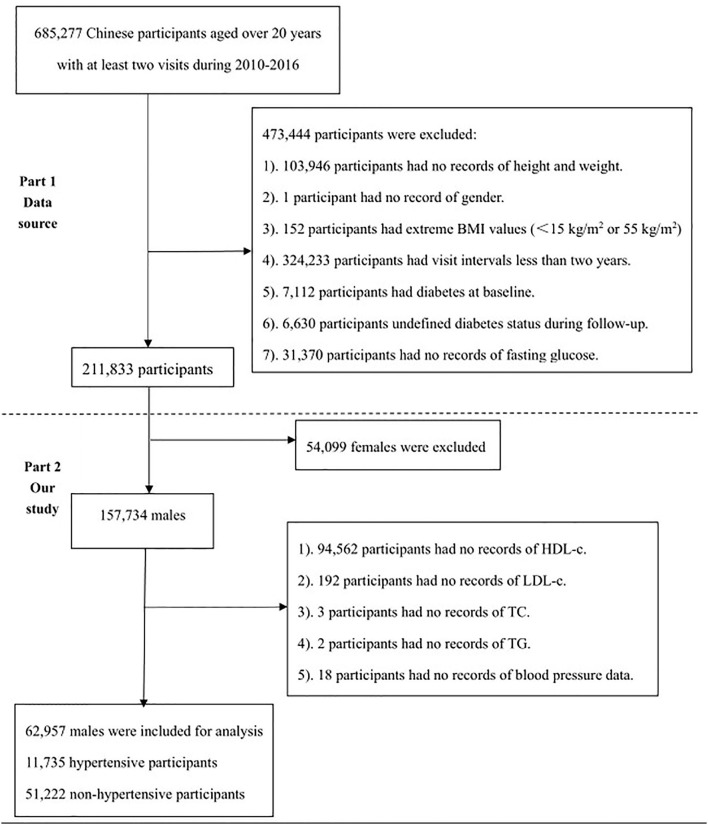
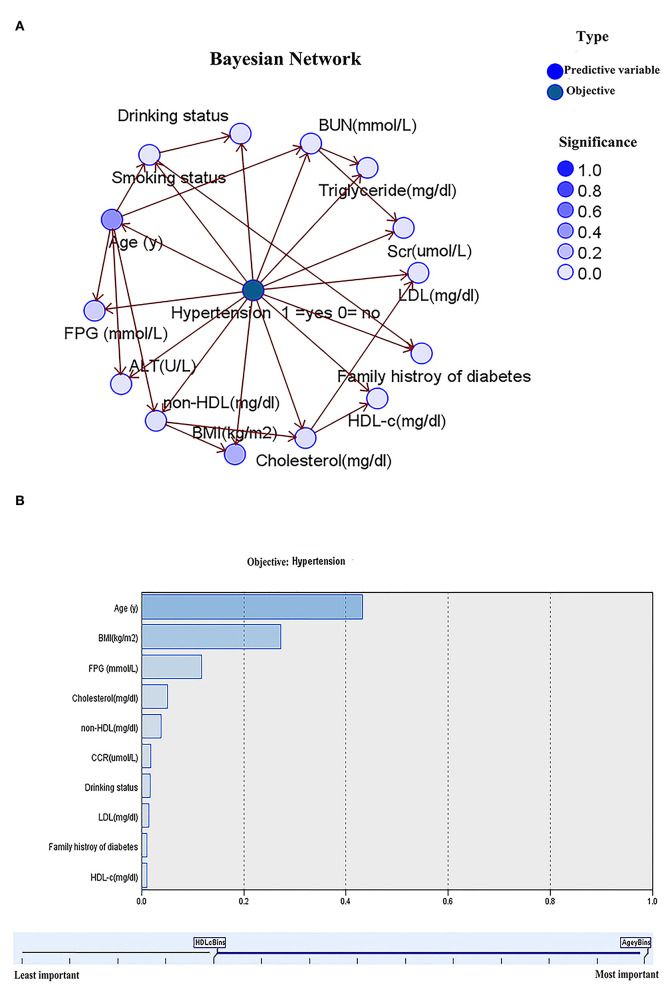
Methods: We conducted a cross-sectional study based on the data from the DATADRYAD database. The overall population was divided into hypertensive and non-hypertensive groups based on baseline blood pressure levels. For continuous variables, Mann-Whitney test was performed between two groups, while Kruskal-Wallis and Dunn tests were used among multiple groups. The chi-square test was carried out for dichotomous variables. Spearman's correlation coefficient was employed to assess the association between systolic blood pressure (SBP), diastolic blood pressure (DBP) and lipid profiles, whereas the relationship between lipid profiles and the incidence of hypertension was evaluated using multivariate logistic regression. The Bayesian network (BN) model was adopted to investigate the relationship between clinical characteristics and hypertension, and the importance of related predictor to the incidence of hypertension was obtained to make conditional probability analysis.
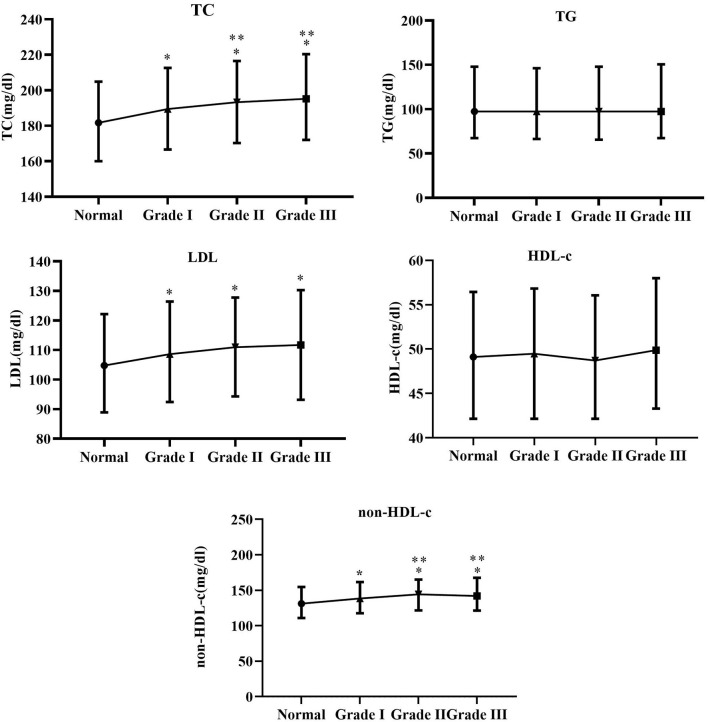
Results: Finally, totally 62,957 participants were included in this study. In the lipid profiles, total cholesterol (TC), low-density cholesterol (LDL-c), and non- high-density lipoprotein cholesterol (non-HDL-c) were higher in the hypertensive population (p <0.001). In the fully multivariate model, for every 1 mg/dl increase in TC, LDL-c and non-HDL, the risk of hypertension increased by 0.2% [1.002 (1.001-1.003)], 0.1% [1.001 (1.000-1.002)], and 0.1% [1.001 (1.000-1.002)]. Meanwhile, HDL-c became positively associated with the incidence of hypertension (p for trend < 0.001) after adjusting for the body mass index (BMI), and 1 mg/dl increment in HDL-c increased the risk of hypertension by 0.2% [1.002 (1.000-1.002)] after fully adjusting for multiple variables. Furthermore, the BN showed that the importance of age, BMI, fasting plasma glucose (FPG), and TC to the effect of hypertension is 43.3, 27.2, 11.8, and 5.1%, respectively.
Conclusion: Elevated TC, LDL-c, and non-HDL-c were related to incidence of hypertension in Chinese adult males, whereas triglycerides (TG) was not significantly associated. The relationship between HDL-c and hypertension incidence shifted from no association to a positive correlation after adjusting for the BMI. Moreover, the BN model displayed that age, the BMI, FPG, and TC were strongly associated with hypertension incidence.
Keywords: high-density lipoprotein cholesterol; hypertension; lipids; low-density cholesterol; total cholesterol; triglycerides.
Copyright © 2022 Chen and Cheng.
Conflict of interest statement
The authors declare that the research was conducted in the absence of any commercial or financial relationships that could be construed as a potential conflict of interest.
Figures
References
-
- Lu J, Lu Y, Wang X, Li X, Linderman GC, Wu C, et al. . Prevalence, awareness, treatment, and control of hypertension in China: data from 1·7 million adults in a population-based screening study (China PEACE Million Persons Project). Lancet. (2017) 390:2549–58. 10.1016/S0140-6736(17)32478-9 - DOI - PubMed
Publication types
MeSH terms
Substances
LinkOut - more resources
Full Text Sources
Medical
Miscellaneous