Identification of mRNA Signature for Predicting Prognosis Risk of Rectal Adenocarcinoma
- PMID: 35664306
- PMCID: PMC9159392
- DOI: 10.3389/fgene.2022.880945
Identification of mRNA Signature for Predicting Prognosis Risk of Rectal Adenocarcinoma
Abstract
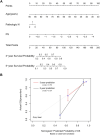
Background: The immune system plays a crucial role in rectal adenocarcinoma (READ). Immune-related genes may help predict READ prognoses. Methods: The Cancer Genome Atlas dataset and GSE56699 were used as the training and validation datasets, respectively, and differentially expressed genes (DEGs) were identified. The optimal DEG combination was determined, and the prognostic risk model was constructed. The correlation between optimal DEGs and immune infiltrating cells was evaluated. Results: Nine DEGs were selected for analysis. Moreover, ADAMDEC1 showed a positive correlation with six immune infiltrates, most notably with B cells and dendritic cells. F13A1 was also positively correlated with six immune infiltrates, particularly macrophage and dendritic cells, whereas LGALS9C was negatively correlated with all immune infiltrates except B cells. Additionally, the prognostic risk model was strongly correlated with the actual situation. We retained only three prognosis risk factors: age, pathologic stage, and prognostic risk model. The stratified analysis revealed that lower ages and pathologic stages have a better prognosis with READ. Age and mRNA prognostic factors were the most important factors in determining the possibility of 3- and 5-year survival. Conclusion: In summary, we identified a nine-gene prognosis risk model that is applicable to the treatment of READ. Altogether, characteristics such as the gene signature and age have a strong predictive value for prognosis risk.
Keywords: immune; immune infiltrate; mRNA signature; prognosis; rectum adenocarcinoma.
Copyright © 2022 Jiang, Wang, Su, Yang and Wang.
Conflict of interest statement
The authors declare that the research was conducted in the absence of any commercial or financial relationships that could be construed as a potential conflict of interest.
Figures


Similar articles
-
Identification of a 5-Gene-Based Scoring System by WGCNA and LASSO to Predict Prognosis for Rectal Cancer Patients.Anal Cell Pathol (Amst). 2021 Mar 23;2021:6697407. doi: 10.1155/2021/6697407. eCollection 2021. Anal Cell Pathol (Amst). 2021. PMID: 33833937 Free PMC article.
-
Identification of prognostic gene signature associated with microenvironment of lung adenocarcinoma.PeerJ. 2019 Nov 29;7:e8128. doi: 10.7717/peerj.8128. eCollection 2019. PeerJ. 2019. PMID: 31803536 Free PMC article.
-
Combination of tumor mutation burden and immune infiltrates for the prognosis of lung adenocarcinoma.Int Immunopharmacol. 2021 Sep;98:107807. doi: 10.1016/j.intimp.2021.107807. Epub 2021 Jun 25. Int Immunopharmacol. 2021. PMID: 34175739
-
A novel immunogenomic signature to predict prognosis and reveal immune infiltration characteristics in pancreatic ductal adenocarcinoma.Precis Clin Med. 2022 Apr 25;5(2):pbac010. doi: 10.1093/pcmedi/pbac010. eCollection 2022 Jun. Precis Clin Med. 2022. PMID: 35694712 Free PMC article.
-
A robust twelve-gene signature for prognosis prediction of hepatocellular carcinoma.Cancer Cell Int. 2020 Jun 3;20:207. doi: 10.1186/s12935-020-01294-9. eCollection 2020. Cancer Cell Int. 2020. PMID: 32514252 Free PMC article.
Cited by
-
A transcriptomic score to classify the inflammation-dysplasia-cancer sequence lesions in inflammatory bowel disease.J Crohns Colitis. 2025 Mar 5;19(3):jjaf026. doi: 10.1093/ecco-jcc/jjaf026. J Crohns Colitis. 2025. PMID: 39945142
-
Unraveling dynamic interactions between tumor-associated macrophages and consensus molecular subtypes in colorectal cancer: An integrative analysis of single-cell and bulk RNA transcriptome.Heliyon. 2023 Aug 18;9(9):e19224. doi: 10.1016/j.heliyon.2023.e19224. eCollection 2023 Sep. Heliyon. 2023. PMID: 37662758 Free PMC article.
-
Clinical prognostic value of OSGIN2 in gastric cancer and its proliferative effect in vitro.Sci Rep. 2023 Apr 8;13(1):5775. doi: 10.1038/s41598-023-32934-5. Sci Rep. 2023. PMID: 37031243 Free PMC article.
References
-
- Alame M., Cornillot E., Cacheux V., Rigau V., Costes-Martineau V., Lacheretz-Szablewski V., et al. (2021). The Immune Contexture of Primary central Nervous System Diffuse Large B Cell Lymphoma Associates with Patient Survival and Specific Cell Signaling. Theranostics 11 (8), 3565–3579. 10.7150/thno.54343 - DOI - PMC - PubMed
LinkOut - more resources
Full Text Sources
Miscellaneous

