. 2022 Jun 1:2:62.
doi: 10.1038/s43856-022-00124-5. eCollection 2022.

Antibiotic-resistant organisms establish reservoirs in new hospital built environments and are related to patient blood infection isolates

Affiliations

Antibiotic-resistant organisms establish reservoirs in new hospital built environments and are related to patient blood infection isolates

Kimberley V Sukhum et al. Commun Med (Lond). .

Abstract

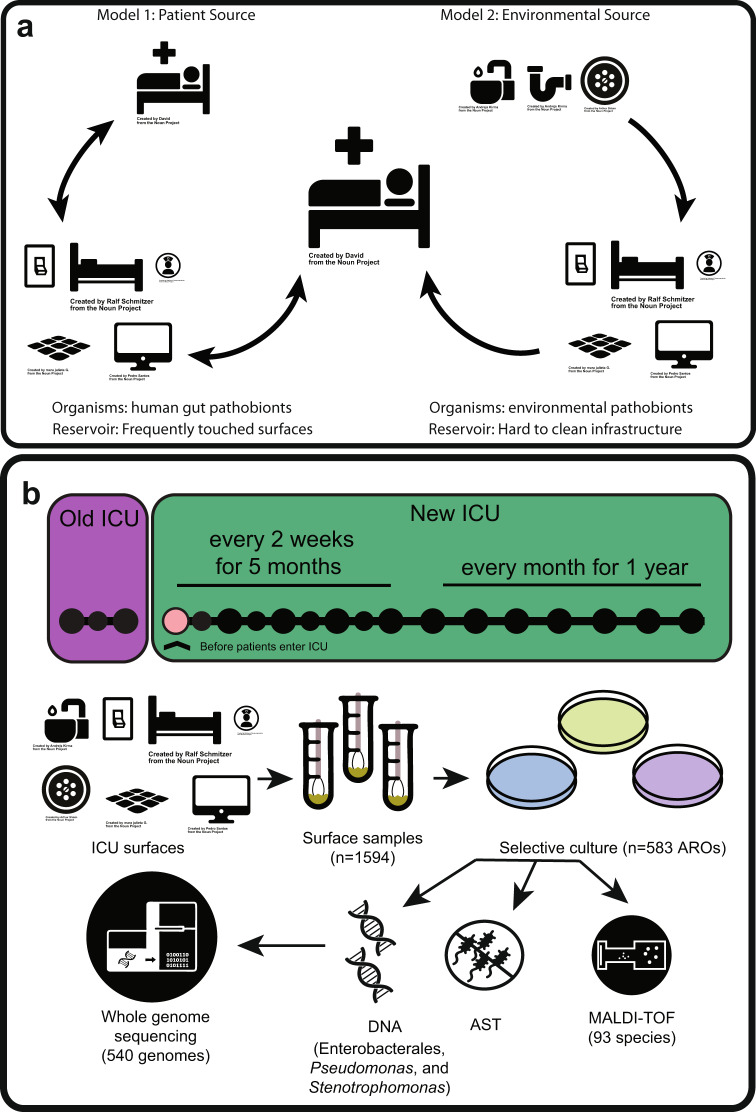
Background: Healthcare-associated infections due to antibiotic-resistant organisms pose an acute and rising threat to critically ill and immunocompromised patients. To evaluate reservoirs of antibiotic-resistant organisms as a source of transmission to patients, we interrogated isolates from environmental surfaces, patient feces, and patient blood infections from an established and a newly built intensive care unit.

Methods: We used selective culture to recover 829 antibiotic-resistant organisms from 1594 environmental and 72 patient fecal samples, in addition to 81 isolates from blood cultures. We conducted antibiotic susceptibility testing and short- and long-read whole genome sequencing on recovered isolates.

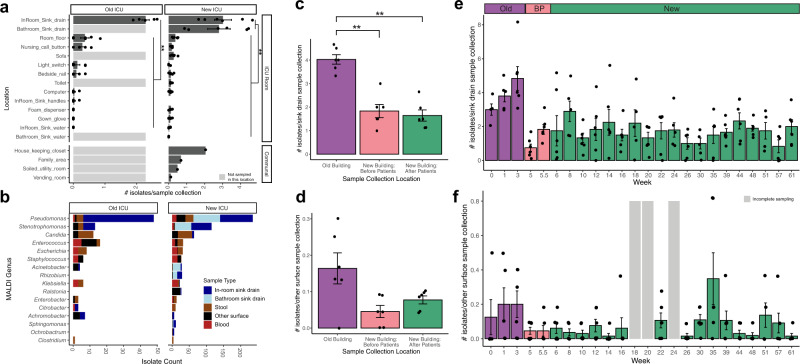
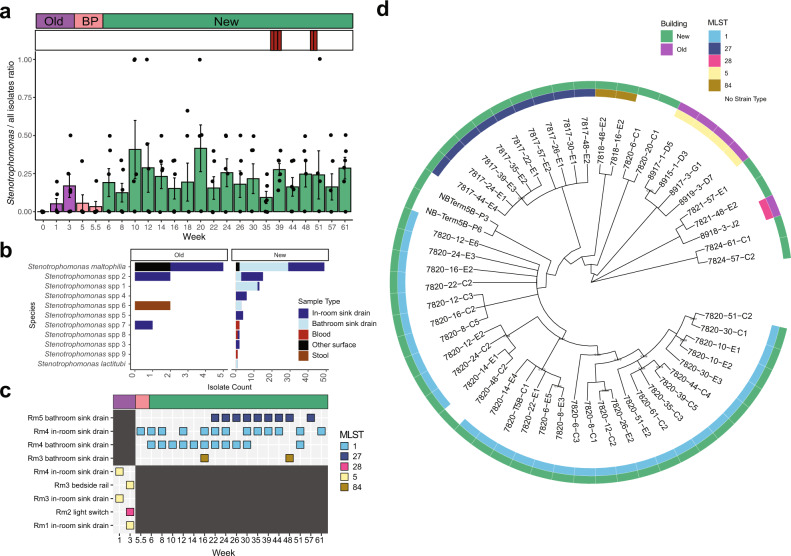
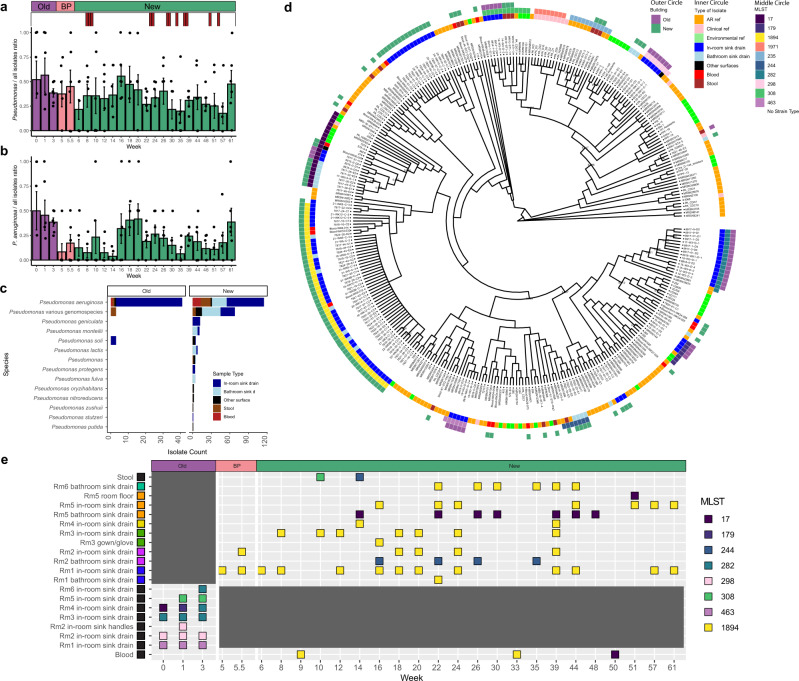
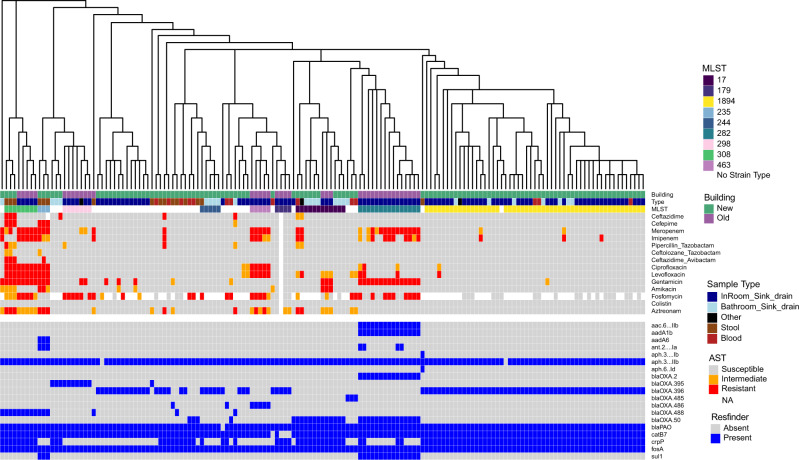
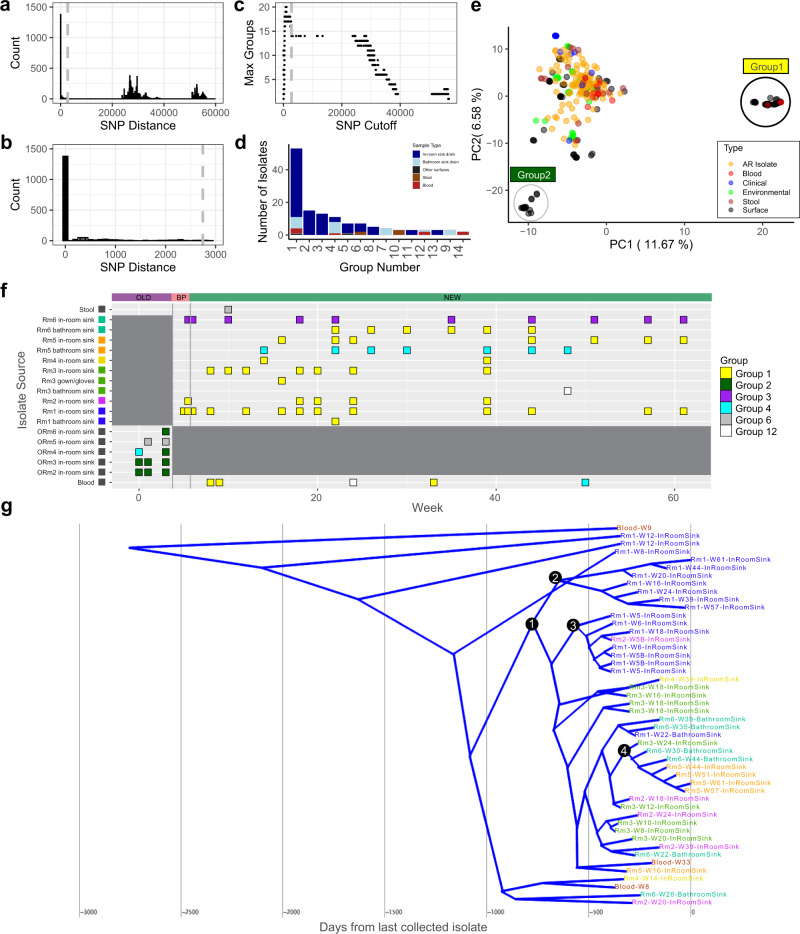
Results: Antibiotic-resistant organism burden is highest in sink drains compared to other surfaces. Pseudomonas aeruginosa is the most frequently cultured organism from surfaces in both intensive care units. From whole genome sequencing, different lineages of P. aeruginosa dominate in each unit; one P. aeruginosa lineage of ST1894 is found in multiple sink drains in the new intensive care unit and 3.7% of blood isolates analyzed, suggesting movement of this clone between the environment and patients.

Conclusions: These results highlight antibiotic-resistant organism reservoirs in hospital built environments as an important target for infection prevention in hospitalized patients.

Keywords: Antimicrobial resistance; Comparative genomics; Disease prevention; Genetic variation; Infectious-disease epidemiology.


Conflict of interest statement

Competing interestsThe authors declare no competing interests.

Figures

Fig. 1
Fig. 1. ARO reservoir colonization models and sample processing scheme.
a Two models of reservoir colonization. Model 1 shows antibiotic-resistant organism (ARO) transmission from patients to hospital surfaces and then to other patients. Model 2 shows ARO transmission from environmental reservoirs to hospital surfaces to patients. b Sample collection time points and sample processing scheme from surface collections to WGS. In sample collection scheme, large circles represent months with small circles representing 2-week sampling within months. Purple indicates old intensive care unit (ICU) collections, green indicates new ICU collections, and pink indicates collections taken before patients enter the building in the new ICU. Icons labeled as such were acquired from nounproject.com, and other icons were used with permission from D’Souza, Potter et al.. AST antibiotic susceptibility testing, MALDI-TOF matrix-assisted laser desorption/ionization-time of flight mass spectrometry.
Fig. 2
Fig. 2. Variation in isolate collection location, identity, and timing across all sampling.
Error bars indicate standard error of intensive care unit (ICU) rooms. ** indicates generalized linear mixed-modeling (GLMM) p-value <0.01. a In-room and bathroom sink drains have significantly more isolates per collection than other surface locations in both the old and new ICU buildings (n = 566 surface isolates). Locations in light gray were not collected in old ICU. b Genus of matrix-assisted laser desorption/ionization-time of flight mass spectrometry (MALDI-TOF) species identification of all collected isolates in both the new and old ICU. Other Surface includes all other surfaces that are not in-room or bathroom sink drain. c Variation in number of isolates collected per bathroom or in-room sink drain sample collection by building (excludes fecal and communal samples, n = 429). d Variation in number of isolates per other surface sample collection by building (excludes sink drain, fecal, and communal samples, n = 137). e Variation in number of isolates per bathroom or in-room sink drain sample collection for all time points, n = 429. f Variation in number of isolates collected per other surface sample collection across all time points (excludes sink drain, fecal, and communal samples, n = 137). Gray bars indicate weeks with incomplete sampling of surfaces. BP before patient and staff move-in.
Fig. 3
Fig. 3. Timing, identity, and phylogenetics of Stenotrophomonas isolates.
a Ratio of Stenotrophomonas isolates to all isolates across all time points (n = 128 Stenotrophomonas isolates). Error bars indicate standard error of intensive care unit (ICU) rooms. Red bars indicate collection timing of Stenotrophomonas blood culture isolates. b Identity of all collected Stenotrophomonas genomes by >95% average nucleotide identity (ANI) to reference genome by sample collection type (n = 128 isolates). Other Surface indicates all other surface/water genomes apart from in-room and bathroom sink drain. All genomes were identified as Stenotrophomonas by MASH. Stenotrophomonas various genomospecies includes all different genomospecies that did not share >95% ANI with a reference genome. c Time point mapping of shared S. maltophilia MLST groups by sample collection location. d Cladogram built from a core genome alignment of S. maltophilia genomes. Branches with less than 80% bootstrap support are collapsed. Branches with bootstrap values between 80–95% are labeled. BP before patient and staff move-in.
Fig. 4
Fig. 4. Timing, identity, and phylogenetics of Pseudomonas spp. isolates.
a Ratio of Pseudomonas spp. to all isolates across all time points (n = 283 Pseudomonas isolates). Error bars indicate standard error. Red bars indicate collection timing of Pseudomonas aeruginosa blood culture isolates. b Ratio of P. aeruginosa to all isolates across all time points (n = 155 P. aeruginosa isolates). Error bars indicate standard error. c Identity of all collected Pseudomonas spp. genomes by >95% ANI to reference genome by sample collection type. Other indicates all other surface/water genomes apart from in-room and bathroom sink drain. All genomes were identified as Pseudomonas spp. by MASH. Pseudomonas various genomospecies includes all different genomospecies that did not share >95% ANI with a reference genome. d Cladogram from a core genome alignment of P. aeruginosa genomes. Branches with less than 80% bootstrap support are collapsed. Branches with bootstrap values between 80–95% are labeled. Reference P. aeruginosa genomes included antibiotic-resistant (AR) isolates, clinical isolates, and environmental isolates. Reference MLST is included if it shares a MLST with collected isolates. e Time point mapping of top 8 MLST P. aeruginosa groups by sample collection location. BP before patient and staff move-in.
Fig. 5
Fig. 5. Phenotypic and genotypic antibiotic resistance of collected P. aeruginosa isolates.
Phylogenetic tree is from a core genome alignment. Phenotypic resistance determined by antibiotic susceptibility testing (AST). Genotypic resistance determined by Resfinder.
Fig. 6
Fig. 6. Highly-related genomic groups of P. aeruginosa across locations and time.
a Histogram of pairwise single nucleotide polymorphism (SNP) distances between P. aeruginosa genomes indicate three modes of pairwise distances. The first corresponds to highly-related genomic groups. We define group SNP threshold as pairwise distances that fall before 2743 (gray dashed line). b Zoomed in histogram of pairwise SNP distances between P. aeruginosa genome with a cut off at 3000 SNPs show only highly-related genomic groups. c Max groupings by SNP cut off show pairwise groups plateau at 2743 SNPs. d Number of isolates per highly-related genomic group. Other surfaces includes all other surfaces that are not in-room or bathroom sink drain. e First two components of principal component analysis (PCA) of the accessory genome of all P. aeruginosa genomes. Black circle encloses all Group 1 P. aeruginosa genomes. Gray circle encloses all Group 2 P. aeruginosa genomes. f Time point mapping of top 4 P. aeruginosa highly-related groups and highly-related groups that shared isolates between patient and surface samplings. g Time-measured phylogenetic analysis consensus tree of n = 48 Group 1 P. aeruginosa isolates depicted using DensiTree v2.2.7. Nodes labeled with black circles. Node 1 marks the main clade with a time since most recent common ancestor (TMRCA) of 778 days. BP before patient and staff move-in.

References

    1. Al-Tawfiq JA, Tambyah PA. Healthcare associated infections (HAI) perspectives. J. Infect. Public Health. 2014;7:339–344. doi: 10.1016/j.jiph.2014.04.003. - DOI - PubMed
    1. Ariza-Heredia EJ, Chemaly RF. Update on infection control practices in cancer hospitals. CA Cancer J. Clin. 2018;68:340–355. doi: 10.3322/caac.21462. - DOI - PMC - PubMed
    1. Burnham JP, Olsen MA, Kollef MH. Re-estimating annual deaths due to multidrug-resistant organism infections. Infect. Control Hosp. Epidemiol. 2019;40:112–113. doi: 10.1017/ice.2018.304. - DOI - PMC - PubMed
    1. Rosenthal VD, Guzman S, Migone O, Crnich CJ. The attributable cost, length of hospital stay, and mortality of central line-associated bloodstream infection in intensive care departments in Argentina: a prospective, matched analysis. Am. J. Infect. Control. 2003;31:475–480. doi: 10.1016/j.ajic.2003.03.002. - DOI - PubMed
    1. Giraldi G, Montesano M, Sandorfi F, Iachini M, Orsi GB. Excess length of hospital stay due to healthcare acquired infections: methodologies evaluation. Ann. Ig. 2019;31:507–516. - PubMed