

COVID-19 vaccine distribution planning using a congested queuing system-A real case from Australia
- PMID: 35664528
- PMCID: PMC9149026
- DOI: 10.1016/j.tre.2022.102749
COVID-19 vaccine distribution planning using a congested queuing system-A real case from Australia
Abstract
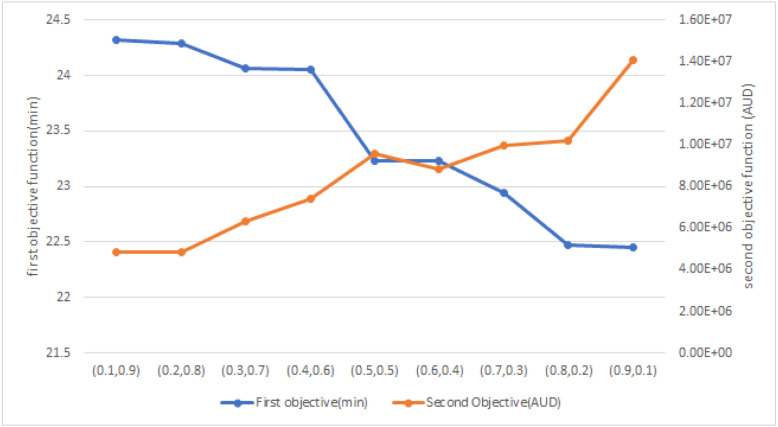
Crisis-induced vaccine supply chain management has recently drawn attention to the importance of immediate responses to a crisis (e.g., the COVID-19 pandemic). This study develops a queuing model for a crisis-induced vaccine supply chain to ensure efficient coordination and distribution of different COVID-19 vaccine types to people with various levels of vulnerability. We define a utility function for queues to study the changes in arrival rates related to the inventory level of vaccines, the efficiency of vaccines, and a risk aversion coefficient for vaccinees. A multi-period queuing model considering congestion in the vaccination process is proposed to minimise two contradictory objectives: (i) the expected average wait time of vaccinees and (ii) the total investment in the holding and ordering of vaccines. To develop the bi-objective non-linear programming model, the goal attainment algorithm and the non-dominated sorting genetic algorithm (NSGA-II) are employed for small- to large-scale problems. Several solution repairs are also implemented in the classic NSGA-II algorithm to improve its efficiency. Four standard performance metrics are used to investigate the algorithm. The non-parametric Friedman and Wilcoxon signed-rank tests are applied on several numerical examples to ensure the privilege of the improved algorithm. The NSGA-II algorithm surveys an authentic case study in Australia, and several scenarios are created to provide insights for an efficient vaccination program.
Keywords: COVID-19 pandemic; Crisis-induced vaccine supply chain; Goal attainment optimisation; NSGA-II; Queuing system.
© 2022 Elsevier Ltd. All rights reserved.
Conflict of interest statement
The authors declare that they have no known competing financial interests or personal relationships that could have appeared to influence the work reported in this paper.
Figures


References
-
- Abbasi B., Fadaki M., Kokshagina O., Saeed N., Chhetri P. 2020. Modeling vaccine allocations in the COVID-19 pandemic: A case study in Australia. Available at SSRN 3744520.
-
- Abrahams A.S., Ragsdale C.T. A decision support system for patient scheduling in travel vaccine administration. Decis. Support Syst. 2012;54(1):215–225.
-
- Arora H., Raghu T., Vinze A. Resource allocation for demand surge mitigation during disaster response. Decis. Support Syst. 2010;50(1):304–315.
LinkOut - more resources
Full Text Sources