

Influence of the Available Surface Area and Cell Elasticity on Bacterial Adhesion Forces on Highly Ordered Silicon Nanopillars
- PMID: 35664577
- PMCID: PMC9161423
- DOI: 10.1021/acsomega.2c00356
Influence of the Available Surface Area and Cell Elasticity on Bacterial Adhesion Forces on Highly Ordered Silicon Nanopillars
Abstract
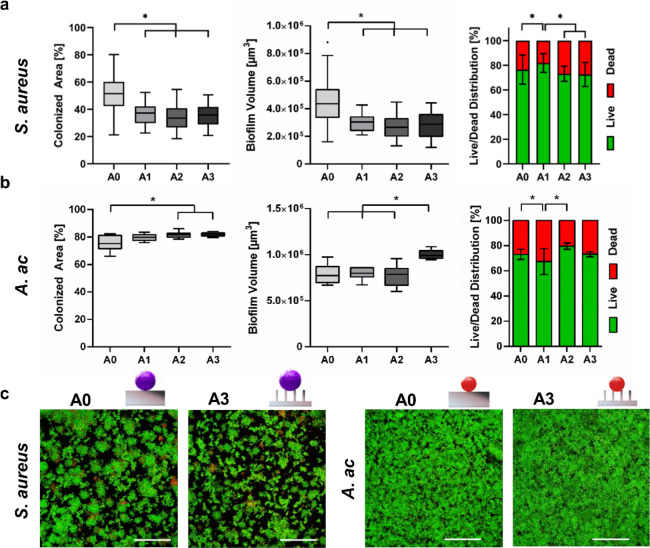
Initial bacterial adhesion to solid surfaces is influenced by a multitude of different factors, e.g., roughness and stiffness, topography on the micro- and nanolevel, as well as chemical composition and wettability. Understanding the specific influences and possible interactive effects of all of these factors individually could lead to guidance on bacterial adhesion and prevention of unfavorable consequences like medically relevant biofilm formation. On this way, the aim of the present study was to identify the specific influence of the available surface area on the adhesion of clinically relevant bacterial strains with different membrane properties: Gram-positive Staphylococcus aureus and Gram-negative Aggregatibacter actinomycetemcomitans. As model surfaces, silicon nanopillar specimens with different spacings were fabricated using electron beam lithography and cryo-based reactive ion etching techniques. Characterization by scanning electron microscopy and contact angle measurement revealed almost defect-free highly ordered nanotopographies only varying in the available surface area. Bacterial adhesion forces to these specimens were quantified by means of single-cell force spectroscopy exploiting an atomic force microscope connected to a microfluidic setup (FluidFM). The nanotopographical features reduced bacterial adhesion strength by reducing the available surface area. In addition, the strain-specific interaction in detail depended on the bacterial cell's elasticity and deformability as well. Analyzed by confocal laser scanning microscopy, the obtained results on bacterial adhesion forces could be linked to the subsequent biofilm formation on the different topographies. By combining two cutting-edge technologies, it could be demonstrated that the overall bacterial adhesion strength is influenced by both the simple physical interaction with the underlying nanotopography and its available surface area as well as the deformability of the cell.
© 2022 The Authors. Published by American Chemical Society.
Conflict of interest statement
The authors declare no competing financial interest.
Figures


Similar articles
-
Quantitative characterization of the influence of the nanoscale morphology of nanostructured surfaces on bacterial adhesion and biofilm formation.PLoS One. 2011;6(9):e25029. doi: 10.1371/journal.pone.0025029. Epub 2011 Sep 26. PLoS One. 2011. PMID: 21966403 Free PMC article.
-
Insights into complex nanopillar-bacteria interactions: Roles of nanotopography and bacterial surface proteins.J Colloid Interface Sci. 2021 Dec 15;604:91-103. doi: 10.1016/j.jcis.2021.06.173. Epub 2021 Jul 2. J Colloid Interface Sci. 2021. PMID: 34265695
-
Inhibition of bacterial adhesion and biofilm formation by dual functional textured and nitric oxide releasing surfaces.Acta Biomater. 2017 Mar 15;51:53-65. doi: 10.1016/j.actbio.2017.01.030. Epub 2017 Jan 10. Acta Biomater. 2017. PMID: 28087484 Free PMC article.
-
Statistical analysis of long- and short-range forces involved in bacterial adhesion to substratum surfaces as measured using atomic force microscopy.Appl Environ Microbiol. 2011 Aug;77(15):5065-70. doi: 10.1128/AEM.00502-11. Epub 2011 Jun 3. Appl Environ Microbiol. 2011. PMID: 21642399 Free PMC article. Review.
-
Physico-chemistry of bacterial transmission versus adhesion.Adv Colloid Interface Sci. 2017 Dec;250:15-24. doi: 10.1016/j.cis.2017.11.002. Epub 2017 Nov 5. Adv Colloid Interface Sci. 2017. PMID: 29129313 Review.
Cited by
-
Antimicrobial mechanisms of nanopatterned surfaces-a developing story.Front Chem. 2024 Jan 29;12:1354755. doi: 10.3389/fchem.2024.1354755. eCollection 2024. Front Chem. 2024. PMID: 38348407 Free PMC article. Review.
-
Organic particle scavenging by marine bacteria: influences of bacterial nanoscale surface properties.Appl Environ Microbiol. 2025 Jul 23;91(7):e0104925. doi: 10.1128/aem.01049-25. Epub 2025 Jun 16. Appl Environ Microbiol. 2025. PMID: 40521873 Free PMC article.
-
Prokaryotic Diversity and Community Distribution in the Complex Hydrogeological System of the Añana Continental Saltern.Microb Ecol. 2025 Jan 16;87(1):171. doi: 10.1007/s00248-025-02488-2. Microb Ecol. 2025. PMID: 39820572 Free PMC article.
-
Adhesion Forces of Oral Bacteria to Titanium and the Correlation with Biophysical Cellular Characteristics.Bioengineering (Basel). 2022 Oct 17;9(10):567. doi: 10.3390/bioengineering9100567. Bioengineering (Basel). 2022. PMID: 36290534 Free PMC article.
References
LinkOut - more resources
Full Text Sources
Molecular Biology Databases
Research Materials
