. 2022 May 18:12:840241.
doi: 10.3389/fonc.2022.840241. eCollection 2022.

Identification of Synergistic Drug Combinations to Target KRAS-Driven Chemoradioresistant Cancers Utilizing Tumoroid Models of Colorectal Adenocarcinoma and Recurrent Glioblastoma

Affiliations

Identification of Synergistic Drug Combinations to Target KRAS-Driven Chemoradioresistant Cancers Utilizing Tumoroid Models of Colorectal Adenocarcinoma and Recurrent Glioblastoma

Kshama Gupta et al. Front Oncol. .

Abstract

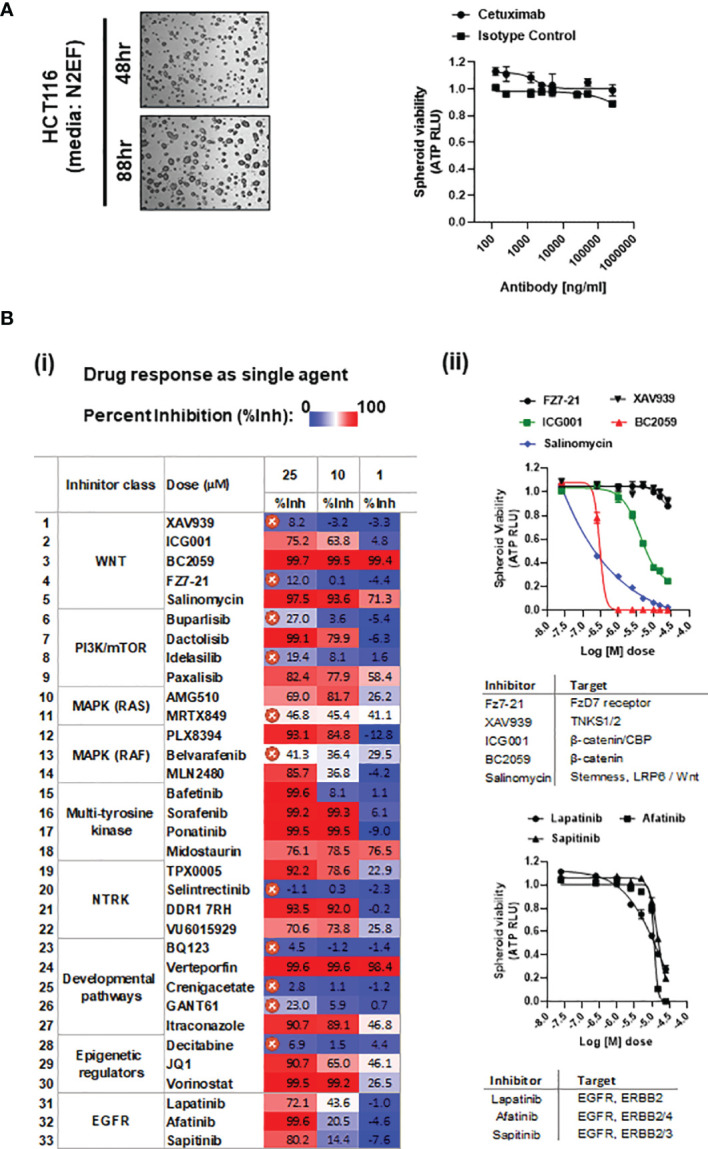
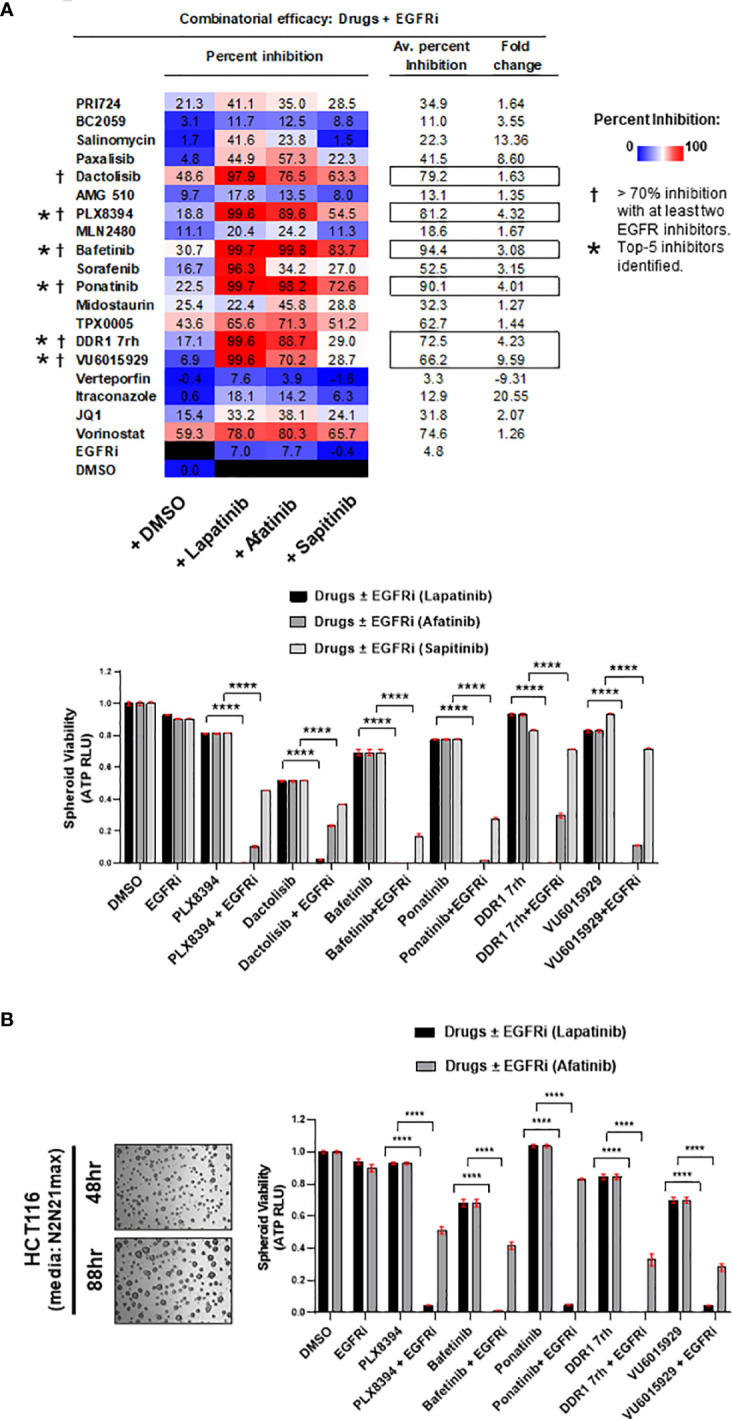
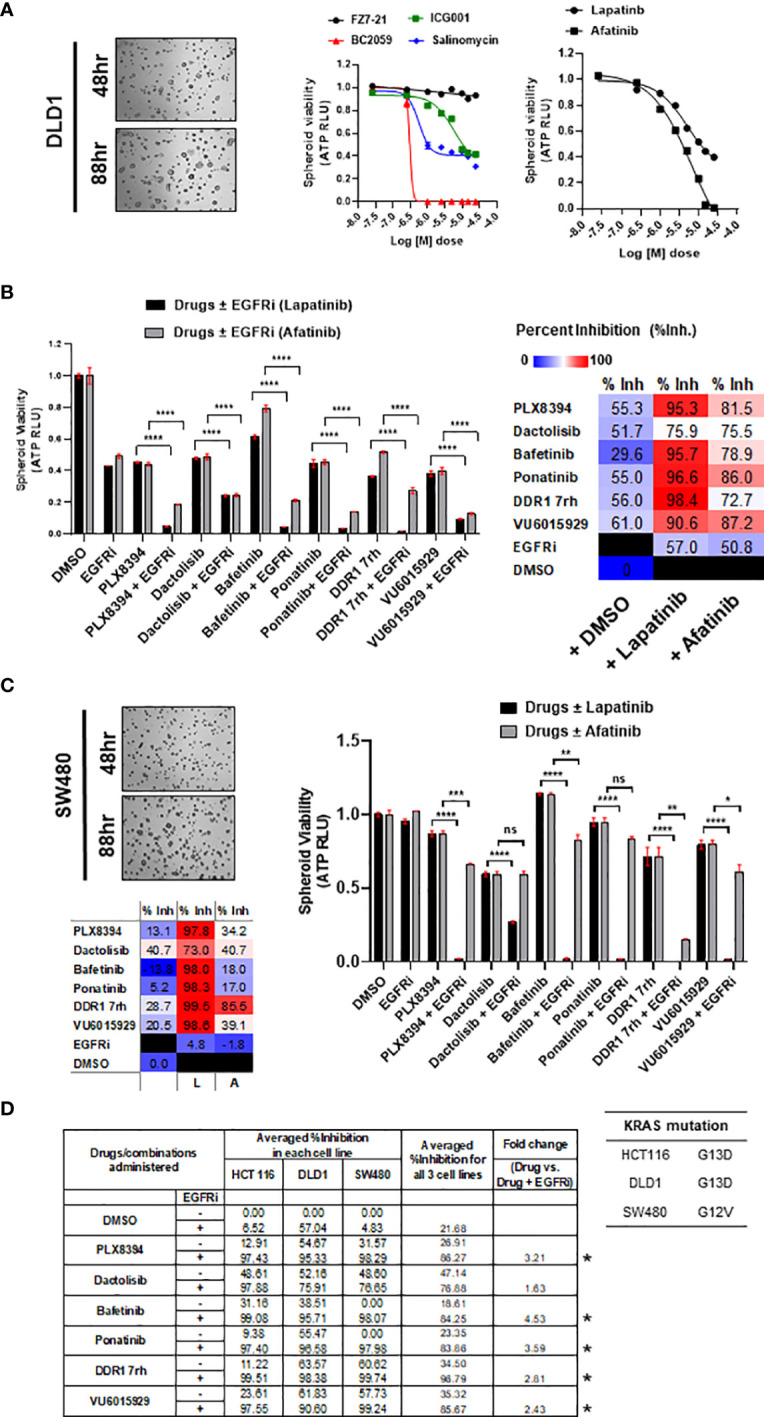
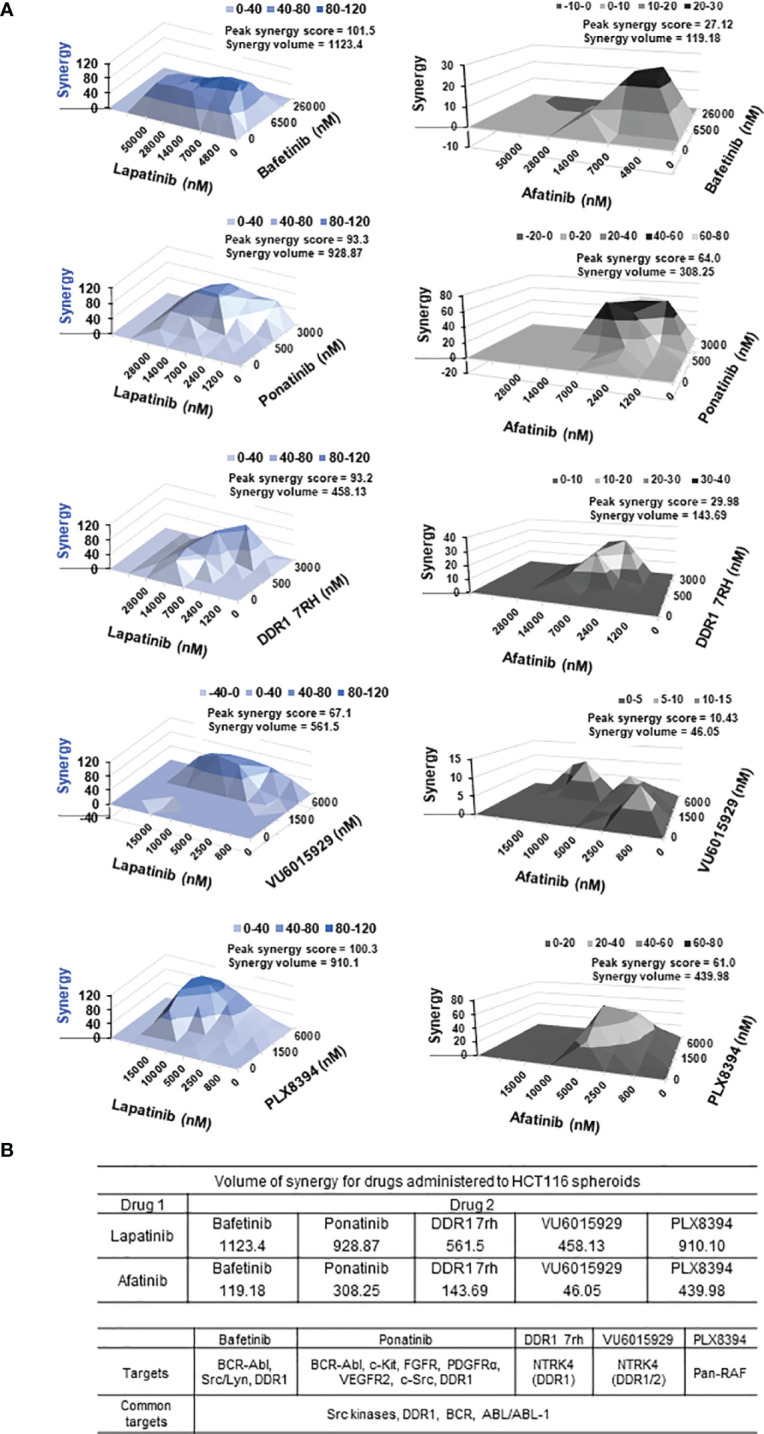
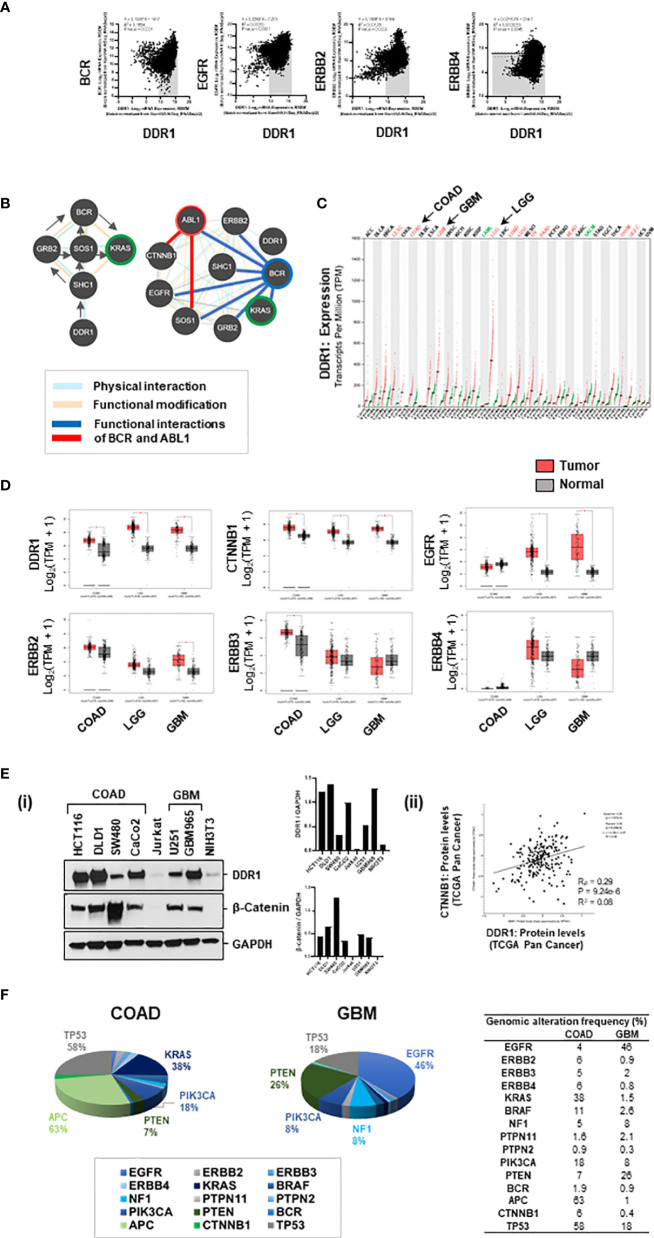
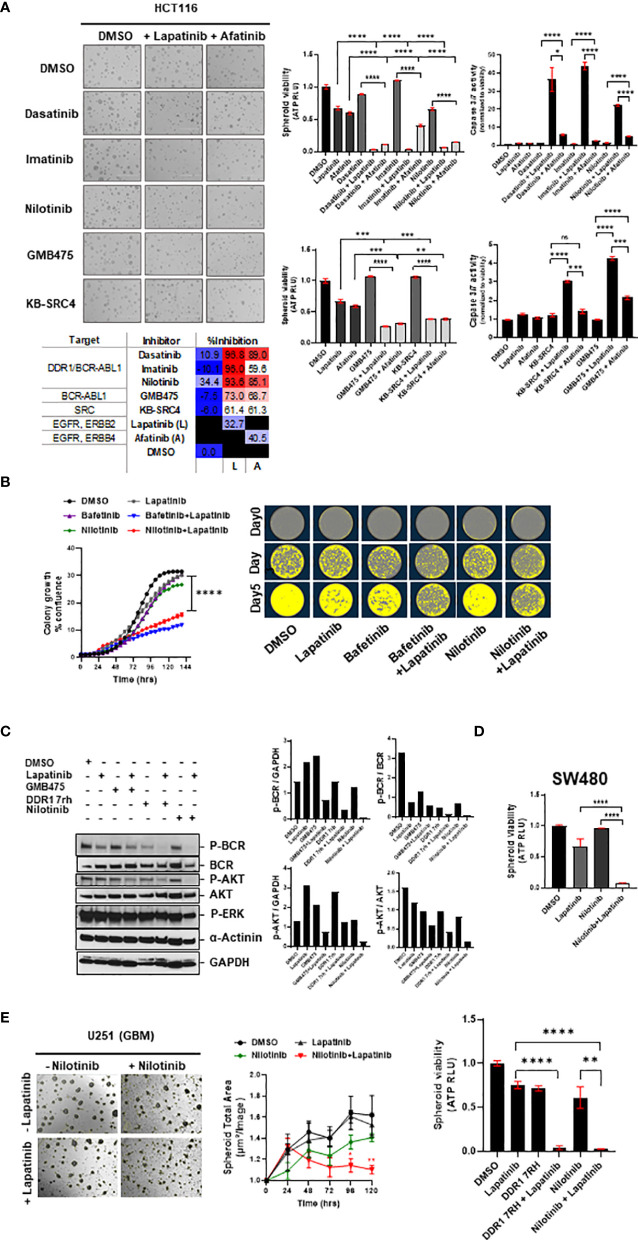
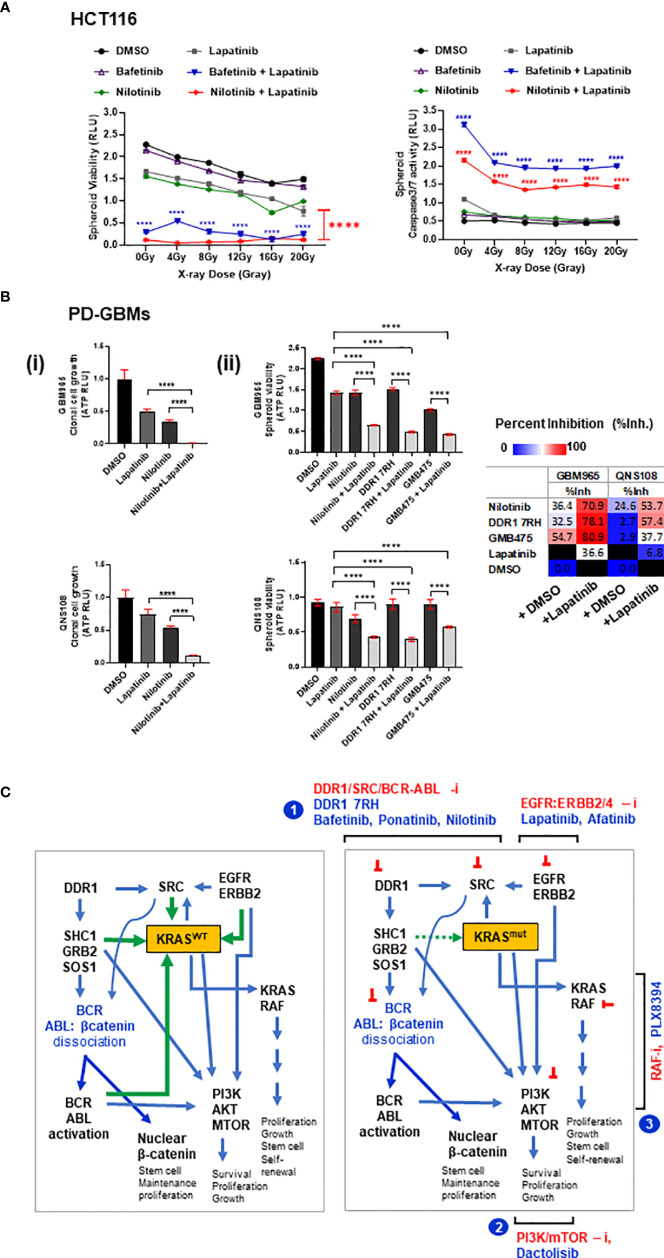
Treatment resistance is observed in all advanced cancers. Colorectal cancer (CRC) presenting as colorectal adenocarcinoma (COAD) is the second leading cause of cancer deaths worldwide. Multimodality treatment includes surgery, chemotherapy, and targeted therapies with selective utilization of immunotherapy and radiation therapy. Despite the early success of anti-epidermal growth factor receptor (anti-EGFR) therapy, treatment resistance is common and often driven by mutations in APC, KRAS, RAF, and PI3K/mTOR and positive feedback between activated KRAS and WNT effectors. Challenges in the direct targeting of WNT regulators and KRAS have caused alternative actionable targets to gain recent attention. Utilizing an unbiased drug screen, we identified combinatorial targeting of DDR1/BCR-ABL signaling axis with small-molecule inhibitors of EGFR-ERBB2 to be potentially cytotoxic against multicellular spheroids obtained from WNT-activated and KRAS-mutant COAD lines (HCT116, DLD1, and SW480) independent of their KRAS mutation type. Based on the data-driven approach using available patient datasets (The Cancer Genome Atlas (TCGA)), we constructed transcriptomic correlations between gene DDR1, with an expression of genes for EGFR, ERBB2-4, mitogen-activated protein kinase (MAPK) pathway intermediates, BCR, and ABL and genes for cancer stem cell reactivation, cell polarity, and adhesion; we identified a positive association of DDR1 with EGFR, ERBB2, BRAF, SOX9, and VANGL2 in Pan-Cancer. The evaluation of the pathway network using the STRING database and Pathway Commons database revealed DDR1 protein to relay its signaling via adaptor proteins (SHC1, GRB2, and SOS1) and BCR axis to contribute to the KRAS-PI3K-AKT signaling cascade, which was confirmed by Western blotting. We further confirmed the cytotoxic potential of our lead combination involving EGFR/ERBB2 inhibitor (lapatinib) with DDR1/BCR-ABL inhibitor (nilotinib) in radioresistant spheroids of HCT116 (COAD) and, in an additional devastating primary cancer model, glioblastoma (GBM). GBMs overexpress DDR1 and share some common genomic features with COAD like EGFR amplification and WNT activation. Moreover, genetic alterations in genes like NF1 make GBMs have an intrinsically high KRAS activity. We show the combination of nilotinib plus lapatinib to exhibit more potent cytotoxic efficacy than either of the drugs administered alone in tumoroids of patient-derived recurrent GBMs. Collectively, our findings suggest that combinatorial targeting of DDR1/BCR-ABL with EGFR-ERBB2 signaling may offer a therapeutic strategy against stem-like KRAS-driven chemoradioresistant tumors of COAD and GBM, widening the window for its applications in mainstream cancer therapeutics.

Keywords: BCR-ABL1; COAD; DDR1; EGFR-ERBB2; GBM; KRAS; Wnt/b-catenin; chemoradioresistance.


Conflict of interest statement

The authors declare that the research was conducted in the absence of any commercial or financial relationships that could be construed as a potential conflict of interest.

Figures

Figure 1
Figure 1
(A) Representative bright-field images of HCT116 spheroids cultured in media having nitrogen supplement (N2), plus EGF and FGF2 (N2EF), taken at time-points indicated. (i) Spheroid viability in response to cetuximab (anti-EGFR) treatment on HCT116 multi-spheroids cultured in N2EF media. (B) (i) Drug screening: inhibitors listed were administered as single agents on HCT116 (N2EF) multi-spheroids, and spheroid viability was estimated. Table includes percent inhibition (%Inh.) observed for each drug when administered at concentrations of 25, 10, and 1 µM (dose–response curves are included in Supplementary Figure 3 ). IC50 was not reached for drugs marked with a cross, which were excluded further from the study. (ii) Single-agent spheroid viability curves for WNT pathway inhibitors and small-molecule inhibitors to EGFR/ERBB proteins on HCT116 multi-spheroids.
Figure 2
Figure 2
(A) Efficacy of the drugs in combination with EGFR small-molecule inhibitors (EGFRi). Drugs were administered on multi-spheroid of HCT116 (N2EF), and spheroid viability was measured. Table indicates percent inhibition obtained for each of the drugs alone, or in combination with lapatinib, afatinib, or sapitinib. Color scale of percent inhibition indicates overall combinatorial efficacy of lapatinib > afatinib > sapitinib. In columns on the right, averaged percent inhibition for each drug when administered in combination with all three EGFRi, and fold change between drug+EGFRi and drug alone is mentioned. Inhibitors marked with a dagger (†) are prime 6 combinatorial drugs identified, which showed >70% inhibition with at least two out of three EGFR inhibitors tested. Top 5 inhibitors (marked with asterisk, *) had averaged percent inhibition ≥50 and fold change ≥2. Bar graphs indicate relative spheroid viability of HCT116 multi-spheroids when administered with the prime 6 combinatorial leads identified. (B) Representative images of HCT116 multi-spheroids obtained by culturing in additional media supplemented with N2 and N21max. Top 5 combinatorial leads identified were validated in combination with EGFR inhibitors (lapatinib and afatinib) on HCT116 multi-spheroids cultured in N2N21max. Bar graphs for combination treatments tested are represented on the right. ****p < 0.0001.
Figure 3
Figure 3
(A) Representative bright-field images of multi-spheroids obtained for DLD1 cultured in N2N21max media, at time-points indicated. Dose–response curves (right) indicate the efficacy of WNT pathway inhibitors and EGFR small-molecule inhibitors (lapatinib, and afatinib) as single agents on DLD1 spheroid viability. (B) Combinatorial efficacy of the prime leads identified when administered on multi-spheroids from DLD1. Bar graphs indicate relative spheroid viability of DLD1 when treated with respective drugs ± EGFR inhibitors (lapatinib and afatinib). Table on the right shows percent inhibition values calculated for all 6 drugs alone, or in combination with EGFRi lapatinib and afatinib. Color scale indicates lapatinib to have higher combinatorial efficacy than afatinib. (C) Combinatorial efficacy of lapatinib with prime 6 leads was validated in an additional line SW480, harboring KRAS G12V mutation. Representative bright-field images (left) show multi-spheroids for SW480 cultured in N2N21max media at indicated time-points. Table lists KRAS mutations known for the respective cell line SW480, having G12V, as opposed to G13D in HCT116 and DLD1. Bar graphs (right) indicate relative spheroid viability of SW480 when administered with respective drugs ± EGFR inhibitor lapatinib. (D) Table (bottom) includes averaged percent inhibition obtained for each of the COAD cell lines (HCT116, DLD1, and SW480) when administered with drugs ± EGFR inhibitor, lapatinib, and afatinib. Averaged percent inhibition for all three cell lines, and fold change observed between drug administered in combination (+EGFRi) and drug alone is mentioned in columns on the right. Inhibitors marked with an asterisk are the top 5 combinatorial inhibitors identified. *p < 0.05, **p < 0.01, ***p <0.001, and ****p < 0.0001.
Figure 4
Figure 4
(A) Synergy plots for EGFR inhibitors lapatinib (left) and afatinib (right), when administered in combination with drugs (top 5 combinatorial leads: bafetinib, ponatinib, DDR1 7rh, VU6015929, and PLX8394) on HCT116 multi-spheroids cultured in N2EF media. 3D surface plot having a rise of the curve in positive xy-axis indicates synergy. Peak synergy score and volume of synergy (cumulative synergy score) obtained for each of the combinations are indicated in the top right corner of surface plot. Synergy plots were made at the 99% confidence limit. Table (bottom) shows comparison of cumulative synergy scores (volume of synergy), obtained for drug 1 (EGFR inhibitors lapatinib, or afatinib) when combined with drug 2. Details on synergy or antagonism score obtained and dose at which peak synergy score was observed for each of the combinations are tabulated in Supplementary Figure 5 . A matrix for synergy score values and a matrix for percent inhibition obtained for all 25 combination treatments were been created for each of the synergy experiments performed and included in Supplementary Figure 5 . (B) Table lists targets for top 5 combinatorial leads and targets common among them. DDR1, discoidin domain receptor 1 (neurotrophic receptor tyrosine kinase, NTRK4), came up as the most prevalent target among the combinatorial leads.
Figure 5
Figure 5
(A) Genomic associations of DDR1 and EGFR/ERBB2: DDR1 gene positively correlates with genes BCR, EGFR, and ERBB2 in Pan-Cancer (source: cBioportal). (B) Based on pathway commons database, the signaling relay from DDR1 to BCR and KRAS engages adaptor proteins SHC1, GRB2, and SOS1. The protein interactome of DDR1, BCR, and ABL1 with selective proteins on the right shows physical interactions of DDR1 with ERBB2 and SHC1; physical and functional interactions of BCR with EGFR, ERBB2, adaptors, KRAS, and ABL1; and functional interactions of ABL1 with SOS1 and CTNNB1. (C) Relative expression of DDR1 gene in datasets of tumor versus normal samples for various cancer subtypes revealed DDR1 to be maximally elevated in brain cancers, low-grade gliomas (LGG), and glioblastoma (GBM). (D) Boxplots showing relative expression of genes DDR1, CTNNB1 (beta-catenin), EGFR, ERBB2, ERBB3, and ERBB4 in patient versus normal datasets for COAD, LGG, and GBM. GBM tumors have elevated expression of DDR1, CTNNB1, EGFR, and ERBB2. (E) (i) Western blotting for DDR1 and beta-catenin proteins in spheroid lysates from various cell lines of COAD and GBM show DDR1 to be highly expressed in COAD lines HCT116 and DLD1 and patient-derived GBM line GBM965. Beta-catenin is highly expressed in COAD line SW480 and moderately expressed in GBM lines U251 and GBM965. (ii) An overall positive correlation (R = 0.28) was observed between protein expression levels of DDR1 and beta-catenin (CTNNB1) in Pan-Cancer (source: c-Bioportal). (F) Percent genomic alterations of selective genes in datasets of COAD and GBM reveal mutations in KRAS and APC to be prime drivers of COAD; and high prevalence of genomic alterations in EGFR and NF1 genes makes KRAS a potential driver of GBM.
Figure 6
Figure 6
(A) Combinatorial efficacy of DDR1/BCR-ABL1 multi-tyrosine kinase inhibitors (dasatinib, imatinib, and nilotinib) and compound drugs GMB475 and KB-SRC4 when administered with EGFRi (lapatinib and afatinib) on multi-spheroids of HCT116. Representative images (left) and bar graphs (right) indicate spheroid viability and relative caspase 3/7 activity (normalized to viability), with percent inhibition listed in the table at the bottom. (B) Clonal cell proliferation assay performed for HCT116 cells for drugs bafetinib and nilotinib in combination with lapatinib validated the combinatorial efficacy. Clonal cell growth was measured as percent confluence, using IncuCyte. Representative images (right) for clonal cell proliferation obtained at time-points day 0, day 3, and day 5 are pseudo-colored utilizing IncuCyte’s inbuilt clonal dilution module. (C) Western blotting for HCT116 spheroid-lysates prepared 48 h after administration of drugs indicated significant downregulation of phospho-BCR and phospho-AKT levels in DDR1/BCR-ABL with EGFR/ERBB2 inhibitor combination treatment as compared with either of the drugs administered alone. Change in phospho-ERK levels was minimal, indicating the prime signaling affected in combination treatments is BCR-AKT axis. (D) Efficacy of nilotinib in combination with lapatinib validated on viability of multi-spheroids from SW480 (KRASG12V). (E) Representative bright-field images of U251 (GBM) spheroids treated with drugs lapatinib and nilotinib at day 5 post-treatment. Graph (middle) shows reduction in spheroid total area over 5 days post-treatment. Bar graph (right) indicates loss of spheroid cell viability measured on day 5. Statistical significance is indicated as *p < 0.05, **p < 0.01, ***p < 0.001, and ****p < 0.0001.
Figure 7
Figure 7
(A) HCT116 multi-spheroids that recovered from radiation stress induced by administering IR doses from 0 up to 20 Gy were measured for (i) spheroid viability and (ii) caspase 3/7 activity at day 5 post-IR. p-Values for combination treatment of drugs (bafetinib or nilotinib) with lapatinib are marked with asterisks at each of the respective IR doses administered. (B) Combinatorial efficacy of nilotinib plus EGFR inhibitor lapatinib on spheroid formation and viability of patient-derived GBM (GBM-PD) lines GBM965 and QNS108. The intrinsic radiosensitivity of these lines is included in the Supplementary Methods. (C) Proposed model illustrating the signaling networks involving DDR1, SRC kinases, BCR-ABL-β-catenin, EGFR/ERBB2, KRAS, and PI3K/AKT proteins, and site of action of the leads identified. Illustration (left) shows KRASWT cross-talks: activated DDR1 relays its effect via adaptor proteins SHC1/GRB2/SOS1, causing dissociation of BCR-ABL-β-catenin complex (inactive), thereby activating BCR/ABL proteins. BCR and ABL proteins interact to cause activation of KRASWT and PIK3/AKT signaling axis. SRC kinase-activated downstream of DDR1 can engage with KRAS in a positive feedback loop. Additionally, EGFR/ERBB2 receptor complex can activate KRAS-dependent MAPK signaling and PIK3/AKT signaling; activated KRAS can also activate PI3K/AKT axis. Green arrows indicate input signals that activate KRASWT, and blue arrows indicate output signals from KRAS to other signaling intermediates. Illustration (right) depicts these signaling interactions with KRASmut protein, which is nearly constitutively active, thus independent of input signals. Targeting the network of hyperactivated KRAS or KRASmut comprises the following scheme: 1) combinatorial targeting of DDR1 and BCR-ABL1 by specific inhibitors of DDR1 or DDR1/BCR-ABL by multi-tyrosine kinase inhibitors (bafetinib, ponatinib, and nilotinib) in combination with EGFR inhibitors lapatinib and afatinib. Other potential combinations identified are represented as schemes (2) and (3): involving PI3K/mTOR inhibition by dactolisib, in combination with EGFR inhibitors lapatinib and afatinib or KRAS/RAF axis inhibition by PLX8394 in combination with EGFR inhibitors lapatinib and afatinib. These combinatorial schemes can be harnessed to overcome the treatment resistance observed in WNT-activated (stem-like) KRAS mutant tumors. Statistical significance is indicated as ****p < 0.0001.

References

    1. Vasan N, Baselga J, Hyman DM. A View on Drug Resistance in Cancer. Nature (2019) 575:299–309. doi: 10.1038/s41586-019-1730-1 - DOI - PMC - PubMed
    1. Liu YP, Zheng CC, Huang YN, He ML, Xu WW, Li B. Molecular Mechanisms of Chemo- and Radiotherapy Resistance and the Potential Implications for Cancer Treatment. MedComm (2020) (2021) 2(3):315–40. doi: 10.1002/mco2.55 - DOI - PMC - PubMed
    1. Olivares-Urbano MA, Griñán-Lisón C, Marchal JA, Núñez MI. CSC Radioresistance: A Therapeutic Challenge to Improve Radiotherapy Effectiveness in Cancer. Cells (2020) 9(7):1651. doi: 10.3390/cells9071651 - DOI - PMC - PubMed
    1. Zhan T, Rindtorff N, Boutros M. Wnt Signaling in Cancer. Oncogene (2017) 36:1461–73. doi: 10.1038/onc.2016.304 - DOI - PMC - PubMed
    1. Hobbs GA, Der CJ, Rossman KL. RAS Isoforms and Mutations in Cancer at a Glance. J Cell Sci (2016) 129(7):1287–92. doi: 10.1242/jcs.182873 - DOI - PMC - PubMed